Environmental science finds that so-called heat islands occur when urbanized areas experience much higher temperatures than neighboring outlying areas within major metropolitan areas. In and around U.S. cities, more affluent parts of these metropolises are typically heavily covered with trees and green vegetation, while areas that have a high concentration of office buildings and dense residential areas are usually located in the downtown sections of cities, and are in and around more impoverished communities.
The inequitable consequences of these heat islands in the summer months of the year—and increasingly in the late spring and early autumn, too—are many and are growing due to climate change. Consider that in today’s exceedingly hot summer climate, intercity metropolitan temperatures can differ significantly even between neighborhoods. In many major metropolitan localities, such as Washington, DC, there is, at times, as much as a 17 degree Fahrenheit difference between inner-city temperatures and surrounding urban areas. So, one area of a major U.S. city could be enjoying a warm, 88 F day on the same day and time when another area is contending with temperatures of 105 F.
What are the inequitable consequences associated with what environmental economists refer to as “thermal inequality” due to heat islands? Varying heat levels within cities increase demand on a metropolitan area’s energy grid, often leading to power outages in less wealthy parts of those cities just when demand is highest due to the heat island effect. There are losses in labor productivity among workers in dense and less wealthy urban centers due to high heat levels. There are increased rates of hospitalizations due to seasonal heat islands. And rises in urban crime also are linked to heat islands.
Another important way that variations in temperatures within metropolitan areas affect economic outcomes relates to how heat islands shape housing demand and, ultimately, housing costs. My own forthcoming research shows the effects of increased levels of heat on rental property prices within metropolitan statistical areas, or MSAs, of the United States. My initial findings reflect that over time, as temperatures continue to increase, two trends are becoming more pronounced.
One trend points to rising rental prices in some metropolitan statistical areas. As localities within some MSAs that are habitually cooler begin to warm, this warming shifts the climate of places with traditionally harsh winters, making them shorter, less severe, and more bearable. This leads to an increase in rental housing demand as individuals begin to migrate to areas of the United States with more temperate climates.
My findings also show the inverse to be true. The other trend I identify is that as the majority of renters in hotter cities continue to experience rising temperatures for longer periods of time, heat will begin to serve more as a dis-amenity, marking the point when households will begin to migrate in search of less severe temperatures and causing rental housing demand in these places to decrease over time.
There is supporting research regarding the effect of high temperatures on home prices for buyers, as opposed to renters, with similar findings. These findings suggest that both renters and buyers in Northern metropolitan areas may be at risk of increased price points as heat levels continue to rise more rapidly and for longer periods of time each year elsewhere around the country.
Affordable housing also is correlated metropolitan localities have high percentages of building density that lowers the available area for green space. This dynamic, combined with the fact that the most affordable housing is often located in the warmest and most congested parts of the city, leaves little room for an improved quality of life. As such, individuals living in these areas are not only subject to heightened levels of heat within their homes, but also to warmer temperatures during their routine commutes to their respective places of employment.
The evidence of the effects of thermal inequality on strong and sustainable economic growth arises largely in research connecting the impact of rising heat in local communities and labor productivity in those communities. Recent research by economists Patrick Behrer at the World Bank, R. Jisung Park at the University of California, Los Angeles, Gernot Wagner at Columbia Business School, and Colleen Golja and David Keith at Harvard University explores the effects of increased heat on labor productivity, work hours, and income in the workplace of poorer communities in the United States. They find that on days when the temperature exceeds 90 degrees Fahrenheit, there is a reduction in average weekly pay of about 2.2 percent. This effect is proportionately lower for wealthier localities, they find, with their results showing a weaker effect of higher temperatures for the upper-90th percentile of the population.
Of course, there are other notable and costly effects of increased heat. High temperatures can induce medical illness, and during summer months in highly dense metropolitan areas, there are often increased reports of cases associated with heat-related illness, such as heat stroke and dehydration. The economic effects involve increased demand for emergency response personnel, supplies, and the increased use of medical facilities. The cost of increased levels of heat are intensified for people of color and in less affluent communities, with heat-related hospitalizations costing, on average, $1,000 more for patients of color, compared to White patients.
Warmer temperatures also increase the cost of energy. As more energy is needed to keep a home at comfortable temperature levels, the demand on the power grid increases. When outside temperatures pass a certain threshold, it is common for individuals with air conditioners to cool down their homes further. This is where thermal inequality sets in—when areas that are less shaded and highly dense begin to hold higher levels of heat than the surrounding suburban living spaces. Homes located in heat islands face higher demand for air conditioning and thus utilize larger levels of energy to cool their homes. Individuals living in heavily shaded and wooded areas are much less likely to experience the same level of heat, thus resulting in less energy use than their neighboring counterparts.
Heat islands are neither inevitable nor unstoppable, despite the relentless impact of climate change on urban U.S. metropolitan areas. It is key for policymakers at city, state, and federal levels to begin to recognize the extended costs associated with thermal inequality. There are a range of thermal models with conflicting forecast predictions about the long-term effects of climate change, but all the models point to a much warmer climate in the immediate-to-near future, which will only exacerbate the economic toll of intercity thermal inequality. That’s why it is imperative to begin offsetting the negative cost of climate change by simultaneously implementing both mitigation efforts and adaptation measures, as suggested by UCLA’s Park, an environmental economist and the Washington Center of Equitable Growth’s new visiting scholar.
Taking steps to mitigate and adapt to heat islands could include proposed polices similar to those included in the Green New Deal legislation introduced in the U.S. House of Representatives in 2021. Policymakers also could work more specifically to suppress and mitigate factors that lead to heat inequality within U.S. cities. This includes increasing green space mandates and upgrading public housing standards to minimize elevated temperature in homes, such as retrofitting existing properties with green-roof technology. A number of U.S. cities are already doing this, among them Chicago, Portland, Oregon, and New York City.
Additionally, policymakers at the federal, state, and local levels should look to offset costs associated with heat, including making energy more affordable for people in low-income neighborhoods so they can cover the costs of air conditioning, as well as increased medical attention for heat-related illnesses. This could be done by closing the so-called Medicaid gap in Obamacare healthcare exchanges, as most of the states that rejected Obamacare’s Medicaid expansion funding are in the South, where already-hot temperatures will only continue to rise. And tax rebates on a carbon tax could be directed toward lower-income housing in big cities.
Importantly, though, many of these policy solutions to address the effects of heat islands should be applied in just the right amounts so as to not tip the scales from greening metropolitan areas to gentrifying them. Perhaps an additional line of policy would be to form protective measures for those currently residing in areas in need of a green revival. By moving to enact more legislation such as the proposals previewed in this column, policymakers could begin to cool the heat of neighborhood inequality one city block at a time to create stronger and more sustainable economic growth.
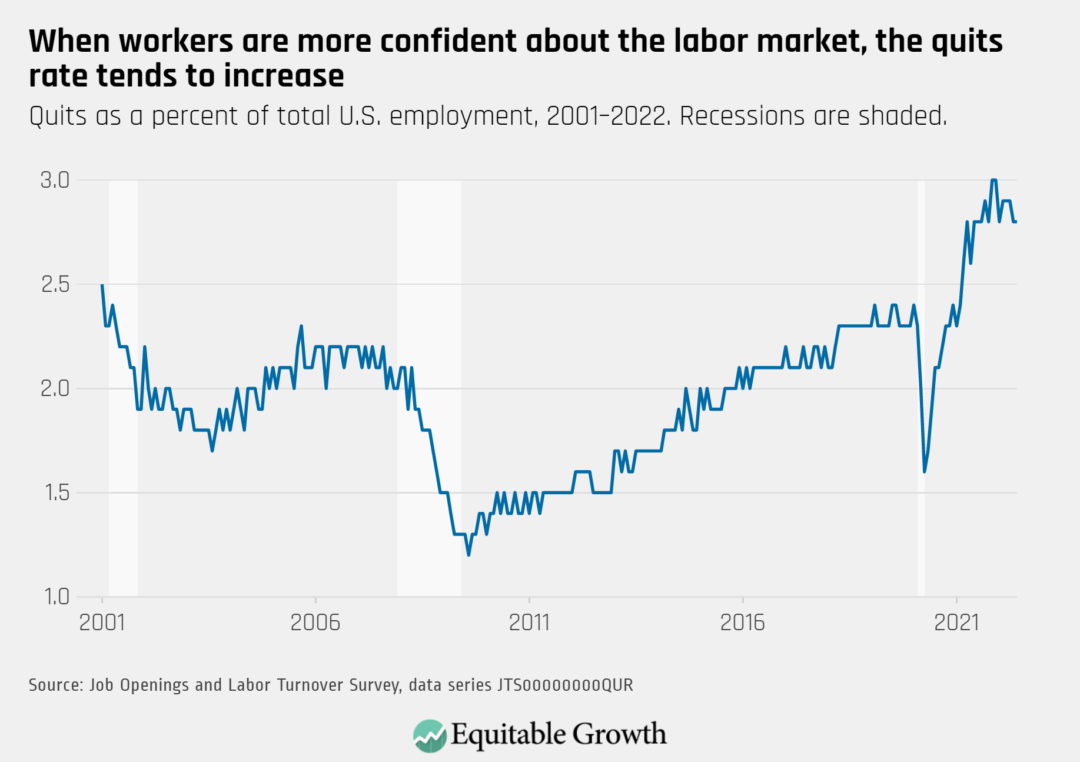
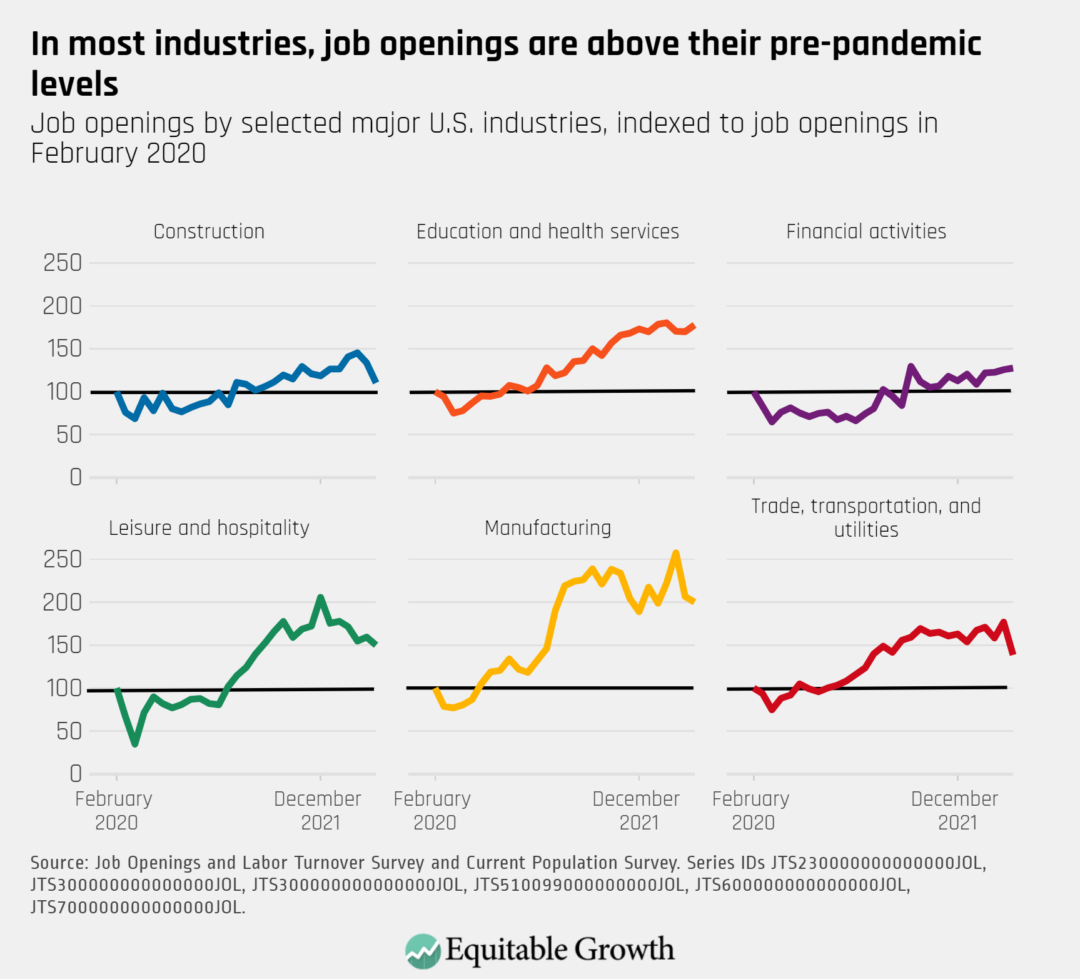
Every month the U.S. Bureau of Labor Statistics releases data on hiring, firing, and other labor market flows from the Job Openings and Labor Turnover Survey, better known as JOLTS. Today, the BLS released the latest data for June 2022. This report doesn’t get as much attention as the monthly Employment Situation Report, but it contains useful information about the state of the U.S. labor market. Below are a few key graphs using data from the report.
The quits rate remained at 2.8 percent as 4.2 million workers quit their jobs in June 2022.
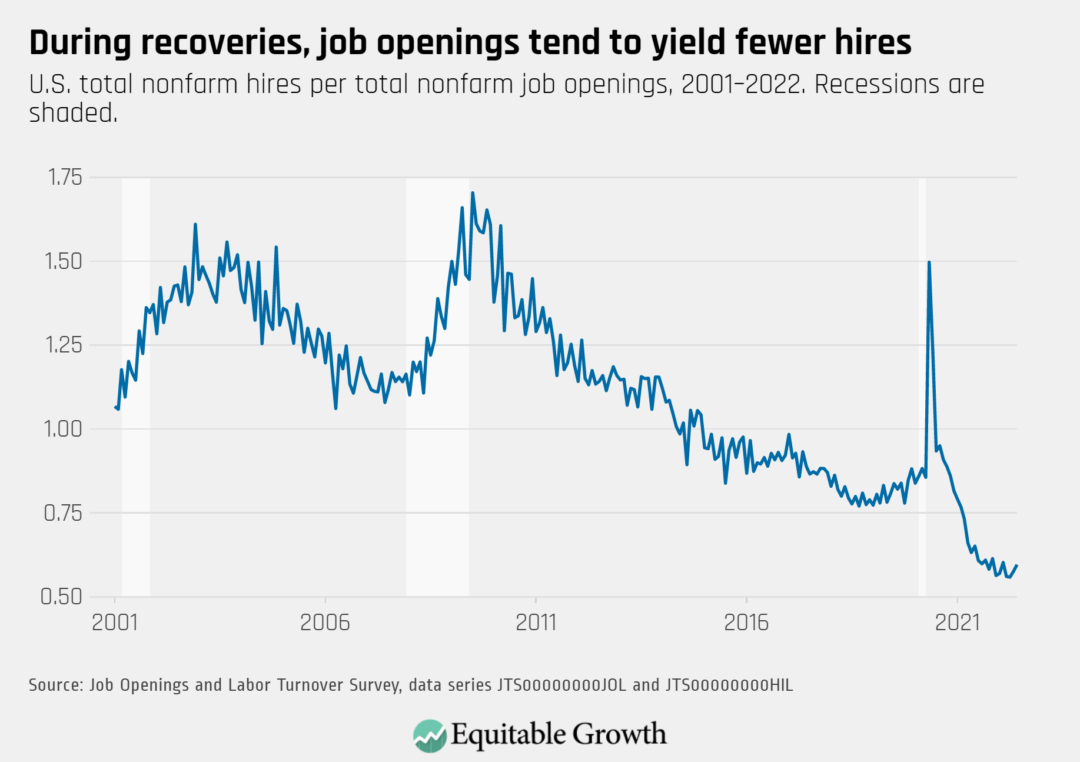
The vacancy yield remains low but increased to about 0.60 in June from 0.58 in May, as the number of reported job openings declined and hires saw little change.
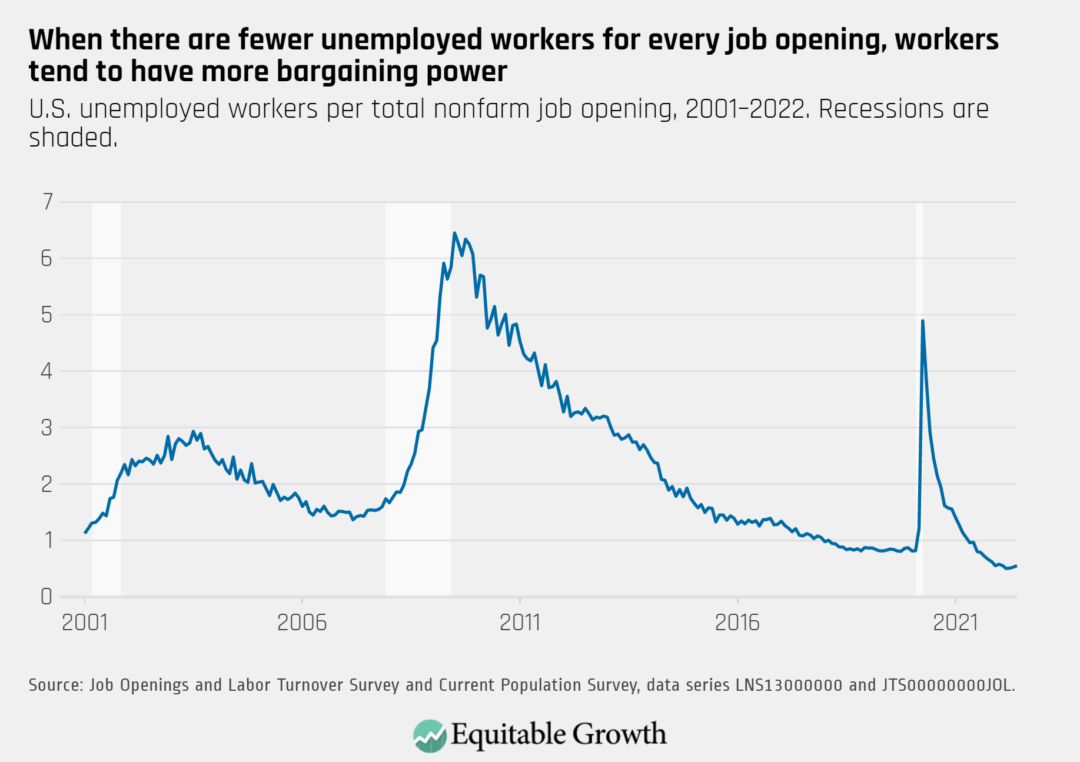
The ratio of unemployed-workers-to-job-openings increased in June to 0.55 from 0.53 in May.
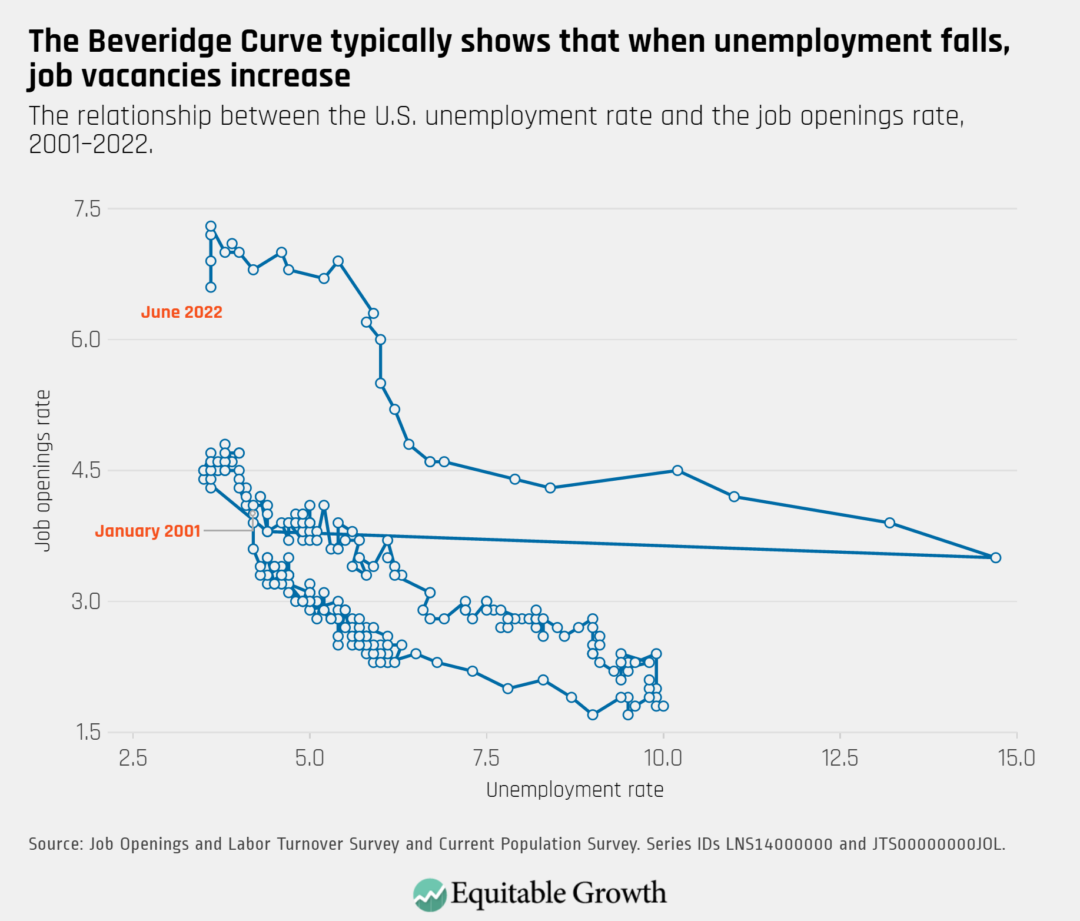
The Beveridge Curve moved downward in June, reflecting a decline in the job openings rate while unemployment remained unchanged.
The overall number of job openings decreased by 605,000 in June (6.6 percent) to 10.7 million, falling in industries such as construction, leisure and hospitality, and trade, transportation, and utilities.
On July 11, the National Bureau of Economic Research kicked off its summer institute, an annual 3-week conference featuring discussions and paper presentations on various topics in economics, including environmental justice and economic mobility, the effects of paid family leave for workers, and racial inequities in the U.S. Unemployment Insurance system. This year’s NBER event was virtual and was livestreamed on YouTube.
We were excited to see Equitable Growth’s grantee network, our Steering Committee, and our Research Advisory Board and their research well-represented throughout the program. Below are abstracts (in no particular order) of some of the papers that caught the attention of Equitable Growth staff during the third week of the conference.
Abstract: “Neighborhoods are an important determinant of economic opportunity in the United States. Less clear is how neighborhoods affect economic opportunity. Here, we provide early evidence on the importance of environmental quality in shaping economic opportunity. Combining 36 years of satellite-derived PM2.5 concentrations measured over roughly 8.6 million grid cells with individual-level administrative data provided by the U.S. Census Bureau and Internal Revenue Service, we first document a new fact: Early-life exposure to particulate matter is one of the top five predictors of upward mobility in the United States. Next, using regulation-induced reductions in prenatal pollution exposure following the 1990 Clean Air Act amendments, we estimate significant increases in adult earnings and upward mobility. Combined with new individual-level measures of pollution disparities at birth, our estimates can account for up to 20 percent of Black-White earnings gaps and 25 percent of the Black-White gap in upward mobility estimated in Chetty and others (2018). Combining our estimates with experiment-induced reductions in pollution exposure from the Moving to Opportunity experiment, we can account for 16 percent of the total neighborhood earnings effect estimated in Chetty and others (2016). Collectively, these findings suggest that environmental injustice may play a meaningful role in explaining observed patterns of racial economic disparities, income inequality, and economic opportunity in the United States.”
“Distinguishing Causes of Neighborhood Racial Change: A Nearest Neighbor Design” Patrick Bayer, Duke University, National Bureau of Economic Research Marcus D. Casey, University of Illinois at Chicago, Equitable Growth grantee William B. McCartney, Purdue University John Orellana-Li, The Graduate Center, City University of New York Calvin S. Zhang, Federal Reserve Bank of Philadelphia
Abstract: “U.S. neighborhoods remain largely stratified by race. The role of racial preferences in driving contemporary neighborhood racial change, however, remains surprisingly controversial. While theories of tipping typically emphasize racial preferences as a principal catalyst for neighborhood change, the emergence of gentrification and related processes in reshaping modern neighborhoods has led some to conclude that race is now of secondary importance. Reconciling these distinct views empirically has proven tough since credibly distinguishing whether households respond directly to the attributes of their neighbors or factors coincidental with the entry of new neighbors is difficult. This paper introduces a novel “nearest neighbor” research design that isolates a component of the household decision to move out of a neighborhood directly attributable to the identities of their neighbors. In particular, we contrast the move rate of homeowners who live immediately nearby a new entrant of a different race to that of homeowners who live farther away on the same block. This within-block comparison helps hold constant many other aspects of the neighborhood and its expected future evolution. Combining detailed data on housing transactions and race in North Carolina between 2005 and 2015, we estimate the causal effect of receiving a different-race neighbor on the likelihood of moving. The results suggest that Black and White homeowners are significantly more likely to move in response to receiving a close neighbor of a different race. However, this effect is heterogeneous across household types: While older White households exhibit the strongest exit responses overall, among Black households, younger households exhibit relatively high move rates. Move reactions among both Black and White households are stronger for homeowners born in the North or Midwest, where residential segregation is especially high, compared to those born in the South.”
“The (Lack of) Dynamic Effects of the Social Safety Net on Human Capital Investment”* Manasi Deshpande, University of Chicago and National Bureau of Economic Research, Equitable Growth grantee Rebecca Dizon-Ross, University of Chicago and National Bureau of Economic Research
Abstract: “How does the expectation of government benefits in adulthood affect human capital investments in childhood? Both economic theory and the experts we surveyed predict that expected future benefits decrease childhood human capital investments through income and incentive effects. We investigate whether this is true by conducting a randomized controlled trial with families of children who receive Supplemental Security Income, or SSI, a cash welfare program for children and adults with disabilities. The vast majority of parents whose children receive SSI overestimate the likelihood that their child will receive SSI benefits in adulthood. We provide randomly selected families with information on the predicted likelihood that their child will receive SSI benefits in adulthood and use this randomized information shock to identify the effect of expectations about future benefits. We find that reducing the expectation that children will receive benefits in adulthood does not increase parental investments in children’s human capital. This zero effect is precisely estimated, and we strongly reject the positive null hypothesis from our expert survey. Reducing the expectation that children will receive benefits in adulthood instead increases parents’ planned labor market effort.” *Note: Email the author for draft, which is under agency review.
Abstract: “Women are vastly underrepresented in leadership positions, but little is known about when and why gender gaps in representation first emerge in the leadership hierarchy. This study uses novel personnel data from a large manufacturing firm to document that gender differences in applications for first-level leadership positions create a key bottleneck in women’s career progression. Women are not less likely to learn about job openings at the firm and do not experience lower hiring likelihoods than male applicants. Instead, gender differences in revealed preferences for leading a team account for women’s lower propensities to apply for first-level leadership positions. Women who rise to the first leadership level are not less likely than men to apply to or to receive subsequent promotions, rejecting the common notion that a glass ceiling at higher-level leadership positions is the key barrier to gender equality.” Note: This research was funded in part by Equitable Growth.
Abstract: “How do administrative burdens influence enrollment in different welfare programs? Who is screened out at a given stage? This paper studies the impacts of increased administrative burdens associated with the automation of welfare services, leveraging a unique natural experiment in Indiana in which the IBM Corporation remotely processed applications for two-thirds of all counties. Using linked administrative records covering nearly 3 million program recipients, the results show that Supplemental Nutrition Assistance Program, Temporary Assistance for Needy Families, and Medicaid enrollments fall by 15 percent, 24 percent, and 4 percent, respectively, one year after automation, with these heterogeneous declines largely attributable to cross-program differences in recertification costs. Earlier-treated and higher-poverty counties experience larger declines in welfare receipt. More-needy individuals are screened out at exit while less-needy individuals are screened out at entry, a novel distinction that would be missed by typical measures of targeting that focus on average changes overall. The decline in Medicaid enrollment exhibits considerable permanence after IBM’s automated system was disbanded, suggesting potential long-term consequences of increased administrative burdens.”
Abstract: “The U.S. Unemployment Insurance, or UI, system operates as a federal-state partnership, where states have considerable autonomy to decide on specific UI rules. This has allowed for systematically stricter rules in states with a larger Black population. We study how these differences in state rules create a gap in the Unemployment Insurance that Black and White unemployed workers receive. Using administrative data from random audits on UI claims in all states, we first document a large racial gap in the UI benfits that unemployed workers receive after filing a new claim. Black claimants receive an 18 percent lower replacement rate (i.e., benefits relative to prior wage, including denials) than White claimants. In principle, the replacement rate of each claimant mechanically depends on the rules prevailing in her state and on her work history (e.g., the earnings before job loss and the reason for separation from prior employer). Since we observe claimants’ UI-relevant work history and state, we are in a unique position to identify the role of each factor. After accounting for Black-White differences in work history, differences in rules across states create an 8 percent Black-White gap in replacement rate (i.e., slightly less than half of the overall gap). Using a standard welfare calculation, we show that states with the largest shares of Black workers would gain the most from having more generous UI rules. Altogether, our results highlight that disparate state rules in the UI institution create racial inequality without maximizing overall welfare.”
Abstract: “This paper analyzes the impact of paid family leave, or PFL, policies in California, New Jersey, and New York on the labor market and mental health outcomes of individuals whose spouses or children experience health shocks. We use data from the restricted-use version of the Medical Expenditure Panel Survey over the years 1996–2019, which allows us to observe individuals’ states of residence, employment status, and the precise timing of their spouses’ and children’s hospitalizations and surgeries (our health shock measures). We use difference-in-difference and event-study models to compare the differences in post-health-shock labor market and mental health outcomes between spouses and parents surveyed before and after PFL implementation, relative to the analogous differences among those in states that did not implement PFL over our analysis time period. We find that the (healthy) wives of individuals with medical conditions or limitations who experience a hospitalization or a surgery are 7 percentage points less likely to report “leaving a job to care for home or family” in the post-health-shock rounds of the data. These women also experience improved mental health, measured based on both self-reports and the use of mental health-related prescription drugs. We find no consistent impacts on the outcomes of men whose spouses have health shocks or on parents of children with health shocks.”
Abstract: “We examine the geographic incidence of local labor market growth across locations of childhood residence. We ask when wages grow in a given U.S. labor market, do the benefits flow to individuals growing up in nearby or distant locations? We begin by constructing new statistics on migration rates across labor markets between childhood and young adulthood. This migration matrix shows 80 percent of young adults migrate less than 100 miles from where they grew up. Ninety percent migrate less than 500 miles. Migration distances are shorter for Black and Hispanic individuals and for those from low-income families. These migration patterns provide information on the first-order geographic incidence of local wage growth. Next, we explore the responsiveness of location choices to economic shocks. Using geographic variation induced by the recovery from the Great Recession, we estimate the elasticity of migration with respect to increases in local labor market wage growth. We develop and implement a novel test for validating whether our identifying wage variation is driven by changes in labor market opportunities rather than changes in worker composition due to sorting. We find that higher wages lead to increased in-migration, decreased out-migration, and a partial capitalization of wage increases into local prices. Our results imply that for a 2 rank point increase in annual wages (approximately $1,600) in a given commuting zone, or CZ, approximately 99 percent of wage gains flow to those who would have resided in the CZ in the absence of the wage change. The geographically concentrated nature of most migration and the small magnitude of these migration elasticities suggest that the incidence of labor market conditions across childhood residences is highly local. For many individuals, the “radius of economic opportunity” is quite narrow.”
Abstract: “We use field experiments to study market-level and firm-level labor supply. Market-level elasticities govern how labor supply responds to temporary productivity shocks. Firm substitution elasticities determine wage markdowns in frictional markets. We find that women are twice as elastic to the market as men. This is true even among high-hours individuals. We find no evidence that women are less likely to switch between firms when relative wages change. Our results suggest that in environments without differences in firm location or amenities, firms with market power have little incentive to pay equally productive women less.”
Abstract: “Why aren’t workplaces better designed for women? We show that changing the priorities of those who set workplace policies creates female-friendly jobs. Starting in 2015, Brazil’s largest trade union made women central to its bargaining agenda. Neither establishments nor workers choose their union, permitting a difference-in-differences design to study causal effects. We find that “bargaining for women” increases female-centric amenities in collective bargaining agreements and in practice (more female managers, longer maternity leaves, higher job protection after maternity). These gains do not come at the expense of women’s or men’s wages or employment, or of firm profits (proxied by exit). They cause women to queue for jobs at treated establishments and quit them less; both men and women revealed preference measures of firm value, but men do not quit more. Prioritizing women in collective bargaining thus lowers within-firm gender inequality through more efficient bargaining, adding amenities highly valued by women without removing those highly valued by men.”
Taxing the rich is one of the central policy debates in this time of rising inequality. Elite taxation can change the distribution of income in society, support equitable growth, and finance public goods and services that improve the quality of life for everyone. None of these goals are well served, however, if taxes lead to high levels of tax flight among U.S. millionaires. Progressive taxation, especially at the state level, ultimately depends on the embeddedness of the tax base. In other words, are the rich “mobile millionaires,” readily drawn to places with lower tax rates? Or are they “embedded elites,” who are reluctant to migrate away from places where they have been highly successful?
Supply-side economics has long argued that taxes on the rich cause avoidance behavior and reduce the incentive to work, invest, and innovate. Amid the growing red state/blue state rivalry in the United States, tax incentives for migration have become a new focus of debate. Why would rich people continue to live in New York, New Jersey, or California when they could save large sums in taxes by moving to places such as Florida, Texas, or Nevada? Of course, taxes also fund public goods that the rich consume—not even the richest city dweller can get to work without public infrastructure—but top earners have greater ability to opt out of many public services such as schools and social services. From this view, the rich seem motivated and mobile—sensitive to taxation and readily capable of exit.
Yet there are myriad social dimensions that rich households face when migrating to avoid taxes. Top earners are often the “working rich,” with many roots in the places where they built their careers. Others are business owners with complex ties between customers, suppliers, and workers that are not easily relocated. Top earners are often married, have school-aged children, and have lived in their state for many years—social factors that tie people to places. These ties represent place-specific social capital, a form of embeddedness that makes migration costly.
Our new working paper, “Taxing the Rich: How Incentives and Embeddedness Shape Millionaire Tax Flight,” examines the joint effect of incentives and embeddedness on the mobility of the rich in the United States. Drawing on administrative tax data from IRS tax returns of top income earners, we study two large-scale “natural experiments,” which are contrasting real-life situations that social scientists investigate to determine cause-and-effect relationships. The first is the federal Tax Cuts and Jobs Act of 2017, which changed tax incentives to favor low-tax states. The second is the COVID-19 pandemic, which began in early 2020 in the United States and which deeply disrupted people’s socioeconomic attachments to places.
The 2017 federal tax bill championed by then-President Donald Trump cut the top income tax rate but also raised taxes on some top earners by capping a deduction used most heavily in so-called blue states: the state and local tax deduction. This made the tax reform highly polarizing, actually raising taxes on millionaires in many blue states, such as New York and California, while cutting taxes in red states, such as Florida and Texas. Many predicted dramatic migration flows of top earners from high-tax to low-tax states. President Trump himself soon moved his permanent residence from New York to Florida.
To study the 2017 tax reform, we used administrative data from IRS tax returns, drawing on more than 12 million observations. We employed so-called difference-in-differences models, which compare the changes in outcomes over time between a population affected by the tax cuts and the pandemic (the treatment group) and a population not affected (the comparison group). Tax-induced migration can occur along two different margins: the decision of whether to move at all and, conditional on moving, what destination to select. We examine each margin in detail.
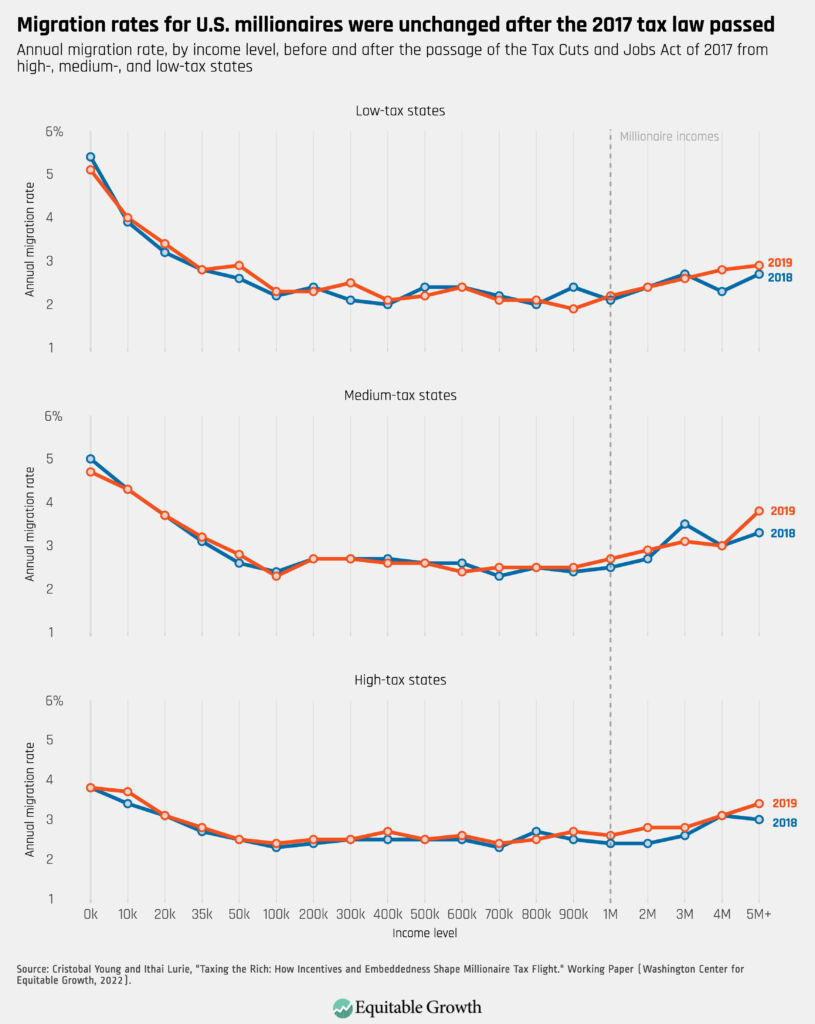
In a typical year, a small number of millionaires circulate between states: Roughly 2.7 percent of the millionaire population moves across state lines, exchanging one state for another. How much did the 2017 tax reform influence this migration? In our working paper, we examined migration rates for every income group, starting from those with the lowest incomes to those making $5 million a year or more. We also examined migration rates for those living in low-tax states, who were incentivized to stay, and high-tax states, who were incentivized to move. Migration patterns before and after the tax reform law passed were essentially identical. (See Figure 1.)
Figure 1
In a 2018 opinion piece published in The Wall Street Journal, “So Long, California. Sayonara, New York,” economists Arthur Laffer and Stephen Moore predicted that “based on the historical relationship between tax rates and migration patterns, both California and New York will lose on net about 800,000 residents over the next three years—roughly twice the number that left from 2014-16.” Then-New York Gov. Andrew Cuomo (D) likewise feared that his state’s millionaires would flee to a better tax environment. Yet our estimate of this migration, as shown in Figure 1, is zero.
Indeed, millionaires generally have low rates of migration—lower than that of the poor—because they are rooted in place by socioeconomic ties, such as employment, marriage, children at home, and business ownership. There is a subset of millionaires with high migration rates and who fit the image of the mobile millionaire. They are relatively young, unmarried, childless, and earn their money from capital rather than work. We term these individuals the “anomic elite,” who are unencumbered by place-based attachments. They move more frequently but are a small minority of the millionaire population.
After the decision to move, a second element of tax migration is the choice of destinations that movers select. To analyze this, we focus only on those millionaires who actually move. Among movers, did lower-tax states become more attractive after federal tax reform?
It is perhaps surprisingly common to see millionaires move into states that charge them higher tax rates. Basketball star LeBron James, for example, made a series of moves from Florida (no income tax) to Ohio (5 percent top rate) to California (13 percent top rate). Many millionaire moves are also between states that have roughly the same tax rate. There are many idiosyncratic and personal reasons why millionaires move, and most migrations do not come with a net tax advantage. Nevertheless, there is a systematic pattern in which low-tax states are favored as migration destinations. The effect is modest, but millionaire migration tends to flow from high-tax to low-tax states.
In our database on cross-border migration flows, the elasticity of the millionaire population with respect to the top tax rate is 0.14. For the average state, if top tax rates rise by 1 percent, this causes roughly 13 more out-migrations and 12 fewer in-migrations, from a base population of more than 9,000 millionaires—amounting to a population loss among millionaires of one-third of 1 percent.
We also see that when the tax reform changed the relative tax rates between states, low-tax states increased their share of millionaire destinations while high-tax states lost shares. For California, the Tax Cuts and Jobs Act produced a loss of roughly 380 millionaires from a base population of 81,000, or 0.5 percent of the millionaire population. Similarly, we calculate that Texas gained 140 millionaires due to the 2017 tax law, a 0.4 percent increase on its base population of 39,000 millionaires.
In summary, the tax reform did not cause greater numbers of millionaires to migrate. But for those already moving anyway, tax reform played a role in where they moved. In other words, taxes do not affect the decision to move, but, conditional on moving, they do influence the choice of destination—making low-tax states incrementally more attractive.
Given this level of tax migration, how should state governments respond? Do some states have tax rates on the rich that are too high? Would states be better off if they cut taxes? To address this question, we incorporate our estimates of millionaire tax migration into a model of optimal tax rates, which calculates the tax rate on top earners that maximizes revenue. We find that the revenue-maximizing tax rate on the rich, combining federal, state, and local income tax rates, is 66 percent. This is much higher than current tax rates in any state. This means that if states cut taxes in an effort to attract millionaires, the revenue losses would far exceed the gains.
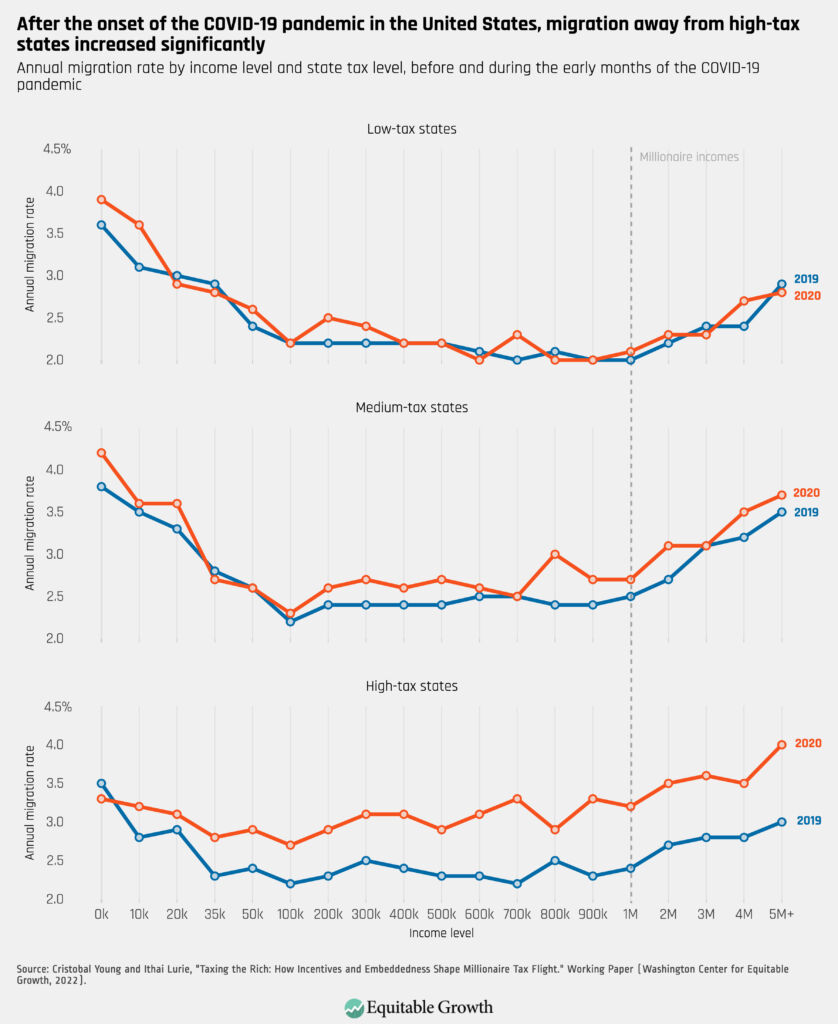
For further insight into the role of embeddedness in tax migration, we examine the impact of the COVID-19 pandemic. Arriving shortly on the heels of major tax reform, the pandemic disrupted almost every socioeconomic factor that ties people to places. Offices and schools closed their doors and moved online. Urban amenities were shuttered. And face-to-face contact became a public health problem. Many homes and apartments felt too small for shelter-in-place orders. The pandemic was an occasion to rethink the geography of work and life, especially for top earners, who could work remotely from anywhere. We test whether this disruption to embeddedness ushered in a new wave of millionaire migration away from high-tax places.
The timing of the tax return data offers a unique way to understand the effects of the COVID-19 pandemic on tax migration. There are two kinds of IRS records that show taxpayer residency: W2 forms that report earnings and other information and 1040 tax returns that households file. These forms are sent to the IRS at different times, offering a before-after analysis of the onset of the pandemic.
In 2020, W2 forms were sent about 6 weeks before the United States declared COVID-19 a national emergency on March 13, 2020. The deadline for filing 1040 returns, in contrast, was delayed until mid-July of that year, and with no-penalty extensions, most millionaires actually filed their returns in August. This means that migration measured by the W2 forms captures mobility occurring entirely before the pandemic, while migration using the 1040 returns includes moves during the early months of the pandemic. We find a clear rise in migration out of high-tax states, especially among higher-income earners, a very modest pandemic migration effect among middle-tax states, and no change in migration rates among low-tax states during the pandemic. (See Figure 2.)
Figure 2
In short, the pandemic upended many people’s ties to places, providing new opportunities to decouple from where they live and from where they work, especially for high-income earners who were able to work from home. We find that once pandemic restrictions arrived, households began questioning the value of living in expensive, high-tax states. In this sense, diminished embeddedness raised the tax-flight cost of taxing the rich.
Conclusion
Taxes on the rich at the state and local level are not costless, but places have considerable fiscal capacity to set their own policies. Tax flight is a product of both incentives and embeddedness, and elite embeddedness dampens financial incentives for migration. When economic action is embedded in ongoing social relations that shape and constrain market behavior, embeddedness gives a layer of insulation from market incentives and pressures.
In the language of economics, greater embeddedness leads to smaller elasticities. When social ties are strong, fiscal and financial incentives have a smaller playing field and less influence on individual behavior. To counteract millionaire migration, states could cut taxes on the rich, attempting to lure back missing millionaires, but we estimate that cutting state and local taxes on the rich leads to severe revenue losses. Thus, while the 2017 tax cuts indeed benefited red states at the expense of blue states, progressive taxes still generate large revenues for blue state expenditure programs. Embeddedness allows states to experiment with new fiscal policies without risking elite exodus or a deep loss of their tax base.
Nevertheless, a challenge for places with progressive taxes is that embeddedness is weakened due to COVID-19, while tax migration incentives have grown due to the 2017 tax law. There was no state fiscal crisis in high-tax states, but the continuing pandemic and its effects on embeddedness raise important questions. Are work-from-home policies here to stay, or will elite offices return to something of their pre-pandemic concentrations in major cities? Will remote technologies make place-specific social capital less important in the future?
Further research is needed to answer these and other questions to shed valuable light on the future of high-tax, high-amenity places in the United States and on the enduring importance of embeddedness among the wealthy.
At its most basic, monopsony refers to a market where there is a single buyer of a good or service. Economist Joan Robinson first introduced the term in the early 1930s and used it to describe how imperfect competition in the market for labor can shift the bargaining power away from workers and toward employers—a dynamic that drags down wages and suppresses employment, just as a monopoly for a seller raises prices and lowers the amount sold. Unlike the perfectly competitive model taught in introductory economics classes, Robinson’s monopsony model captures how outsized employer power can give firms the ability to underpay workers, exacerbate income inequality, and hold back economic growth.
As interest in the relationship between employers’ labor market power and economic inequality has grown in recent decades, there is a growing boom in academic research about monopsony. Scholars studying how labor markets work under imperfect competition have found empirical evidence that challenges Econ 101 assumptions about the relationship between minimum wage increases and employment levels. And as new methods and data sources allow researchers to get a better understanding of employer concentration, a number of economists are proposing novel ways in which antitrust law can be leveraged to promote competition in labor markets.
This primer describes how monopsony offers an alternative model to the perfectly competitive model of the labor market, discusses some of the recent research studying monopsony in the U.S. economy, and tracks how employers’ ability to set wages exacerbates inequality. It then describes how discrimination, longstanding social norms, and demographic characteristics make some groups of workers especially vulnerable to wage suppression. It concludes with a series of public policy measures that, in promoting competition and boosting workers’ bargaining bower, would help mitigate employers’ ability to set wages, address inequities in U.S. labor market outcomes, and support broadly shared economic growth.
Monopsony offers an alternative framework through which to understand the labor market
According to the hypothetical perfectly competitive model of the labor market referenced in introductory economics textbooks, a business that cuts wages will eventually lose all of its workforce. The reason is that under perfect competition, workers have complete freedom to move from job to job in search of higher wages, and when the market is in equilibrium, they are able to find an employment opportunity that pays a wage equal to the value of what they produce, or equal to what economists call the marginal product of labor.
All of these barriers can dampen competition in the labor market and may keep workers from moving on to other employers, even if their current pay is not commensurate with their productivity. And by giving employers an upper hand when determining compensation, monopsony not only dampens wage growth but also drags down employment, since the pay for existing employees is not enough to attract other workers.
The perfectly competitive and monopsonistic models of the labor market
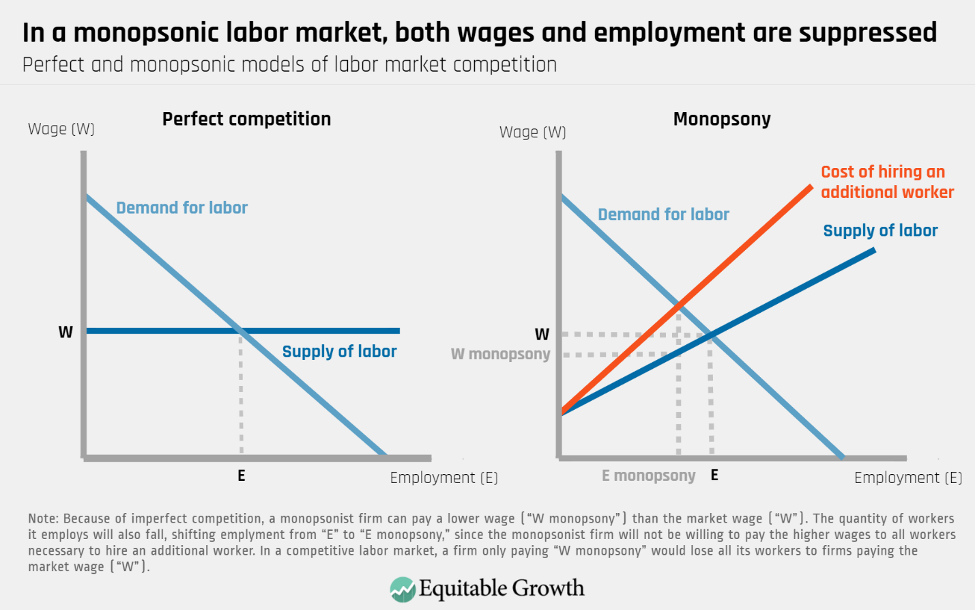
Let’s first take a deeper look at the perfectly competitive model of the labor market. A firm operating in this hypothetical labor market is a price-taker, meaning that it has no option but to pay the market wage—the wage that is determined by the forces of labor demand and labor supply. In economic parlance, this model of perfect competition posits that individual firms face a so-called horizontal labor supply curve, meaning that they can hire all the workers they want as long as they pay a competitive wage, or the “market wage rate.”
In this perfectly competitive model, then, a firm will decide to hire workers up to the point where the marginal revenue product of labor, or the change in revenue the firm will get by hiring one additional worker, intersects with the market wage. So, theoretically, firms operating in a perfectly competitive labor market will be able to hire all the workers they want as long as they pay the market wage. If firms pay less than the market wage or cut wages, then all of their workers will choose to go to other firms that offer higher market wages.
If a labor market is functioning in a more monopsonistic way, however, firms will be price-setters rather than price-takers. The idea is that unlike a firm operating in the perfectly competitive labor market, a monopsonist firm that faces no competition when hiring workers faces an upward-sloping, instead of a horizontal, labor supply curve. As such, if the monopsonist slashes its wages, then it will lose some, but not all, of its workforce. But while these firms will be able to hire workers even if they do not pay competitive wages, they will have to increase pay for all workers every time they want to attract an additional worker. As a result, monopsonist firms will hire fewer workers at lower wages. (See Figure 1.)
Figure 1
Of course, labor markets rarely have a single firm competing for workers. But the monopsonic model nonetheless offers important insights into the relationship between imperfect competition, wages, and employment.
Further, recent research has focused on what scholars call modern or dynamic monopsony—a framework in which a single firm does not have to be the only employer in a given labor market to be able to exercise monopsony power as long as the dynamics of the labor market reflect significant frictions in switching jobs that lend wage-setting power to employers. Indeed, a large and growing body of empirical research is finding evidence that U.S. employers often have the power to set wages.
What recent research says about the presence of monopsony power in the U.S. labor market
As interest in the causes and consequences of imperfect competition grow and new empirical methods and data become more available, there has been an explosion of research about and around monopsony. To study employers’ wage-setting power, economists and other social scientists can measure how likely workers are to quit in response to a decrease in wages, capture the degree of employer concentration in any given labor market or industry, or study the barriers that limit workers’ ability to move from job to job.
In addition, researchers can examine how discrimination, longstanding social norms, and demographic characteristics make some groups of workers especially vulnerable to wage suppression because of these dynamic factors. Next, we review recent studies in each of four buckets of research.
Markdowns and workers’ sensitivity to wage changes
A common way to measure employers’ monopsony power is through what economists call elasticity of labor supply to the firm, a concept that captures how sensitive workers are to wage changes. In the hypothetical perfectly competitive labor market, the elasticity of labor supply facing the firm is infinite, meaning that a 1 percent reduction in pay would be enough for a business to lose all of its workers, at least in the long run.
Research shows, however, that workers are much less sensitive to changes in pay than the perfectly competitive model would predict, allowing firms to pay wages that are not proportionate to workers’ productivity. In the monopsony literature, calculating the elasticity of labor supply to the firm allows economists to estimate the potential wage markdown, or the gap between the value workers generate for the firm and their actual wages.
There are a number of studies that show the existence of markdowns in labor markets. Recent research on the U.S. manufacturing industry, for example, finds that manufacturing workers employed at an average plant earn only $0.65 for every $1 of value they create, suggesting that the majority of manufacturing plants in the country operate with some degree of monopsony power.
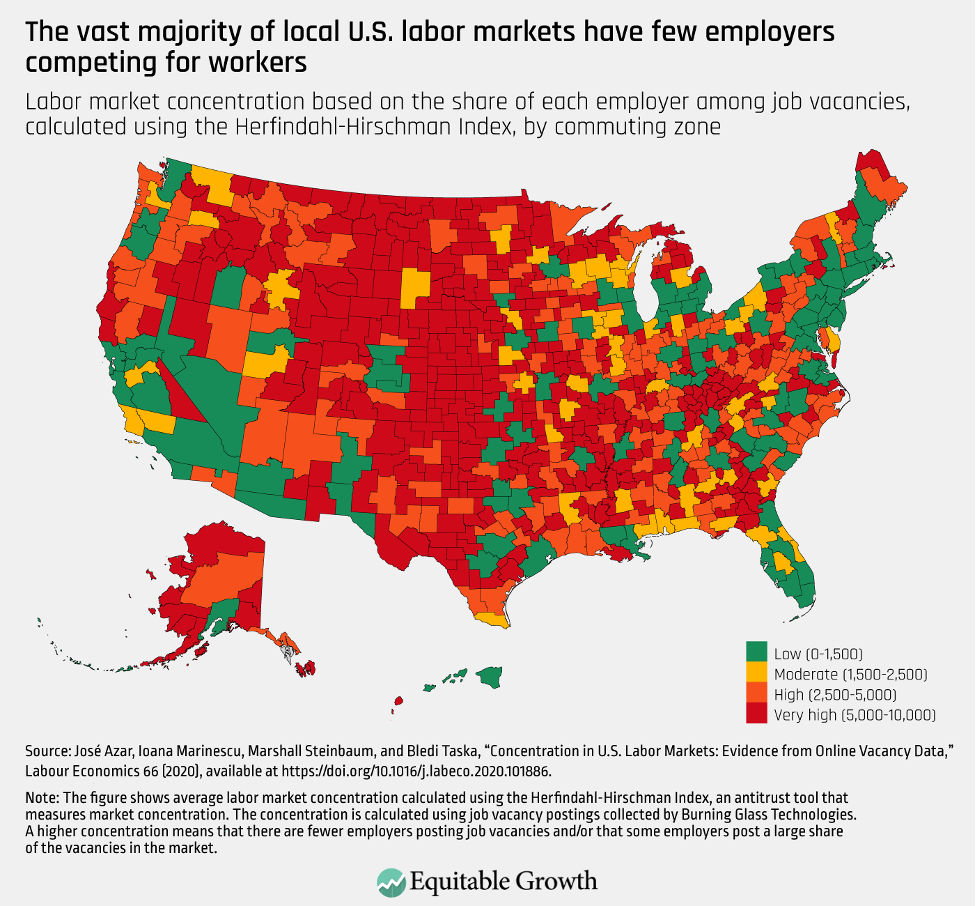
Another approach to study monopsony is to measure labor market concentration, a phenomenon in which only a few employers are competing to hire workers. To study this phenomenon, one team of economists used online job vacancy data to analyze the degree of employer concentration across occupations and commuting zones in the United States. The authors show that about 16 percent of workers in the country are employed in highly concentrated labor markets—labor markets in which few firms are recruiting, and workers are less likely to receive an employment offer.
Consistent with previous evidence, the authors also find that wages tend to be lower in labor markets with fewer recruiting employers. And employer concentration is especially prevalent in less-densely populated labor markets, a dynamic that might help explain why wages are lower in rural areas than in urban areas. (See Figure 2.)
Figure 2
There is also evidence that some labor markets and occupations have substantial employer concentration, thereby reducing wages. Take healthcare services, for instance. In one study of the labor market for nurses, researchers find that the supply of labor to hospitals is fairly inelastic, giving large healthcare employers, such as the U.S. Department of Veterans Affairs, the power to influence pay across the entire sector.
There is also evidence that the entrance of large, dominant employers to local labor markets, particularly those in rural communities, can have wide-ranging effects on the outcomes of workers in those labor markets. A study by Justin Wiltshire of the Institute for Research on Labor and Employment at the University of California, Berkeley finds, for example, that the entrance of Walmart Supercenters in local labor markets leads to overall reductions in both wages and employment in the following 5 years. Another paper finds that workers with guest worker visas are employed in more concentrated labor markets than U.S. workers in general.
Job mobility
Scholars interested in monopsony power also study the barriers that make it difficult for workers to move on to other employers. For instance, contracts, credentials, and certain occupations can keep workers locked in their jobs or places of residence, giving employers the ability to exercise monopsony power. Noncompete agreements—contracts that prohibit workers from joining or creating a competing business—have been shown to depress wages, stop workers from moving on to a better job, and hurt entrepreneurship. And a number of studies show that because they have very specific skills and have made important investments in trainings and licenses, healthcare workers often have low occupational mobility.
Indeed, researchers find that the negative relationship between employer concentration and wages is also shaped by occupational mobility, since some workers may be able to switch occupations out of concentrated industries more easily than others. In a recent paper, Gregor Schubert at the University of California, Los Angeles, Anna Stansbury at the Massachusetts Institute of Technology, and Bledi Taska at the employment data firm Lightcast (formerly Emsi Burning Glass) examine the extent to which workers’ pay reacts to changes in employer concentration within their industry of employment, as well as to their outside job options. Using econometric methods that allow the three researchers to examine variations in local employer concentration that are not the result of local economic conditions—therefore reducing the likelihood that their results are driven by anything other than the degree of competition for workers—the co-authors find that for more than 10 percent of the U.S. workforce, pay is suppressed by 2 percent or more because of employer concentration.
In addition, slack economic conditions can exacerbate employers’ market power, in part because downturns reduce workers’ alternative job opportunities. Research by Gordon Dahl at the University of California, San Diego and Matthew Knepper at the University of Georgia finds, for example, that higher rates of unemployment are likely associated with greater underreporting of sexual harassment at work—evidence that employers are more likely to exploit workers when those workers have fewer outside options and the prospect of losing a job is more costly.
Similarly, research by Janice Fine, Jenn Round, and Hana Shepherd of Rutgers University and Daniel Galvin of Northwestern University finds that during the Great Recession of 2007–2009, higher joblessness hurt low-wage workers’ labor market power. Specifically, the team of researchers shows that there was an important rise in minimum wage violations during that recession, disproportionately hurting women, non-U.S. citizens, and Black and Latino workers.
Discrimination, longstanding social norms, and demographic characteristics can make some workers especially vulnerable to employers’ monopsony power
Characteristics such as race, ethnicity, gender, level of formal education, and geographic location can all play a role in the ability of workers to move from job to job, rendering some groups of workers especially vulnerable to employers’ wage-setting power. For instance, Kate Bahn at the Washington Center for Equitable Growth and Mark Stelzner at Connecticut College, put forth a new theoretical model that shows how greater care responsibilities and lower levels of household wealth disproportionately expose Black and Latina women to wage suppression. The reason, Bahn and Stelzner find, is that care obligations and lack of access to resources constrain workers’ employment options and job search process. And because employers are often aware of these disparities, they can exploit the constraints faced by Black and Latina women workers in the form of lower wages.
Indeed, there are a number of ways in which disparities in wealth and care responsibilities can affect workers’ job-search processes and employment prospects. A worker caring for an elderly parent, for instance, will be less likely to move to an employment opportunity in another state. And a worker without a financial cushion will be much less able to take the time they need to find a job that is a good match for their interests and skills—a type of pressure that disproportionately affects workers of color. According to a 2019 survey by the U.S. Federal Reserve, White families’ median wealth ($188,200) is more than 7 times greater than Black families’ median wealth ($24,100) and more than 5 times greater than Latino families’ median wealth ($36,00).
Other studies show that monopsonistic forces affect mothers and fathers in different ways, helping explain why having children widens the wage gap between men and women. And persistent features of the U.S. labor market, such as hiring discrimination against Black job-seekers, help explain why workers of historically marginalized groups face greater costs when a worker separates from a job.
Public policies that boost competition and workers’ bargaining power can counter employers’ monopsony power
As the mirror to the term “monopoly,” which describes a market where there is just one buyer, monopsony refers to a market where there is just one seller. And like monopolies, monopsonies create a number of economic inefficiencies that hurt workers and hold back growth.
Effective public policy and strong labor market institutions, however, can temper employers’ wage-setting power. For example, a paper by Marcel Steffen Eckhardt and Michael Neugart of Technical University of Darmstadt finds that competition policy, such as antitrust regulation, and boosting worker power, including institutional support for collective action, reinforce each other, leading to a greater overall improvement in the functioning of the labor market than the sum of either policy area alone.
Let’s briefly examine some of these policies to deal with monopsony power.
Competition and antitrust policy
One important way to push back against employers’ monopsony power is through competition and antitrust policy. Suresh Naidu at Columbia University, Eric Posner at the University of Chicago, and E. Glen Weyl at Yale University propose, for instance, that current antitrust policy largely fails to evaluate and address how employer concentration affects workers and labor markets. To mitigate employers’ monopsony power, antitrust regulation could therefore be updated to consider possible harms to labor market competition when evaluating the effects of mergers and acquisitions.
Another way to boost competition in the market for labor is to ban noncompete agreements, especially for low-wage workers. Currently, almost 1 in 5 U.S. workers are bound by noncompetes, and while they are more prevalent in higher-paying jobs, about 13 percent of workers earning less than $40,000 per year are currently subject to one. Banning noncompetes for low-wage workers would therefore eliminate one important barrier that constrains job mobility by keeping workers from moving on to better employment opportunities.
Promote worker voice and bargaining power
The second public policy area involves measures that boost workers’ bargaining power. In 2021, more than 1 million workers in the United States were paid the federal minimum wage or less. After more than a decade of remaining frozen at $7.25 an hour, increasing the federal minimum wage would limit employers’ ability to pay workers a wage that was well below the value they create. In labor markets where employers have monopsony power, a higher minimum wage would not only lead to an earnings increase for the lowest-paid workers and a decline in economic inequality, but also would likely boost employment.
Further, in a national labor market characterized by prevalent monopsony, research suggests that the federal minimum wage is a useful tool for mitigating regional wage inequality and improving overall labor market outcomes.
Other public policies that would boost workers’ bargaining power include investments in a more robust income-support system and better enforcement of labor protections. Research by Ammar Farooq at Uber Technologies Inc. and Adriana Kugler and Umberto Muratori at Georgetown University shows, for instance, that access to adequate Unemployment Insurance benefits gives workers time to find a job that is a good match for their skills, leading to better-functioning labor markets. In the case of the UI system, necessary reforms include increasing benefit amounts, broadening eligibility requirements so that more workers can access them, and investing in the systems and offices charged with disbursing benefits.
Perhaps most importantly, it is important to make it easier for workers to form and join a union, as well as support effective collective bargaining so that workers can negotiate for better pay. In 2021, only about 10 percent of U.S. wage-and-salary workers were members of a union, down from about 30 percent between the mid-1940s and mid-1960s. While unions were an important equalizing force during the decades when they represented a large share of the country’s workforce, judicial and business hostility toward organized labor limits unions’ ability to deliver better working conditions for workers.
Policymakers can boost the power of organized labor by expanding the right to organize to self-employed workers and independent contractors, strengthening the right to strike, and holding employers accountable for unfair and illegal practices against organizing efforts. Future improvements to worker power could also include bold proposals to introduce sectoral bargaining—where workers across an entire sector of the economy bargain together through a union—to the United States.
Conclusion
Workers in the United States have experienced decades of wage suppression and not sharing the gains of economic growth. Monopsony suggests that these outcomes are the result of broad and common market failures, holding back both wages and employment and resulting in deadweight loss to the entire U.S. economy. Increasing worker power and enhancing competition work together to ensure the economy functions both efficiently and fairly for workers and for employers.
On July 11, the National Bureau of Economic Research kicked off its summer institute, an annual 3-week conference featuring discussions and paper presentations on various topics in economics, including disaggregating income growth, labor market outcomes of technological innovations, and welfare implications of regulating tech companies. This year’s NBER event is virtual and is being livestreamed on YouTube.
We’re excited to see Equitable Growth’s grantee network, our Steering Committee, and our Research Advisory Board and their research well-represented throughout the program. Below are abstracts (in no particular order) of some of the papers that caught the attention of Equitable Growth staff during the second week of the conference.
Check out the round-up from week 1, and come back next week for the round-up from the third and final week.
“Real-Time Inequality” Thomas Blanchet, University of California, Berkeley Emmanuel Saez, University of California, Berkeley and NBER, former Steering Committee member Gabriel Zucman, University of California, Berkeley and NBER, Equitable Growth grantee
Abstract. This paper constructs high-frequency and timely income distributions for the United States. We develop a methodology to combine the information contained in high-frequency public data sources—including monthly household and employment surveys, quarterly censuses of employment and wages, and monthly and quarterly national accounts statistics—in a unified framework. This allows us to estimate economic growth by income groups, race, and gender consistent with quarterly releases of macroeconomic growth, and to track the distributional impacts of government policies during and in the aftermath of recessions in real time. We test and successfully validate our methodology by implementing it retrospectively back to 1976. Analyzing the COVID-19 pandemic, we find that all income groups recovered their pre-crisis pretax income level within 20 months of the beginning of the recession. Although the recovery was primarily driven by jobs rather than wage growth, wages experienced significant gains at the bottom of the distribution, highlighting the equalizing effects of tight labor markets. After accounting for taxes and cash transfers, real disposable income for the bottom 50 percent of the income distribution was 20 percent higher in 2021 than in 2019 but fell in the first half of 2022, as the expansion of the welfare state during the pandemic was rolled back. All estimates are updated with each quarterly release of the national accounts, within a few hours.
Note: This research was funded in part by Equitable Growth.
Abstract. Amazon.com Inc. acts as both a platform operator and seller on its platform, designing rich fee policies and offering some products direct to consumers. This flexibility may improve welfare by increasing fee discrimination and reducing double marginalization but may decrease welfare due to incentives to foreclose rivals and raise their costs. This paper develops and estimates an equilibrium model of Amazon’s retail platform to study these offsetting effects and their implications for regulation. The analysis yields four main results. First, optimal regulation is product- and platform-specific. Interventions that increase welfare in some categories decrease welfare in others. Second, fee instruments are substitutes from the perspective of the platform. Interventions that ban individual instruments may be offset by the endogenous response of existing and potentially new instruments. Third, regulatory interventions have important distributional effects across platform participants. And fourth, consumers value both the Amazon Prime program and product variety. Interventions that eliminate either of the two decrease consumer, as well as total, welfare. By contrast, interventions that preserve Prime and product variety but increase competition—such as increasing competition in fulfillment services—may increase welfare.
Note: This research was funded in part by Equitable Growth.
Abstract. Why have less-educated voters abandoned center-left parties in rich democracies in recent decades? While much recent literature highlights the role of cultural issues, we argue that, at least in the United States, the Democratic Party’s evolution on economic issues has played an important role. We show that lower levels of education predict strong support for “predistribution” policies (e.g., guaranteed jobs, public works, a higher minimum wage, protectionism, and support for union organizing) much more than for redistribution policies (taxes and transfers). This robust support for predistribution among the less-educated is mostly unchanged since the 1940s. We then move to the “supply side” of economic policies: Congressional roll-call votes exhibit a decline in predistribution legislation while Democrats are in power, whereas redistribution-related legislation has remained steady. We also document changes in the supply of Democratic politicians. Today, Democratic politicians are far more likely to come from elite educational backgrounds than Republicans, whereas the reverse was true before the 1990s, which might help explain why they no longer propose the predistribution policies favored by the less-educated. We then examine the intersection of the demand and supply sides of economic policy by showing that today, the less-educated are more likely than others to say that Republicans are the party that will keep the country prosperous, whereas from 1948 until the 1990s, the reverse pattern held.
Abstract. We analyze a quasi-experiment of monetary policy and the labor market in Sweden during 2010–2011, where the central bank raised the interest rate substantially while the economy was still recovering from the Great Recession. We argue that this tightening was a large, credible, and unexpected deviation from the central bank’s historical policy rule. Using this shock and administrative unemployment and earnings records, we quantify the overall effect on the labor market, examine which workers and firms are most affected, and explore what these patterns imply for how monetary policy affects the labor market. We show that this shock increased unemployment broadly, but the increase in unemployment varied somewhat across different types of workers, with low-tenure workers in particular being highly affected, and less across different types of firms. Moreover, we find that the structure of the labor market amplified the effects of monetary policy, as workers in sectors with more rigid wage contracts saw larger increases in unemployment. These patterns support models in which monetary policy leads to general equilibrium changes in labor income, mediated through the institutions of the labor market.
Abstract. To study the effects of neighborhood and place-based interventions, this paper incorporates neighborhood effects into a general equilibrium, or GE, heterogeneous-agent overlapping-generations model with endogenous location choice and child skill development. Importantly, housing costs, as well as neighborhood effects, are endogenously determined in equilibrium. Having calibrated the model based on U.S. data, we use simulations to show that predictions from the model match reduced form evidence from experimental and quasi-experimental studies of housing mobility and urban development programs. After this validation exercise, we study the long-run and large-scale impacts of vouchers and place-based subsidies. Both policies result in welfare gains by reducing inequality and generating improvements in average skills and productivity, all of which offset higher levels of taxes and other GE effects. We find that a voucher program generates larger long-run welfare gains relative to place-based policies. Our analysis of transition dynamics, however, suggests there may be more political support for place-based policies.
Abstract. We construct new technology indicators using textual analysis of patent documents and occupation task descriptions that span almost two centuries (1850–2010). At the industry level, improvements in technology are associated with higher labor productivity but a decline in the labor share. Exploiting variation in the extent to which certain technologies are related to specific occupations, we show that technological innovation has been largely associated with worse labor market outcomes—wages and employment—for incumbent workers in related occupations using a combination of public-use and confidential administrative data. Panel data on individual worker earnings reveal that less educated, older, and higher-paid workers experience significantly greater declines in average earnings and earnings risk following related technological advances. We reconcile these facts with the standard view of technology-skill complementarity using a model that allows for skill displacement.
Abstract. Labor protection policies in the 1950s and 1960s helped many low- and middle-wage White workers in the United States achieve the American Dream. This coincided with historically low levels of inequality across income deciles. After the Civil Rights Act of 1964 was enacted, many of the policies that had previously helped build the White middle class reversed, especially in states with a larger Black population. Calibrating a labor search model to match unemployment benefits, bargaining power, and minimum wages before and after the Civil Rights Act, I find changing labor policies explain most of the rise in income inequality since the 1960s.
Abstract. I show that buyer power of firms could either increase or decrease their technology adoption, depending on the direction of technical change and on which inputs firms have buyer power over. I illustrate this in an empirical application featuring imperfectly competitive labor markets and a large technology shock: the introduction of mechanical coal cutters in the 19th century Illinois coal mining industry. By estimating an oligopsony model of production and labor supply using rich mine-level data, I find that the returns to cutting machine adoption would have increased by 28 percent when moving from one firm to 10 firms per labor market.
Abstract. Most of the rise in overall earnings inequality is accounted for by rising between-industry dispersion from about 10 percent of four-digit North American Industry Classification System, or NAICS, industries. These 30 industries are in the tails of the earnings distribution and are clustered especially in high-paying high-tech and low-paying retail sectors. The remaining 90 percent of industries contribute little to between-industry earnings inequality. The rise of employment in mega firms is concentrated in the 30 industries that dominate rising earnings inequality. Among these industries, earnings differentials for the mega firms relative to small firms decline in the low-paying industries but increase in the high-paying industries. We also find that increased sorting and segregation of workers across firms mainly occurs between industries rather than within industries.
Researchers have been assessing and debating the economic damages from climate change for some time, predicting how rising temperatures may affect economic growth and worker productivity, and how best to navigate the all-but-inevitable health and financial shocks for workers amid rising climate-related hazards. This research couldn’t be more important as our understanding of climate change and how to mitigate its effects evolves, and as new data become available and modeling techniques are modernized.
Against this backdrop, Equitable Growth is pleased to welcome R. Jisung Park as a visiting scholar to continue his work examining the impacts of climate change on the U.S. labor force and broader U.S. economy. Park’s interests lie in how environmental factors shape economic opportunity, including the effects of climate on social inequality. His research to date includes examinations of how high temperatures affect human capital outcomes, such as learning and student performance, and how those effects translate into racial and economic achievement divides.
Park also examines the role of adaptive investments, such as air conditioning in schools, in alleviating or exacerbating inequality and disparities in well-being and other outcomes. He likewise studies the labor market outcomes of high temperatures, and excessive heat specifically, for workers in the United States. His previous research with Nora Pankratz at the University of California, Los Angeles and A. Patrick Behrer at Stanford University, published last year in Equitable Growth’s Working Paper series, finds that workplace injuries in California increased by 6 percent to 9 percent on days warmer than 90 degrees Fahrenheit, and by 10 percent to 15 percent on days that exceeded 100 F. This finding applies to workers in occupations based both indoors and outdoors, with widespread implications for worker productivity across industries.
Park will be with Equitable Growth for 18 months, while retaining his academic appointments. As a visiting scholar, Park will work to expand Equitable Growth’s institutional research capacity and policy knowledge in the environmental economics space.
While at Equitable Growth, Park will undertake two independent research projects. One is on labor market frictions and climate change adaptation. The other is on natural disasters and human capital. The findings from these two studies will be published in peer-reviewed journals and presented at academic conferences, contributing to Equitable Growth’s status as an organization for researchers examining inequality and economic growth in the United States. Park will be integral in boosting the organization’s capacity to produce in-house research and analysis on climate change, which policymakers can turn to when crafting environmental legislation and regulations.
Additionally, Park will support Equitable Growth in its role as the bridge between academia and policymakers as we expand our work addressing the economic impacts of climate change. As a former grantee, he is well-positioned to support this important aspect of Equitable Growth’s work. He knows firsthand the value of policymaker connections in reaching a wider audience. He also is experienced at detailing his research to the press and has testified before the U.S. Congress in a House select committee hearing on advancing environmental justice through climate action.
Furthermore, Park will help to grow Equitable Growth’s broader network of scholars, particularly environmental economists studying the disparate impacts of climate change and how it may exacerbate existing inequalities. His role advising the organization in this area will be vital as we seek to fund new projects and connect with researchers making important contributions to the existing climate economics literature through our annual Request for Proposals.
Bringing Park on board is a crucial step forward in Equitable Growth’s plan to examine in more detail the economic impacts and consequences of climate change, as well as reinforce the organization’s status as a trusted resource for evidence-backed policy solutions to various drivers of economic inequality in the United States. We look forward to his tenure with us over the next year and a half, and hope you’ll join us in welcoming him on board!
How have automation and digital technologies contributed to wage inequality in recent decades? It may seem like a straightforward question, but it is one that has been difficult for economists to answer. A new NBER working paper from economist David Autor, an Equitable Growth grantee and a member of Equitable Growth’s Research Advisory Board, explains what we can learn from the evolution of mainstream economic thinking on this question over the past four decades—and shows how much we still have to uncover.
In the working paper, “The Labor Market Impacts of Technological Change: From Unbridled Enthusiasm to Qualified Optimism to Vast Uncertainty,” Autor describes the changing economic approaches to studying the relationship between technology and wage inequality through four frameworks. These are the “education race,” the “task polarization model,” the “automation-reinstatement race,” and the “era of Artificial Intelligence uncertainty.” Throughout, Autor examines key developments in a large body of economic research, and the questions they raise as he and other economists seek to chart the impacts of technologies yet to come.
This exploration of these frameworks of economic thought highlights the ongoing challenges of measuring the impact of new technologies in the labor market. This column will briefly present Autor’s four frameworks and his analysis, and then will examine how the role of worker power and policy can influence the impact of these new technologies in U.S. workplaces.
The “education race”
The first framework Autor discusses, the metaphor of a “race” between education and technology, juxtaposes an ever-increasing rise in demand for educated workers and the ability of a labor market to meet that demand with rising supply. In this model, technology’s role in the workplace is generally assumed to advance over time, but as Autor notes, it is not directly measured. This model also shows the rise of the college wage premium and a similar rise in earnings inequality by educational attainment.
The “education race” framework could illustrate some dynamics of wage inequality in the 20th century, but it cannot explain it on its own. Evidence does not show that there is or has been an ongoing shortage of college-educated workers in practice, and Autor also notes that pay for workers without college degrees in the United States has fallen in ways that would not be predicted by this framework for seeking to understand this “education race.”
The “task polarization model”
Over time, economists have developed methods that attempt to directly or indirectly measure and model the growing presence of new technologies in a variety of ways, from tracing supplier records of industrial robots to analyzing text from patent applications. Researchers also have taken a more granular look at the tasks involved in jobs themselves to understand why the use of technology has affected some jobs more than others, and how tasks shift between and within the jobs themselves.
In the “task polarization model” that Autor describes, a more fine-grained examination of occupational change suggests increasing polarization in the growth of jobs in low- and high-wage occupations. This framework posits that such polarization is due to how technology is used to automate routine work—and displace workers—in many middle-wage occupations while complementing the work of those in higher-wage occupations, especially those that require advanced credentials or high levels of educational attainment. Meanwhile, the influx of formerly middle-wage workers leads to this polarization and depresses wages at the bottom of the pay distribution, even though technology is not necessarily used to displace the work of those in many low-wage occupations.
The “automation-reinstatement race”
This discussion of occupational change underscores another challenge for economic research, which is how to capture changes not only in the jobs themselves, but even the types of tasks that workers may need to do. Autor describes how this leads to the “automation-reinstatement race,” a paradigm that attempts to navigate the ways automation technologies can be used to not just replace human output, but also to enhance human labor and even create new types of work. Whether and how each path is taken has important implications for inequality in wages and other aspects of job quality.
Indeed, some other evidence suggests that employers are deploying technologies to replace workers for automation’s sake rather than because of any gains in productivity or quality. Companies also may deploy technology in ways that appear to create “new” forms of work, such as ridehail drivers, which differ from the “old” work not in their composition of tasks but in their rights, protections, and legal classifications.
The “Artificial Intelligence uncertainty” era
Going forward, can the labor market effects of new technological capabilities in machine learning and “artificial intelligence” be captured by previous models of economic thinking? Autor thinks that the potential implications for work and wage inequality are broad and nuanced enough that new frameworks will be needed. Referring to this present era as one of “Artificial Intelligence uncertainty,” he discusses some of the questions that new frameworks will need to confront, such as the potential paths that the development of artificial intelligence and other technologies will take, and what new roles and areas of specialization will open for workers as these innovations enter workplaces.
Raising these questions does not mean Autor expects a jobless future, whether utopian or dystopian. Rather, he writes, “I do not foresee a moment when labor scarcity (and hence, labor income) is eliminated.”
The role of worker power and policy in shaping the future of work
Autor’s working paper examines how economists have explored whether technological change plays at least some role in widening wage inequality, but also notes that technological change is only one of the many forces at work. In understanding the college wage premium, for instance, Autor mentions that the worsening outcomes for workers without college degrees has taken place in the larger context of declining minimum wages, weakened unions, and other broader structural changes to the U.S. labor market.
The importance of this broader context is reinforced by recent research that shows the importance of policies that strengthen workers’ bargaining power in reducing inequality. Not only is the United States unique among comparison countries in the poor outcomes for its workers without college degrees, but this divergence also can be traced to the countries’ policy choices relating to labor protections, wage setting, and social policies over the past four decades.
Many challenges remain for economic researchers as they seek to understand how technological advances have been used in the workplace, as well as their impact on workers and work in all its forms. Industrial robots can be counted, for example, but technology’s presence elsewhere in workplaces and work processes is often invisible. One case in point: The question of whether management jobs will be automated it still debated, but technology is already deeply layered into many management processes through algorithmic management, a practice that already has widespread consequences for workers and on the organization of work itself.
Similarly, even the question of what tasks make up a job is not driven by technological necessity, but by human decisions within the present policy landscape. Many employers have responded to possibilities opened by technology by reorganizing and deskilling work to be more easily outsourced and automated. And digital technologies have made it easier for employers to monitor and manage workers across these increasingly fractured work arrangements.
Yet these decisions around the deployment of new automation and digital technologies in the workplace—and even the design of the technology itself—are not a natural “consequence” of new technologies, but rather a series of choices enabled and shaped by existing labor and employment law.
Autor in his new working paper cautions against the dangers of assuming there is only one path of technological advancement, writing that “forecasting the ‘consequences’ of technological change treats the future as a fate to be divined rather than an expedition to be undertaken.” In fact, new technologies could be used to benefit workers, such as by making physically demanding jobs less strenuous or enhancing workers’ health and safety, rather than being used to undermine job quality and destabilize work in a downward job-quality spiral.
Policymakers can make real and actionable policy choices that can affect how employers implement automation and digital technologies in their workplaces—choices that can build “high-road” supply chains and strengthen the rights of workers so that they can navigate these technological changes more effectively.
On July 11, the National Bureau of Economic Research kicked off its summer institute, an annual 3-week conference featuring discussions and paper presentations on various topics in economics, including monopsony power, inflation, and discrimination in housing policy. This year’s NBER event is being held virtually and is being livestreamed on YouTube.
We’re excited to see Equitable Growth’s grantee network, our Steering Committee, and our Research Advisory Board and their research well-represented throughout the program. Below are abstracts (in no particular order) of some of the papers that caught the attention of Equitable Growth staff during the first week of the conference.
Come back next week and the following for round-ups from weeks 2 and 3.
Abstract. “This paper proposes a new empirical strategy to estimate the causal effects of 1930s federal “redlining” – the mapping and grading of US neighborhoods by the Home Owners’ Loan Corporation (HOLC). Our analysis exploits an exogenous population cutoff: only cities above 40,000 residents were mapped. We employ a difference-in-differences design, comparing areas that received a particular grade with neighborhoods that would have received the same grade if their city had been mapped. The control neighborhoods are defined using a machine learning algorithm trained to draw HOLC-like maps using newly geocoded full-count census records. For the year 1940, we find a substantial reduction in property values and homeownership rates in areas with the lowest grade along with an increase in the share of African American residents. We also find sizable house value reductions in the second-to-lowest grade areas. Such negative effects on property values persisted until the early 1980s. Our results illustrate that institutional practices can coordinate individual discriminatory choices and amplify their consequences.’
Note: This research was funded in part by Equitable Growth.
Abstract. “We construct a novel data set to show that, between 2003-2020, up to one-fifth of America’s largest firms had a non-financial blockholder or insider as their largest shareholder. Blockholders and insiders tend to be less diversified than institutional investors. Measures of `”universal” and “common” ownership of firms are therefore lower than previously believed based on analyses of institutional investors’ holdings alone, and the heterogeneity in ownership structures across firms is greater. Consolidation in the asset management industry increases universal ownership and common ownership of industry rivals. Extant results claiming indexing alone explains the rise of universal ownership cannot be confirmed with the new, more comprehensive data.”
Note: This abstract is from an earlier version of theis paper.
Abstract. “We study the history and geography of wealth accumulation in the US, using newly collected historical property tax records since the early 1800s. The property tax in the US was a comprehensive tax on all kinds of properties (real estate, personal property, and financial wealth), making it one of the first “wealth taxes.” Our new data allows us to reconstruct wealth series at the city, county, and state levels over time and to study the effects of property taxes on property values, migration, and investment. We first document the long-term evolution of household wealth in the US since the early 1800s, offering new fine-grained and high-frequency estimates of household wealth over a long period of time. The US had significantly lower wealth than Europe and only caught up with Europe after WW1, despite GDP per capita having been larger than that of France or the UK since the late 1870s. Second, we study the spatial allocation of wealth in the US over the long run. The geography of wealth is highly persistent and factors related to geography and demographics correlate strongly with wealth at the city, county, and state levels. Finally, we study the role of the property tax (i.e., a “wealth tax”) on wealth accumulation, using the large variation in property tax rates across more than 300 municipalities. We find an implied elasticity of capital income with respect to the net-of-tax rate on income of about .70 after 10 years. This elasticity can be broken down into an (extensive) elasticity of migration of about .26 and an (intensive) elasticity of per capita income of about .44. The intensive margin elasticity appears to be driven in part by reporting and avoidance responses, but also by significant capitalization of property taxes in local real estate prices.”
“Learning About the Long Run” Leland Farmer, University of Virginia Emi Nakamura, University of California, Berkeley and NBER, Equitable Growth grantee Jón Steinsson, University of California, Berkeley and NBER, Equitable Growth grantee
Abstract. “Forecasts of professional forecasters are anomalous: they are biased, forecast errors are autocorrelated, and forecast revisions predict forecast errors. Sticky or noisy information models seem like unlikely explanations for these anomalies: professional forecasters pay attention constantly and have precise knowledge of the data in question. We propose that these anomalies arise because professional forecasters don’t know the model that generates the data. We show that Bayesian agents learning about hard-to-learn features of the data generating process (low frequency behavior) can generate all the prominent aggregate anomalies emphasized in the literature. We show this for two applications: professional forecasts of nominal interest rates for the sample period 1980-2019 and CBO forecasts of GDP growth for the sample period 1976-2019. Our learning model for interest rates also provides an explanation for deviations from the expectations hypothesis of the term structure that does not rely on time-variation in risk premia.”
Abstract. “Persistent income inequality between Black and white households has generated a vigorous debate on what policy instruments may be effective to reduce such disparities. One such instrument to be evaluated is monetary policy. In this paper, we study precisely how monetary policy affects the real income volatility of Black and white households, in a framework where the monetary authority faces a trade-off between unemployment and inflation. Our assessment is informed by four empirical regularities: (i) the unemployment rate for Black individuals is about twice as high than the unemployment rate for white individuals, at all times; (ii) though the levels differ, the unemployment rates for Black and white individuals move closely over the business cycle; (iii) labor income represents a larger portion of overall income for Black than for white households; (iv) Black households experience higher price volatility with respect to white households. We argue that (i) and (ii) imply that proposals postulating that monetary policy targets Black unemployment are equivalent to a policy accepting larger inflation fluctuations. At the same time, (iii) and (iv) imply that the real income volatility of Black households is more directly affected by inflation changes. In our quantitative evaluation, we find that Black households gain disproportionately more from accommodative monetary policy so long as inflation expectations remain anchored. With unanchored expectations, on the other hand, the benefit from reducing unemployment become smaller and the erosion of real income from higher inflation dominates.”
Abstract. “It has long been argued that a minimum wage could alleviate efficiency losses from monopsony power. In a general equilibrium framework that quantitatively replicates results from recent empirical studies, we find higher minimum wages can improve welfare, but most welfare gains stem from redistribution rather than efficiency. Our model features oligopsonistic labor markets with heterogeneous workers and firms and yields analytical expressions that characterize the mechanisms by which minimum wages can improve efficiency, and how these deteriorate at higher minimum wages. We provide a method to separate welfare gains into two channels: efficiency and redistribution. Under both channels and Utilitarian social welfare weights the optimal minimum wage is $15, but alternative weights can rationalize anything from $0 to $31. Under only the efficiency channel, the optimal minimum wage is narrowly around $8, robust to social welfare weights, and generates small welfare gains that recover only 2 percent of the efficiency losses from monopsony power.”
Note: This research was funded in part by Equitable Growth.
“New Pricing Models, Same Old Phillips Curves?” Adrien Auclert, Stanford University and NBER, Equitable Growth grantee Rodolfo D. Rigato, Harvard University Matthew Rognlie, Northwestern University and NBER Ludwig Straub, Harvard University and NBER
Abstract. “We show that, in a broad class of menu cost models, the dynamics of aggregate inflation in response to arbitrary shocks to aggregate costs are nearly the same as in Calvo models with suitably chosen Calvo adjustment frequencies. We first prove that the canonical menu cost model is first-order equivalent to a mixture of two timedependent models, which reflect the extensive and intensive margins of price adjustment. We then show numerically that, in any plausible parameterization, this mixture is well-approximated by a single Calvo model. This close numerical fit carries over to other standard specifications of menu cost models. Thus, the Phillips curve for a menu cost model looks like the New Keynesian Phillips curve, but with a higher slope.”

 post
post
 Vision 2020