JOLTS Day Graphs: January 2022 Edition

Every month the U.S. Bureau of Labor Statistics releases data on hiring, firing, and other labor market flows from the Job Openings and Labor Turnover Survey, better known as JOLTS. Today, the BLS released the latest data for January 2022. This report doesn’t get as much attention as the monthly Employment Situation Report, but it contains useful information about the state of the U.S. labor market. Below are a few key graphs using data from the report.

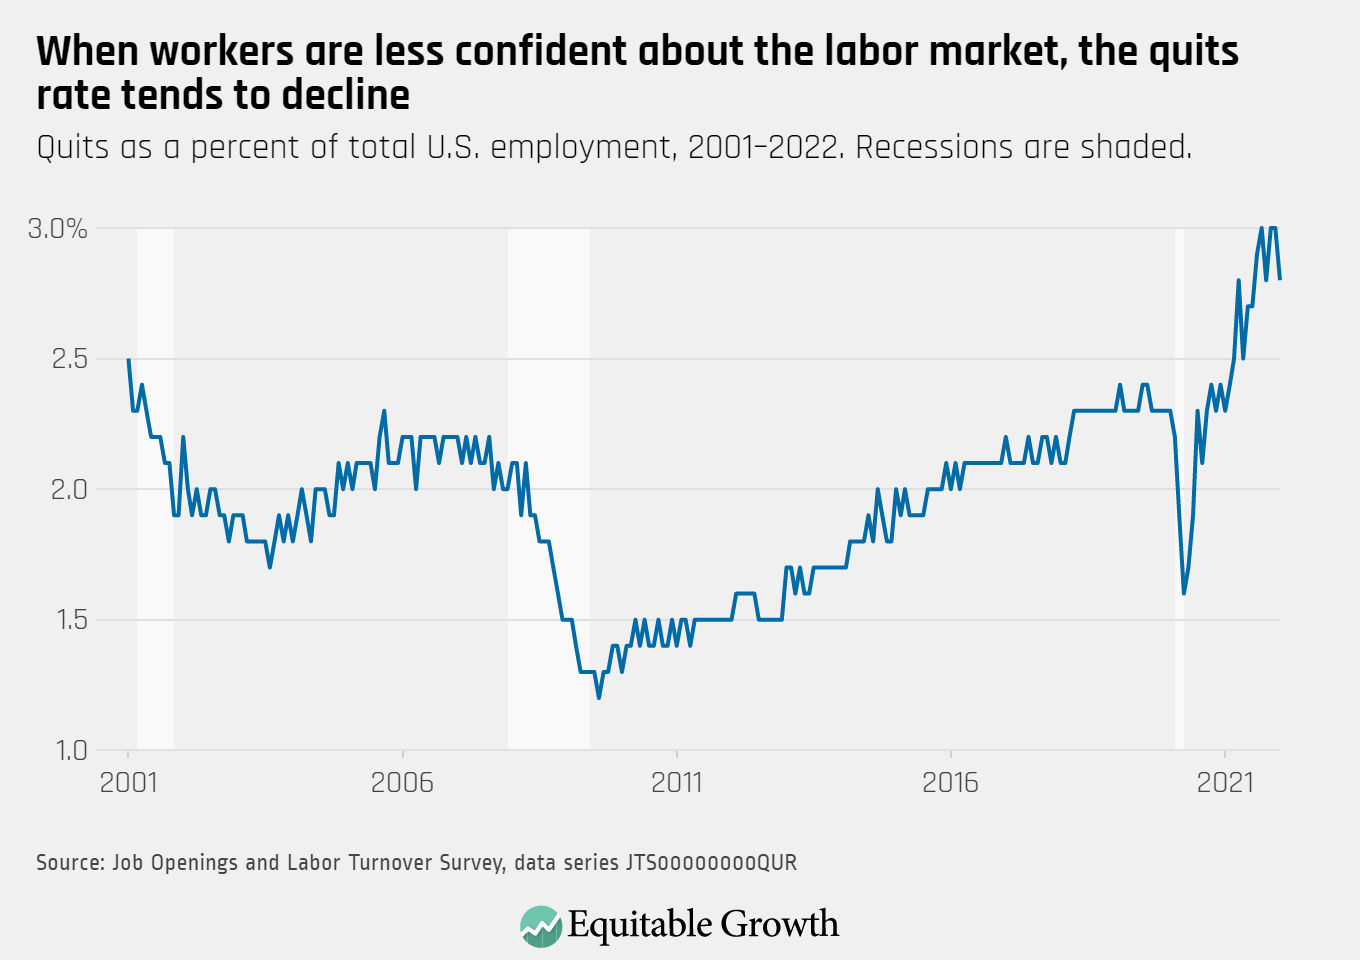
The quits rate fell to 2.8 percent as 4.3 million workers quit their jobs in January, down 151,000 from the previous month.

Quits as a percent of total U.S. employment, 2001-2022. Recessions are shaded.

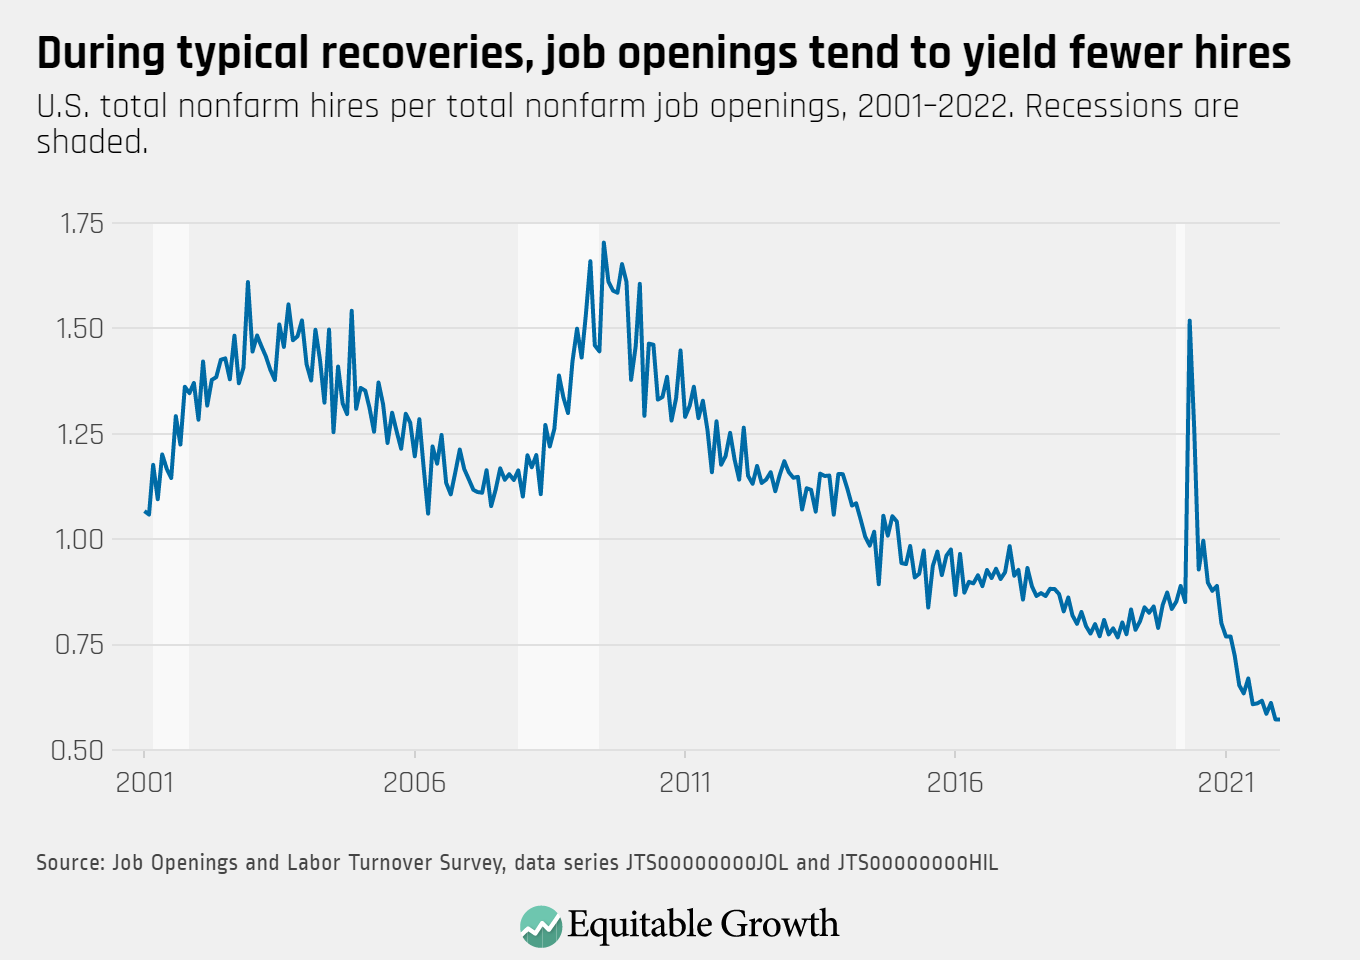
With job openings (11.3 million) and hires (6.5 million) remaining relatively steady, the vacancy yield stayed at 0.57 in January.

U.S. total nonfarm hires per total nonfarm job openings, 2001-2022. Recessions are shaded.

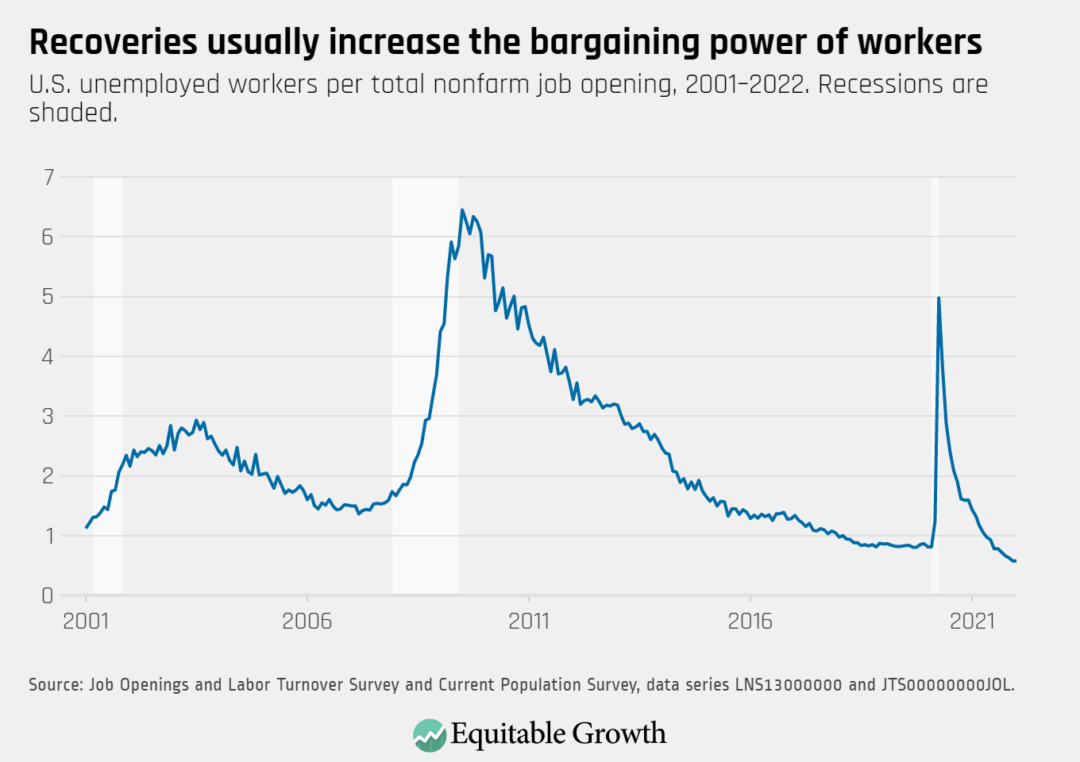
There were 0.57 unemployed workers for every job opening in January, a ratio that was little changed from the previous month.

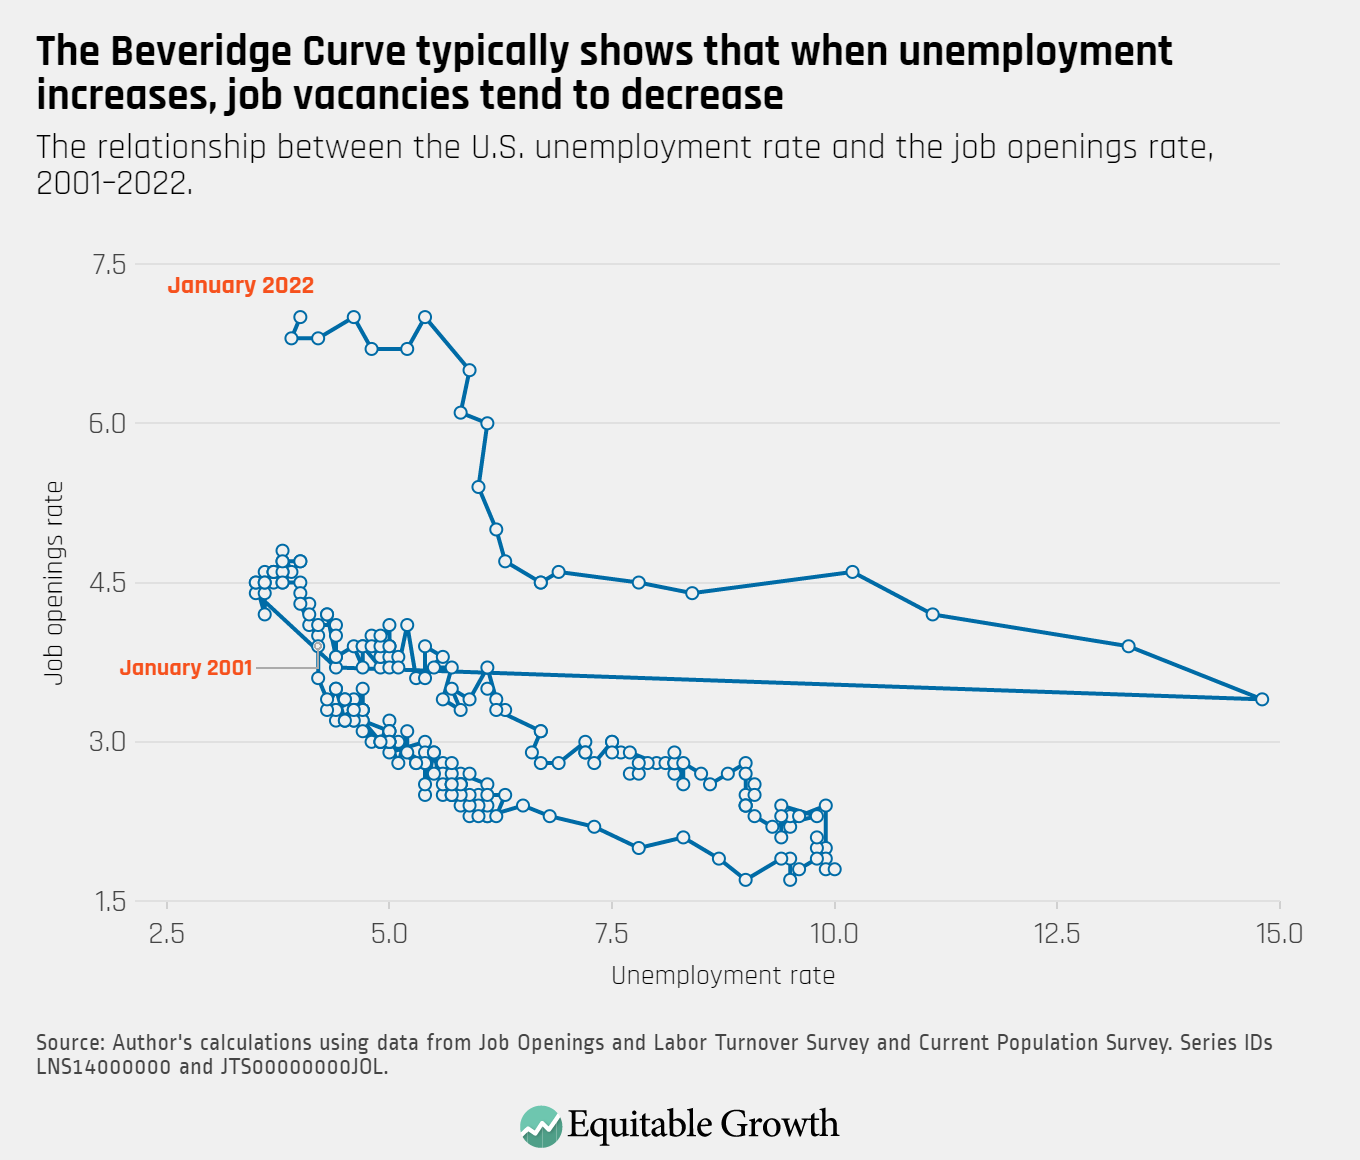
The Beveridge Curve remained in an elevated range in January, reflecting a high job openings rate of 7.0 percent.

The relationship between the U.S. unemployment rate and the job openings rate, 2001-2022.

Quits rose for some industries in January, including financial activities, education and health, and manufacturing. Meanwhile, quits declined in construction and in leisure & hospitality.

Quits by selected major U.S. industries, indexed to quits in February 2020.
Connect with us!

Explore the Equitable Growth network of experts around the country and get answers to today's most pressing questions!

Get in Touch