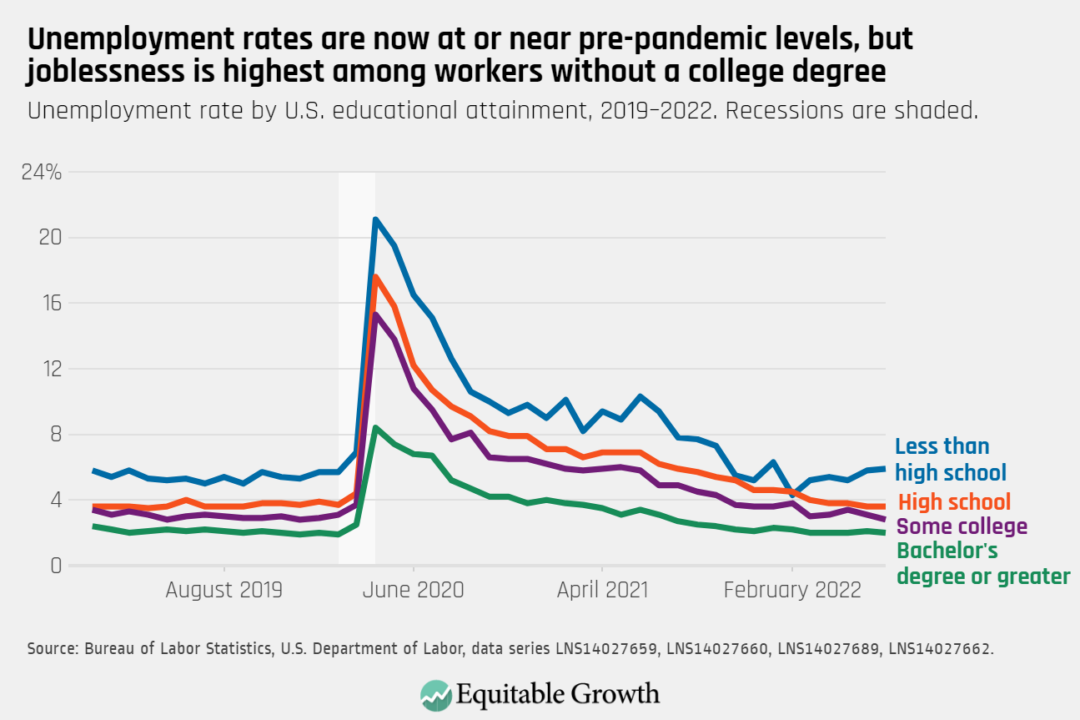
Over the past few months, the U.S. labor market continued its strong recovery from the initial shock delivered by the COVID-19 crisis, reaching pre-pandemic levels of nonfarm payrolls in July. When the U.S. Bureau of Labor Statistics released its latest Employment Situation Summary in early August, these labor market data show that the U.S. economy added an average of 437,000 jobs in the 3 months between April and July, up from an average of 384,000 jobs added between March and June.
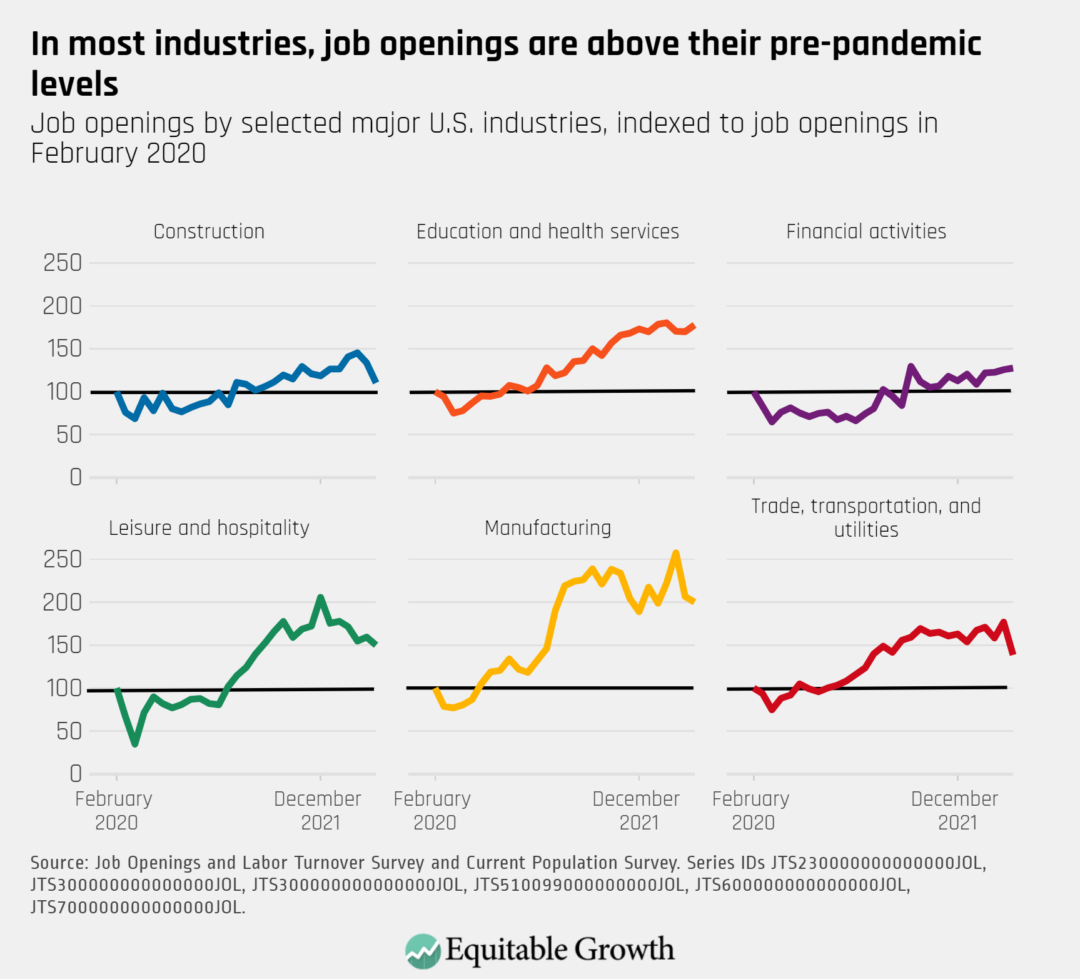
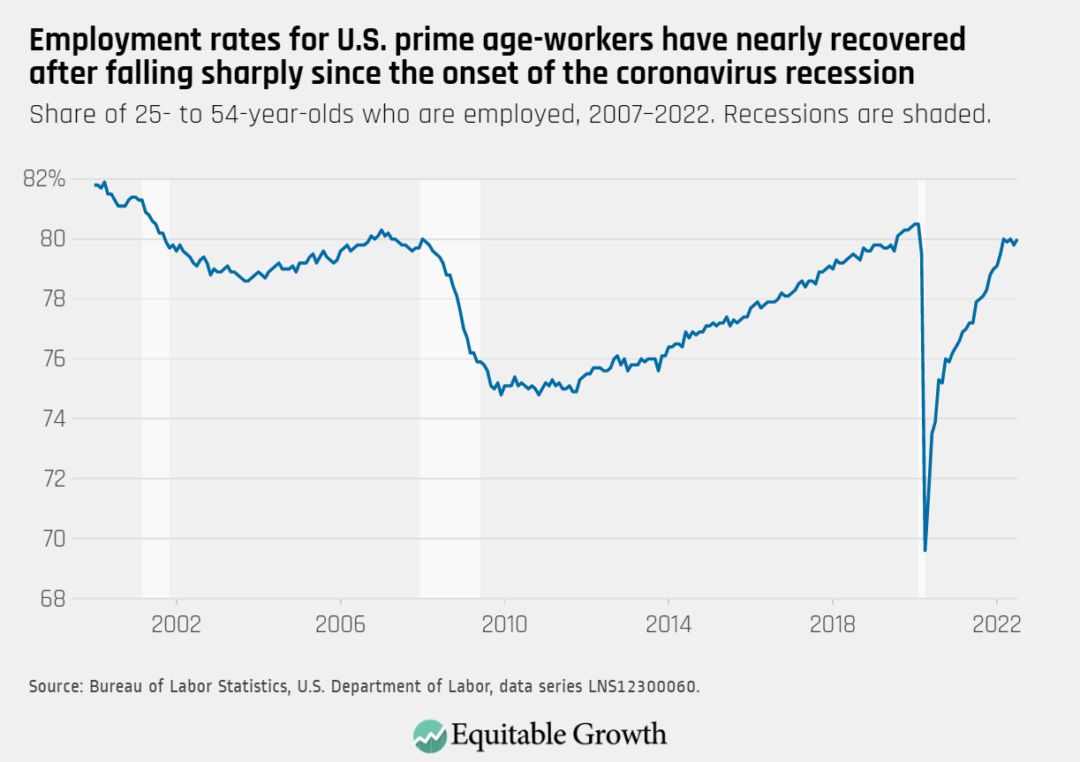
Overall, the pace of job growth has slowed down from earlier in the recovery, but it remains substantially faster than in the tight, pre-pandemic labor market of 2019. (See Figure 1.)
Figure 1
This Friday, September 2, the U.S. Bureau of Labor Statistics will release labor market data for the month of August. While the overall pace of employment growth will likely continue to slow down, most metrics reflect that this has already been an exceptionally quick recovery. Despite the size of the COVID-19 shock, nonfarm payrolls fully bounced back in just more than 2 years, whereas it took the U.S. economy more than 6 years to get back to pre-crisis employment levels after the Great Recession of 2007–2009.
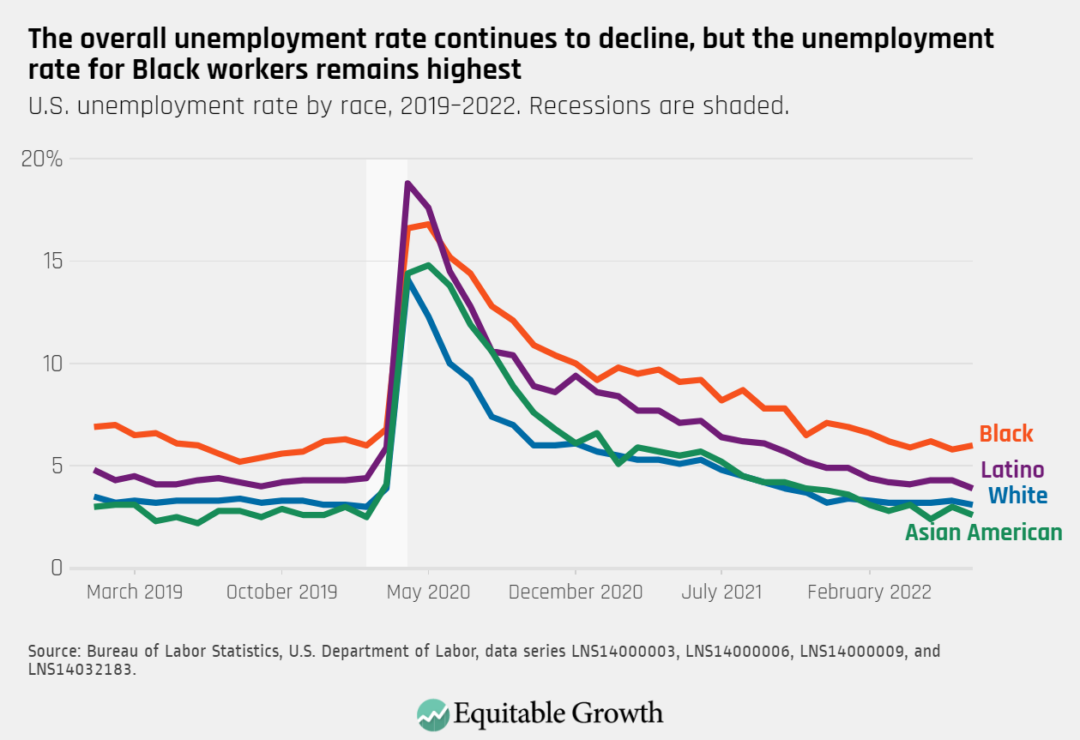
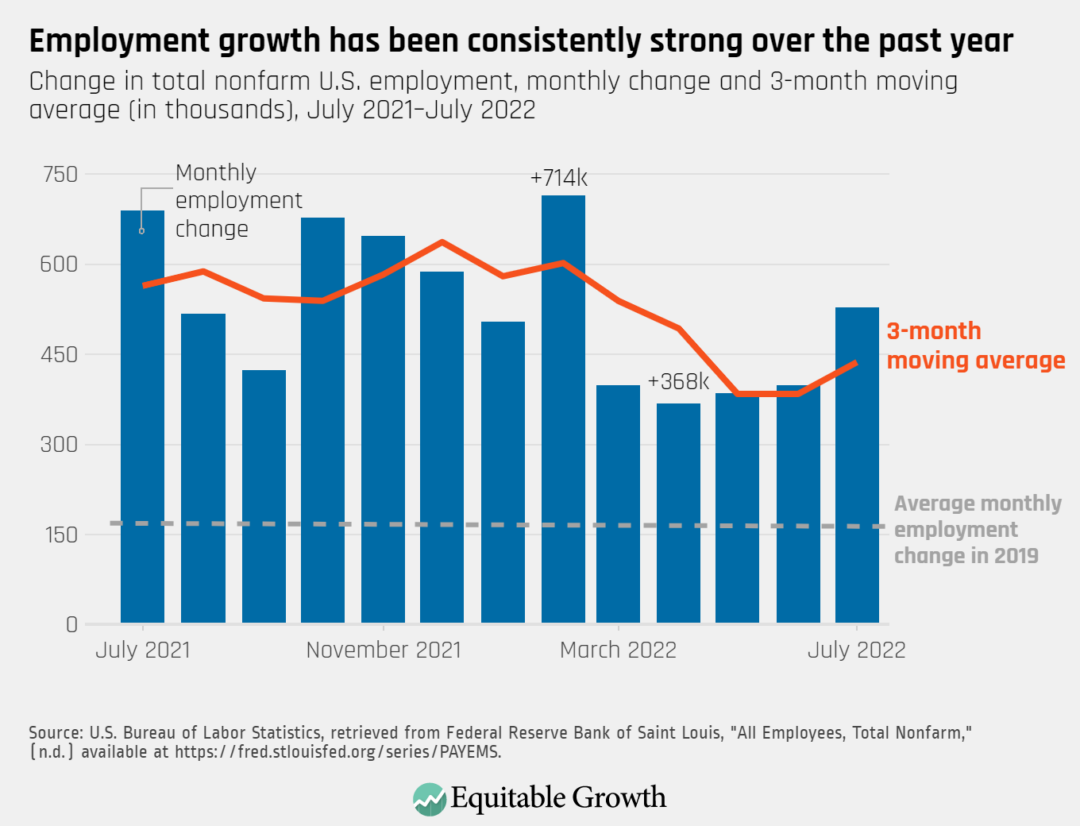
The national unemployment rate is also back to its pre-pandemic rate, though jobless rates are widely different between racial and ethnic groups. As an exceptionally persistent feature of the U.S. labor market, the unemployment rate of Black workers is about twice as high as the unemployment rate of White workers. (See Figure 2.)
Figure 2
Nonfarm payrolls have now fully recovered from the COVID-19 recession, but questions remain about the current state of the U.S. labor market
Statistical quirks and discrepancies between the two surveys that the U.S. Bureau of Labor Statistics uses to prepare the monthly jobs report—the household survey and the establishment survey—make it difficult to get a precise snapshot of just how hot the U.S. labor market is right now. According to the household survey, there were about 168,000 fewer people employed in July 2022 than in March 2022. According to the establishment survey, however, the U.S. economy added 1.6 million jobs in the same period.
The household survey, or the Current Population Survey, asks adults ages 16 and over questions about their labor force status. It uses a definition of employment that includes agricultural workers, self-employed workers, workers in private households, and workers on unpaid leave from their jobs. This survey is used to report statistics, such as the unemployment rate, the labor force participation rate, and the employment-to-population ratio, and also reports demographic information, including gender, race, ethnicity, age, marital status, and level of formal education.
The establishment survey, or the Current Employment Statistics, asks U.S. firms about the employees on their payrolls. Unlike the household survey, the establishment survey does not count the unincorporated self-employed, private household workers, or agricultural workers. It does, however, count payroll employees who might be younger than 16 years old. And because its definition of employment includes workers who received pay in the pay period the survey was conducted, workers with more than one job can be double counted. The Bureau of Labor Statistics uses the establishment survey to report both aggregate and industry-level job growth, as well as average earnings, hours of work, and overtime hours.
While the two surveys track each other fairly well in the long run, occasionally they diverge. During the 2001 recession and its immediate aftermath, for example, the household survey reported fewer job losses and a much faster recovery than the establishment survey, in part because the establishment survey was missing job gains among the self-employed.
Indeed, Katherine Abraham and John Haltiwanger at the University of Maryland and Kristin Sandusky and James Spletzer at the U.S. Census Bureau show that misclassification, reporting errors, and fluctuations in the business cycle have different effects on the two surveys. For example, the team of economists finds that when the U.S. economy is in an expansion, employment in the establishment survey tends to increase relative to employment in the household survey. They propose that a possible driver of this trend is that as the economy picks up, employers might be more likely to hire additional workers for short-term payroll jobs—positions that are less likely to be reported by household survey respondents. In economic downturns, however, transitions to self-employment become more likely as an alternative to unemployment in the absence of wage work, which could help explain why employment in the household survey tends to drop less during, and recover faster in the immediate aftermath, of recessions.
Though it is too early to tell, the current divergence in the establishment and household surveys could be explained by a number of factors. One is that the U.S. economy is expanding, and the establishment survey and the household survey are following the cyclical pattern proposed by Abraham, Haltiwanger, Sandusky, and Spletzer. Another is volatility in the number of COVID-related unpaid absences. Yet another possible explanation is a pick-up in immigration, as proposed by economic analyst Joseph Politano.
The data are also subject to change. In January 2023, the Bureau of Labor Statistics will release the final revisions to the establishment survey data published in 2022—revisions that are based on population counts from administrative records and that will likely shrink the discrepancies between the two surveys. In the meantime, it will be important to follow both surveys closely. In this analysis, we use both the establishment survey and the household survey, and include 3-month moving averages to smooth out volatility in the monthly labor market data.
In the household survey, important labor force measures have yet to recover to their pre-pandemic levels
Even as important topline statistics, such as nonfarm payrolls and the unemployment rate, are now back to where they were in February 2020, a few important metrics have yet to recover. Take the labor force participation rate, which captures the percent of adults ages 16 and over who are employed or actively looking for a job. This statistic reflects important information about the labor market, since it speaks not only about the share of the U.S. population that is employed but also about the number of workers wanting and available to take a job.
The labor force participation rate, BLS data show, saw an important decline as the coronavirus hit U.S. shores in early 2020 and has made little progress over the past 2 years. Indeed, since the summer of 2020, it has zig-zagged between 61.4 percent and 62.4 percent—or at least a full percentage point below its February 2020 rate.
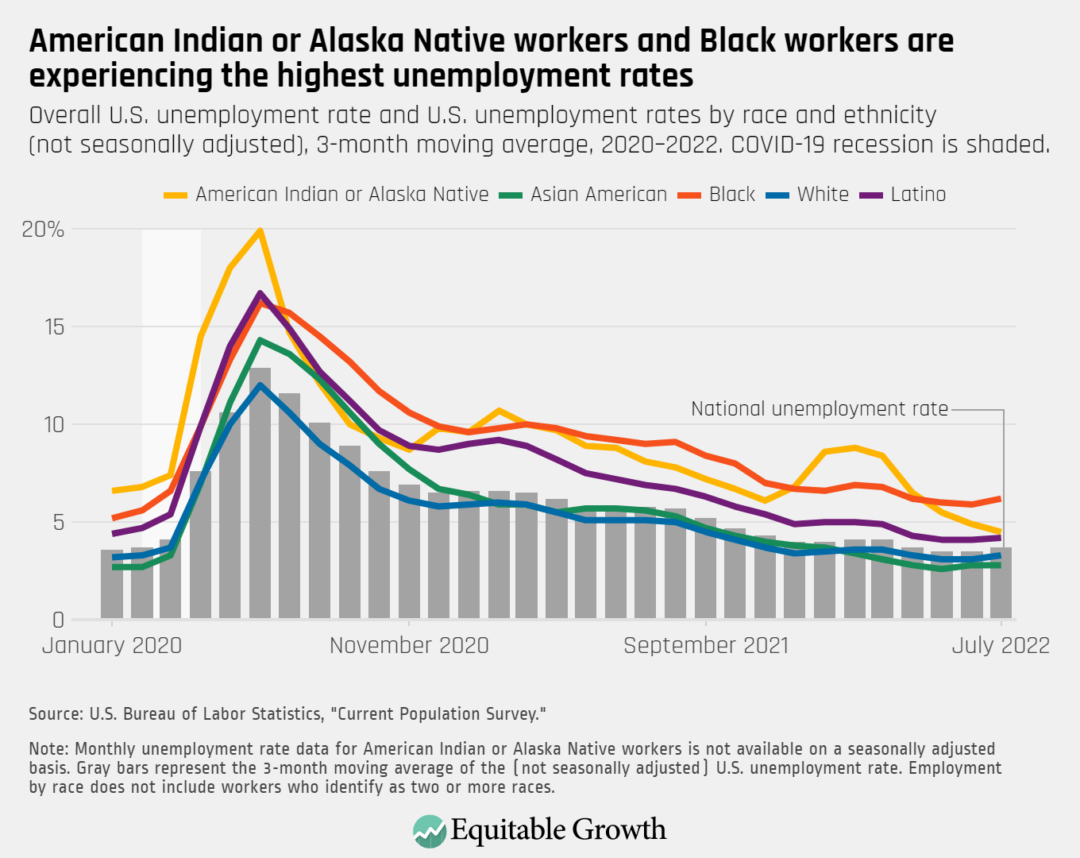
An analysis by The Brookings Institution finds that the decline in the labor force participation rate is greatest among those between the ages of 55 and 65, and is likely a feature of pandemic-driven shift in retirements, continued risk of infection, and disability stemming from COVID-19. But the labor force participation rate also has declined among those between the ages of 25 and 54—a group economists call the “prime-age” population. Indeed, caregiving responsibilities and health issues seem to be factors keeping younger workers’ participation in the labor force down. (See Figure 3.)
Figure 3
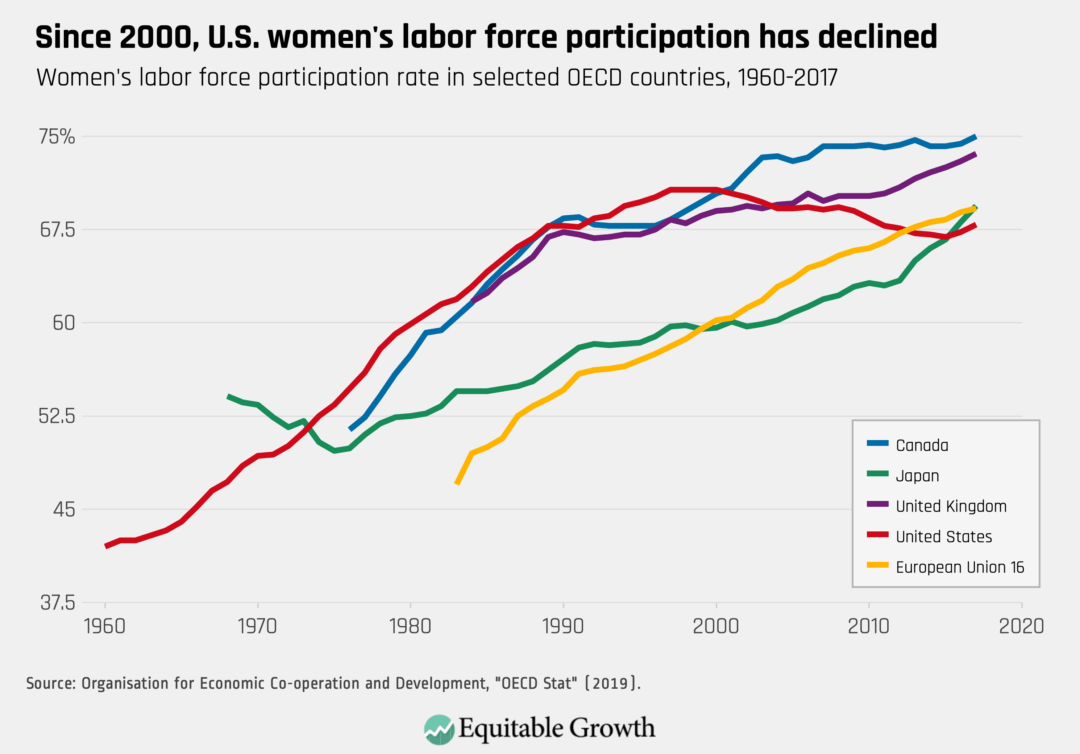
A less-than-full rebound in the labor force participation rate could also be related to longer-term trends, as neither the labor force participation rate nor the employment-to-population ratio have returned to their early 2000s highs. Researchers found, for example, that extended schooling, the aging of the U.S. population, and a decline in the participation of workers without a college degree are all holding back the country’s labor force participation rate. In addition, when analyzing labor policies across the developed-economy members of the Organisation for Economic Co-operation and Development, a team of economists found that little access to policies such as parental leave is leading to a decline in women’s labor force participation relative to peer countries.
Disparities in employment outcomes by race, gender, and ethnicity tell a complicated story about which groups are benefiting most from this recovery
At the onset of the COVID-19 recession, workers of color in general, and women of color in particular, experienced the deepest declines in employment. Latina workers, who are overrepresented in low-wage and service occupations and industries, such as leisure and hospitality, experienced a greater decline in employment than any other group. Black women’s high attachment to the labor force and overrepresentation in hard-hit service and in-person occupations also made this group of workers especially vulnerable to job losses.
In addition, there is evidence that even when accounting for occupational distribution and a number of demographic characteristics, Black and Latina women were more likely to lose their jobs at the onset of the pandemic. Over the past few months, however, employment growth among men and women of color outpaced the employment growth of their White counterparts. Though women continue to see slower job growth than men, more Black men workers and Latino workers are employed now than in February 2020. (See Figure 4.)
Figure 4
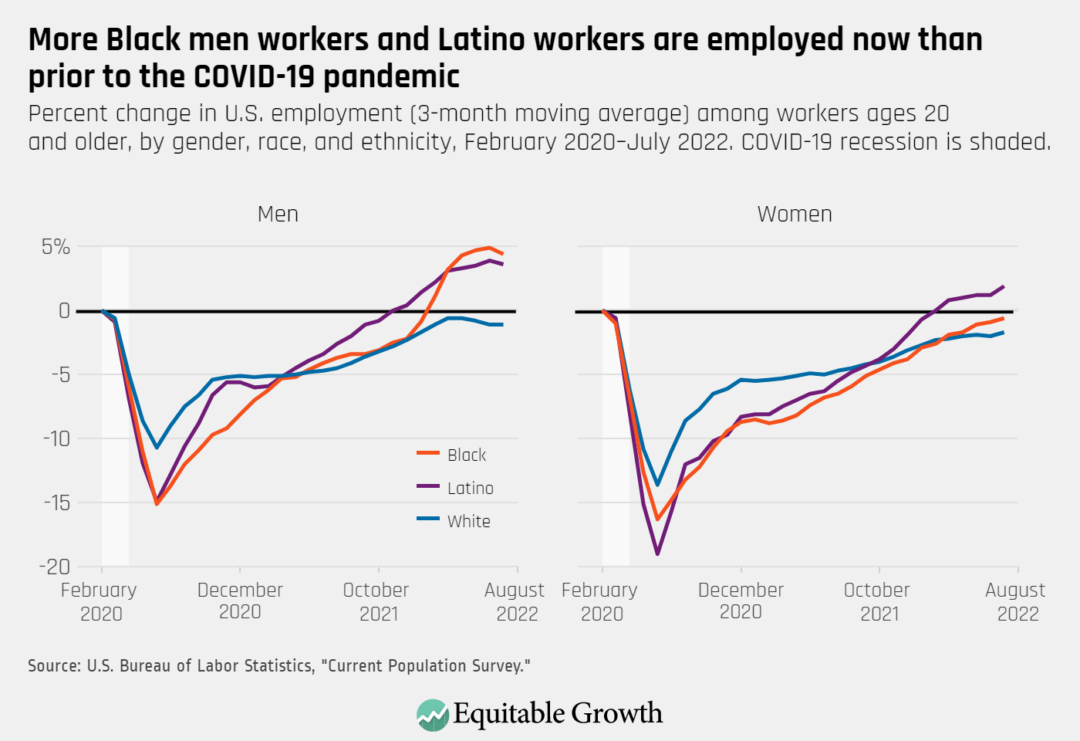
Indeed, these past 4 months of labor market data suggest that workers of color, most notably Black men workers, might be starting to experience important gains amid the strong recovery—a trend that is consistent with research finding that economic expansions and tight labor markets can narrow racial divides in a number of employment outcomes.
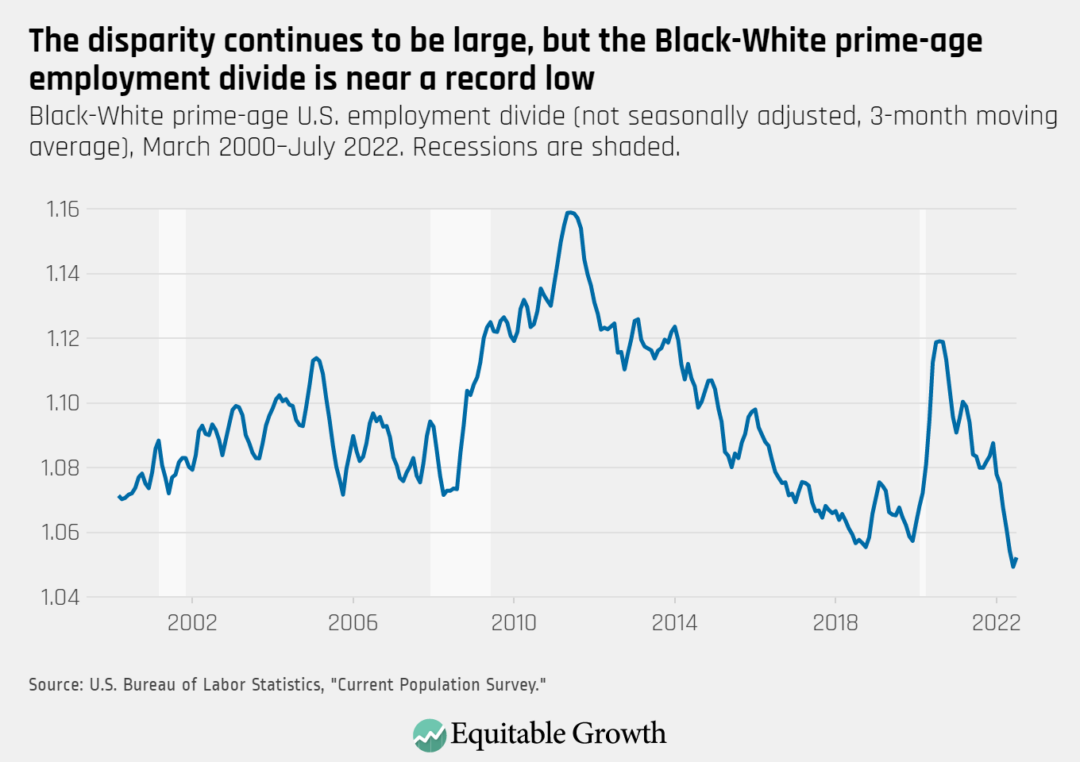
Market forces are, by themselves, insufficient for fully closing racial disparities in the U.S. economy. And longstanding structural and institutional factors, such as discrimination in employment and mass incarceration, need to be addressed to fully close racial divides. But the high-pressure U.S. labor market seems to be delivering real wage increases for the lowest-paid workers, after accounting for inflation, and narrowing employment divides. The divide between Black workers’ and White workers’ prime-age employment-to-population ratio, for instance, is currently near a record low. (See Figure 5.)
Figure 5
Labor market data show job growth is strong in many industries, but some parts of the U.S. economy are lagging behind
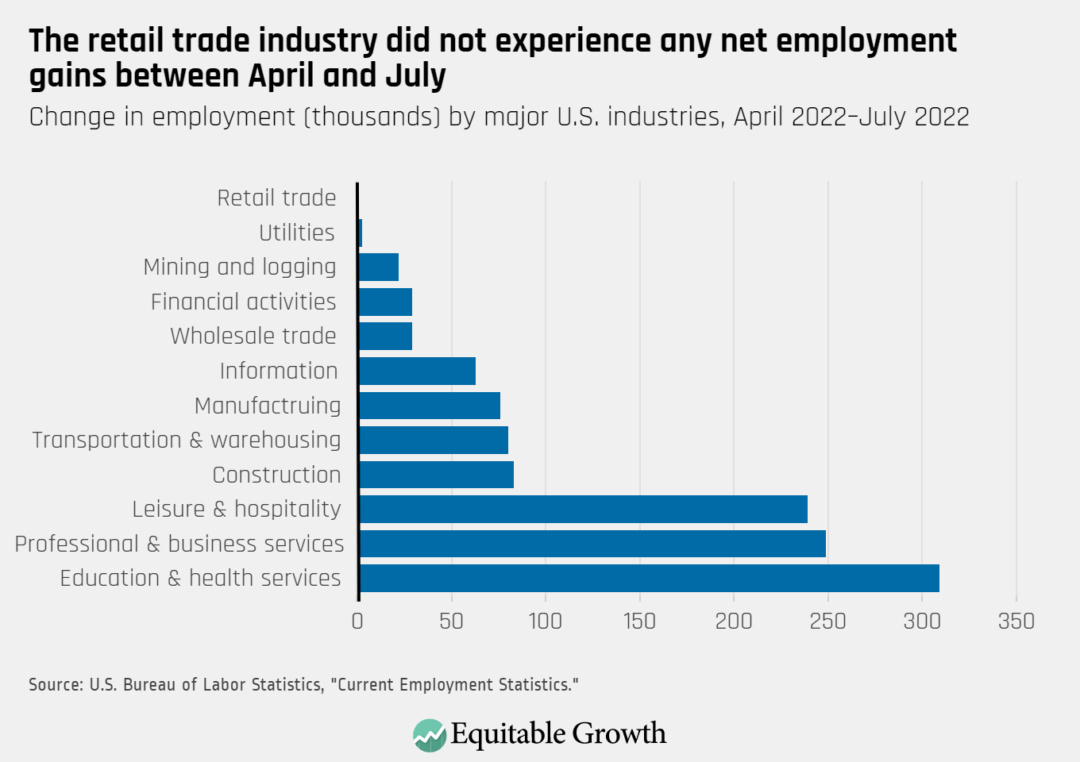
Between April and July of this year, three of the largest industries in the U.S. economy led the way in terms of sheer employment gains. Over those 3 months, the educational and health services industry added 309,000 jobs, the professional and business services industry added 249,000 jobs, and the leisure and hospitality industry added 239,000 jobs. Yet the other giant of the U.S. economy—retail trade—saw no increase in employment between April and July, as excess merchandise and lower-than-expected demand put the brakes on the industry’s job growth. (See Figure 6.)
Figure 6
Throughout the economic recovery and relative to the U.S. economy’s pre-pandemic size, the transportation and warehousing industry has grown more than any other major U.S. sector. Since February 2020—the last month prior to the onset of the COVID-19 recession, according to the National Bureau of Economic Research—transportation and warehousing added 745,000 additional jobs and grew almost 13 percent.
This expansion is, in large part, an outcome of the boom in e-commerce sparked by the pandemic. The professional and business services industry, as well as the information industry, are now also well above their pre-pandemic employment levels. (See Figure 7.)
Figure 7
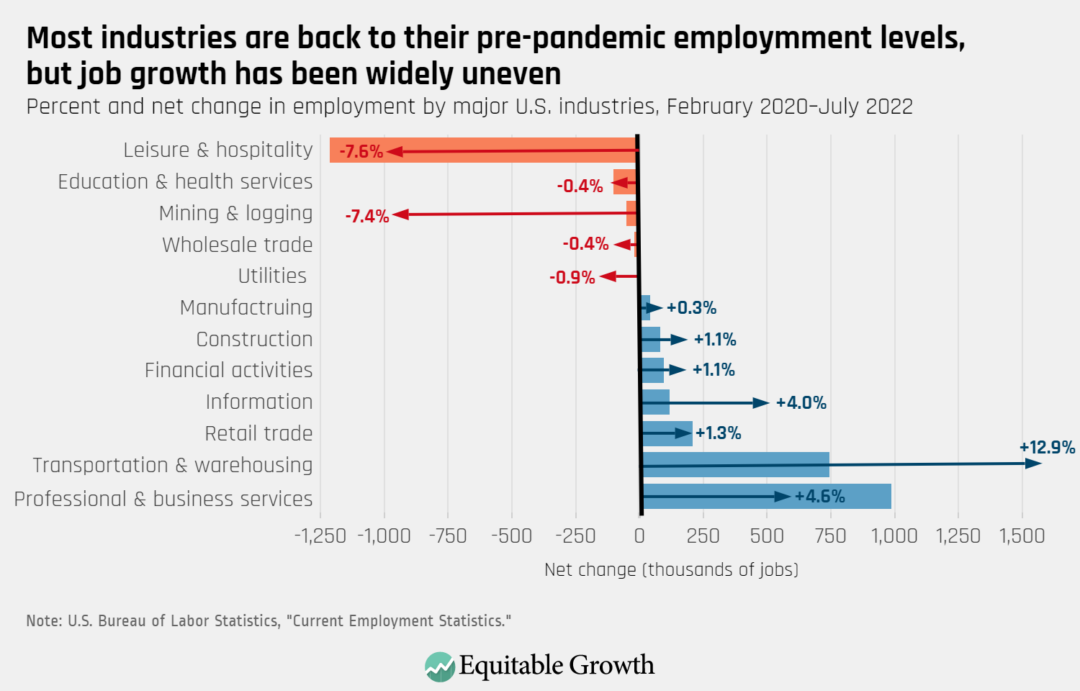
But some sectors of the U.S. economy are experiencing slower recoveries. Employment in the mining and logging industry, which encompasses sectors such as oil and gas extraction and coal mining, is still more than 7 percent below its February 2020 level. While the utilities sector is not far from its pre-pandemic employment, it has seen almost no net job gains over the past year.
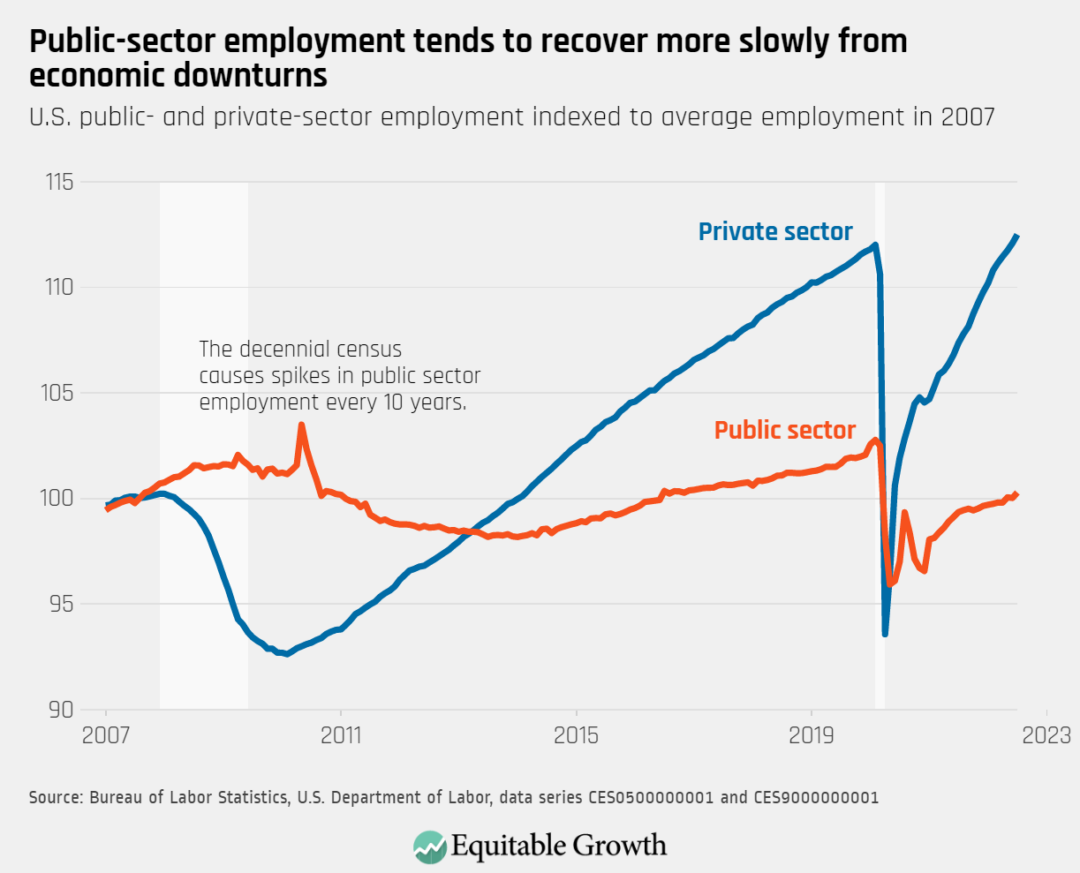
Public-sector employment also is recovering substantially more slowly than private-sector employment. For instance, though it made some important gains between April and July, there are almost 300,000 jobs missing from local government education—a part of the U.S. economy where stress, low satisfaction, and a record-high pay penalty are putting the brakes on a full bounce back.
Timely policy action on job quality and social infrastructure are necessary for the U.S. economic recovery to be sustainable and broadly shared
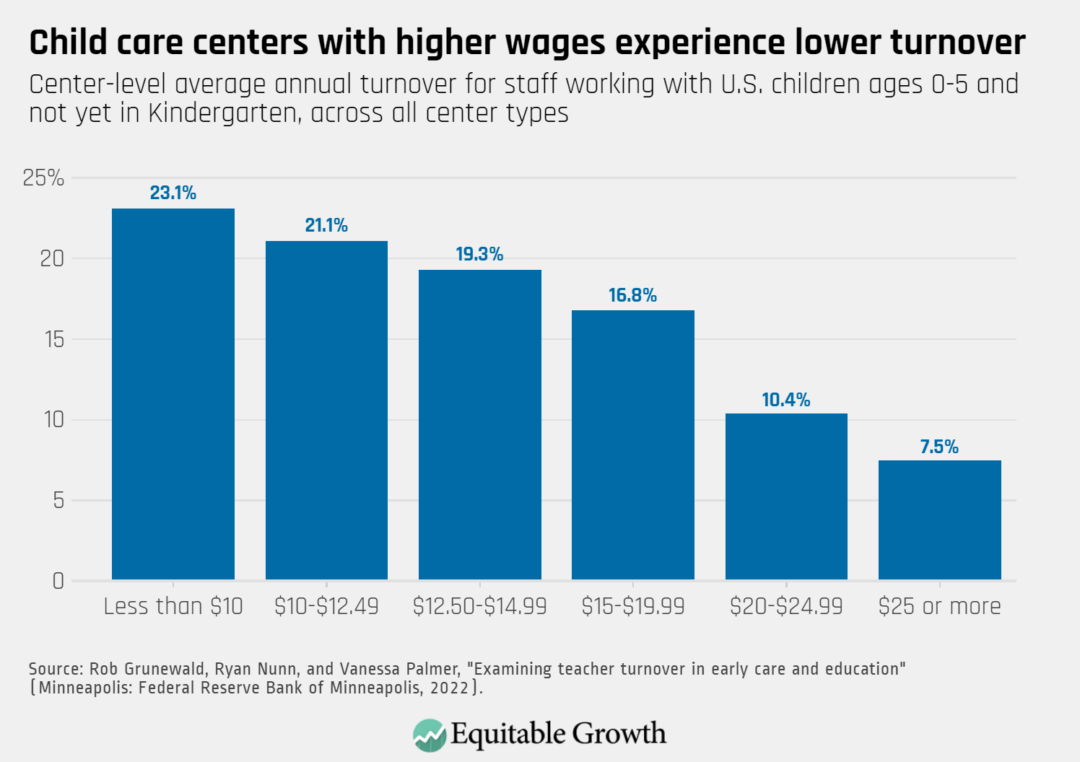
Even when accounting for the recent discrepancies between the household and establishment surveys produced by the U.S. Bureau of Labor Statistics, the jobs recovery in the United States from the COVID-19 recession has been exceptionally fast. For the labor market to deliver gains that will not evaporate when the next business cycle turns, however, policymakers and government agencies need to ensure that the positions being created now consist of well-paid, high-quality jobs. For instance, the large number of jobs added in the transportation and warehousing sector will fail to provide economic security for workers if persistent job-quality issues and the prevalence of employee misclassification in the industry is not addressed.
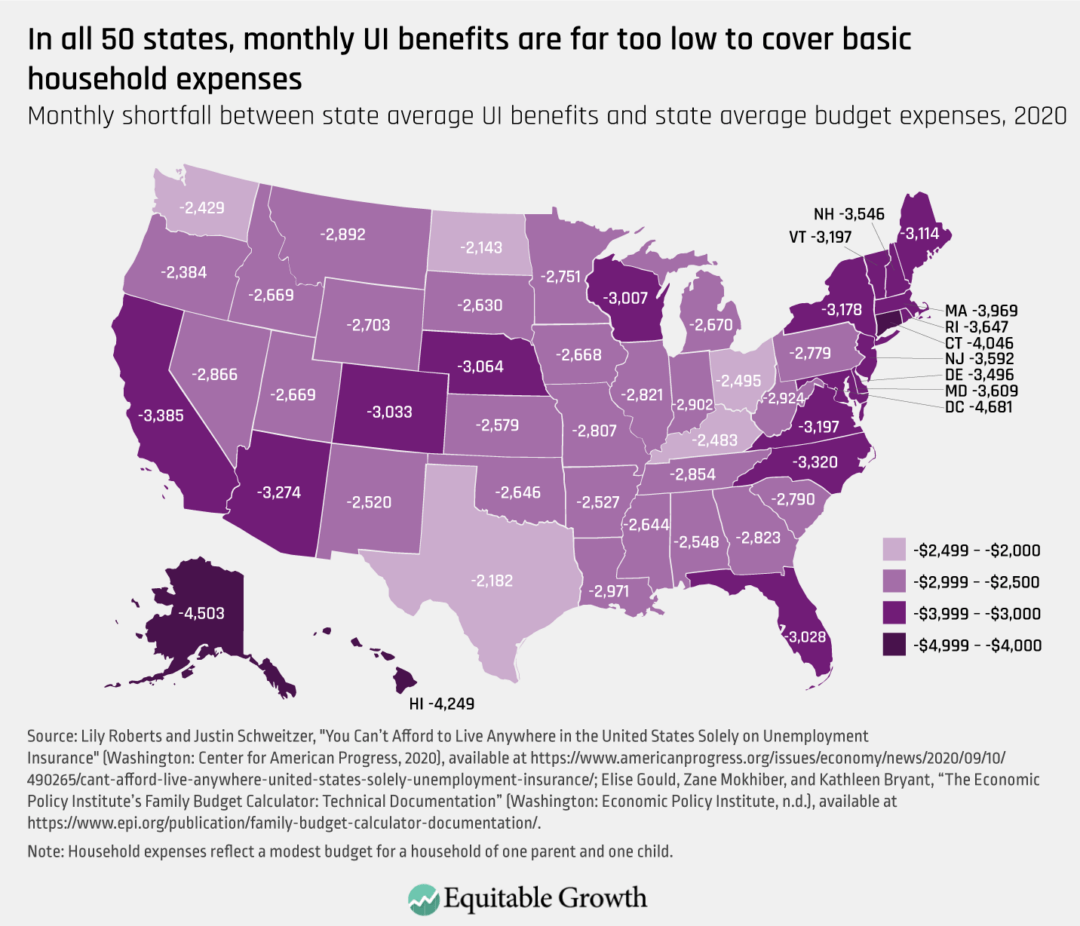
Key labor and social infrastructure policies also need to be improved. Boosting workers’ ability to join and form a union, ensuring access to paid sick leave, establishing a higher federal minimum wage floor, enforcing workplace anti-discrimination laws, and strengthening income support programs are all are crucial tools to improve economic stability for U.S. workers. These policies will not only reduce volatility for workers and their families, but also contribute to reducing the high cost of worker turnover and staffing challenges for businesses.
As new labor market data are published over the next several months, a clearer picture will emerge of the state of the U.S. labor market and the U.S. economy in 2022. Whichever direction they are headed, it will be important for policymakers to make sure workers can effectively bargain for sustained improvements in pay and working conditions, and that economic security supports are in place well before they are needed.