Equitable Growth’s Jobs Day Graphs: June 2022 Report Edition
On July 8, the U.S. Bureau of Labor Statistics released new data on the U.S. labor market during the month of June. Below are five graphs compiled by Equitable Growth staff highlighting important trends in the data.
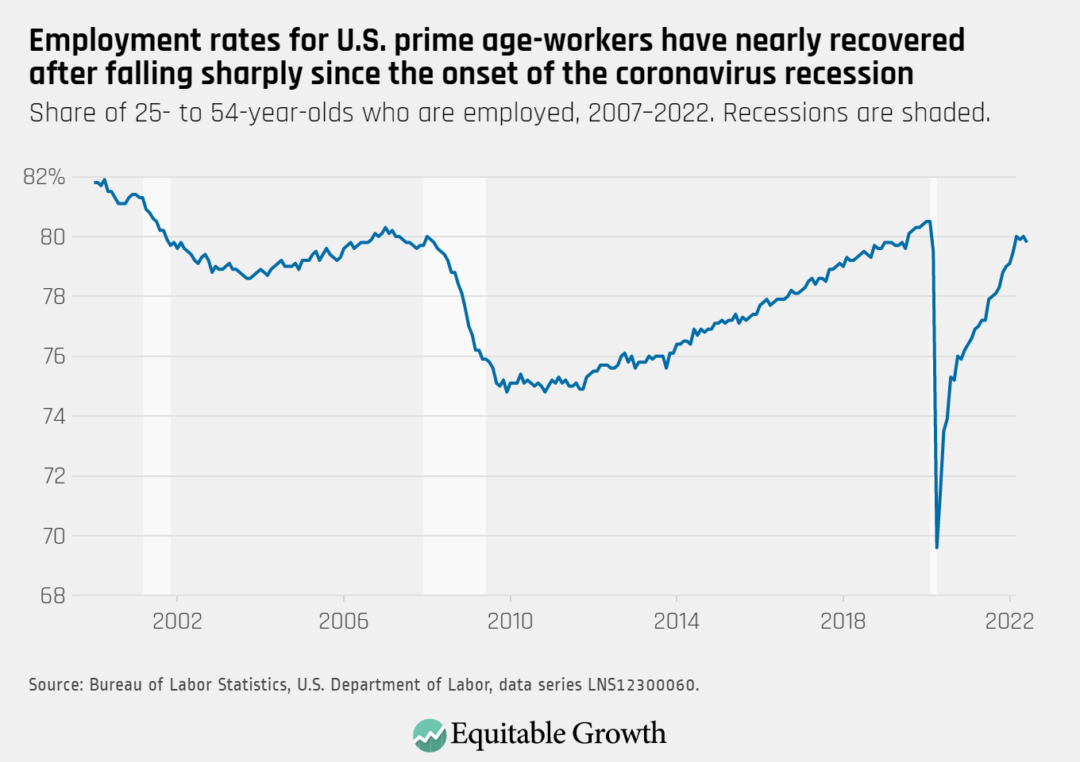
Total nonfarm employment rose by 372,000 in June, and the employment rate for prime-age workers decreased slightly to 79.8 percent.
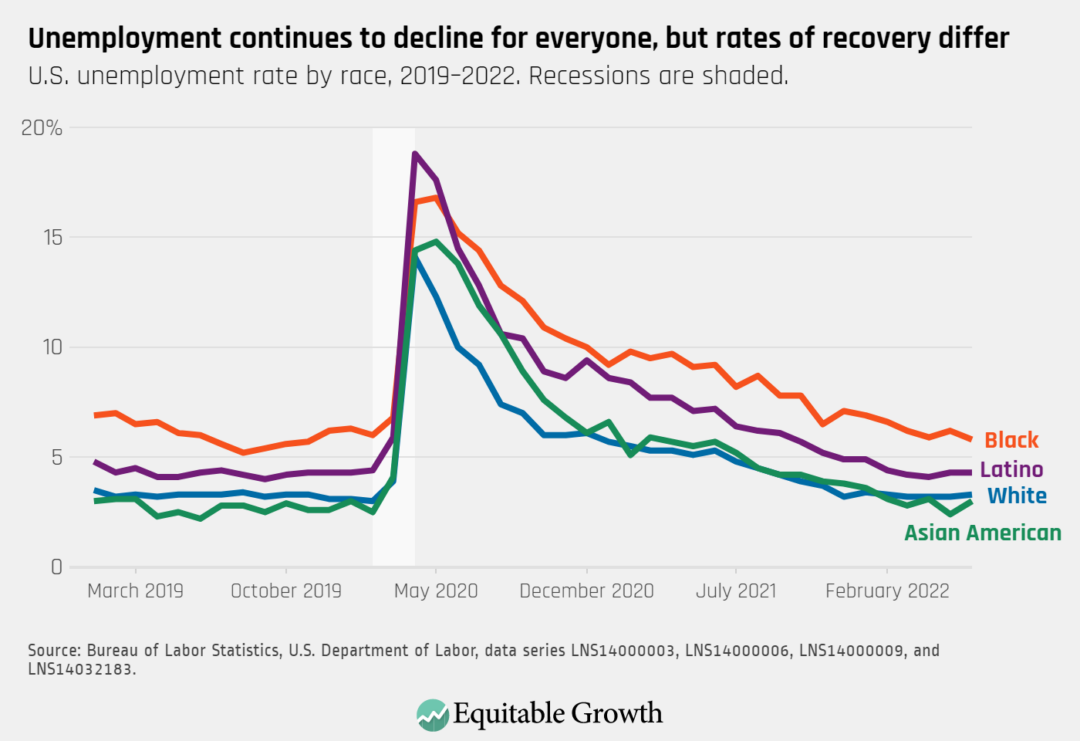
The unemployment rate stayed at 3.6 percent again in June, and remains higher for Black workers (5.8 percent) and Latino workers (4.3 percent) compared to White workers (3.3 percent) and Asian American workers (3.0 percent).
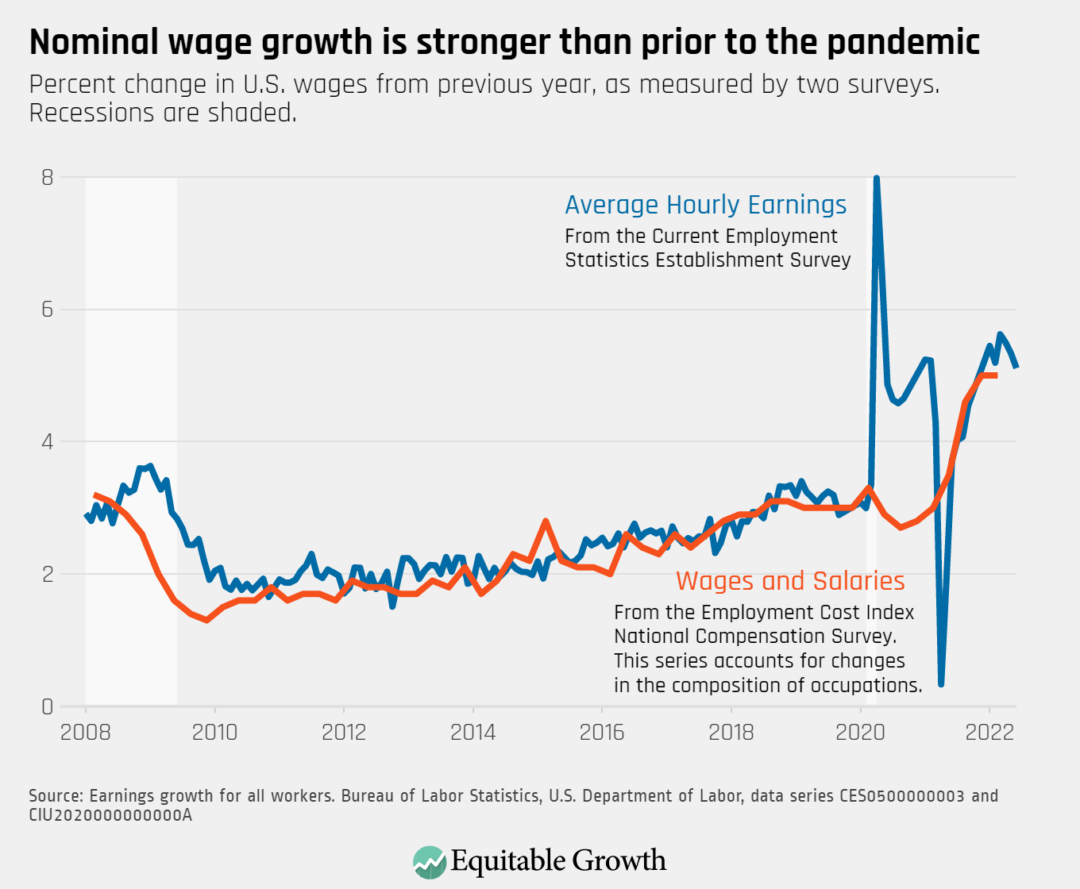
The rate of growth for average hourly earnings slowed in June to 5.1 percent over the previous year, down from 5.3 percent in May.
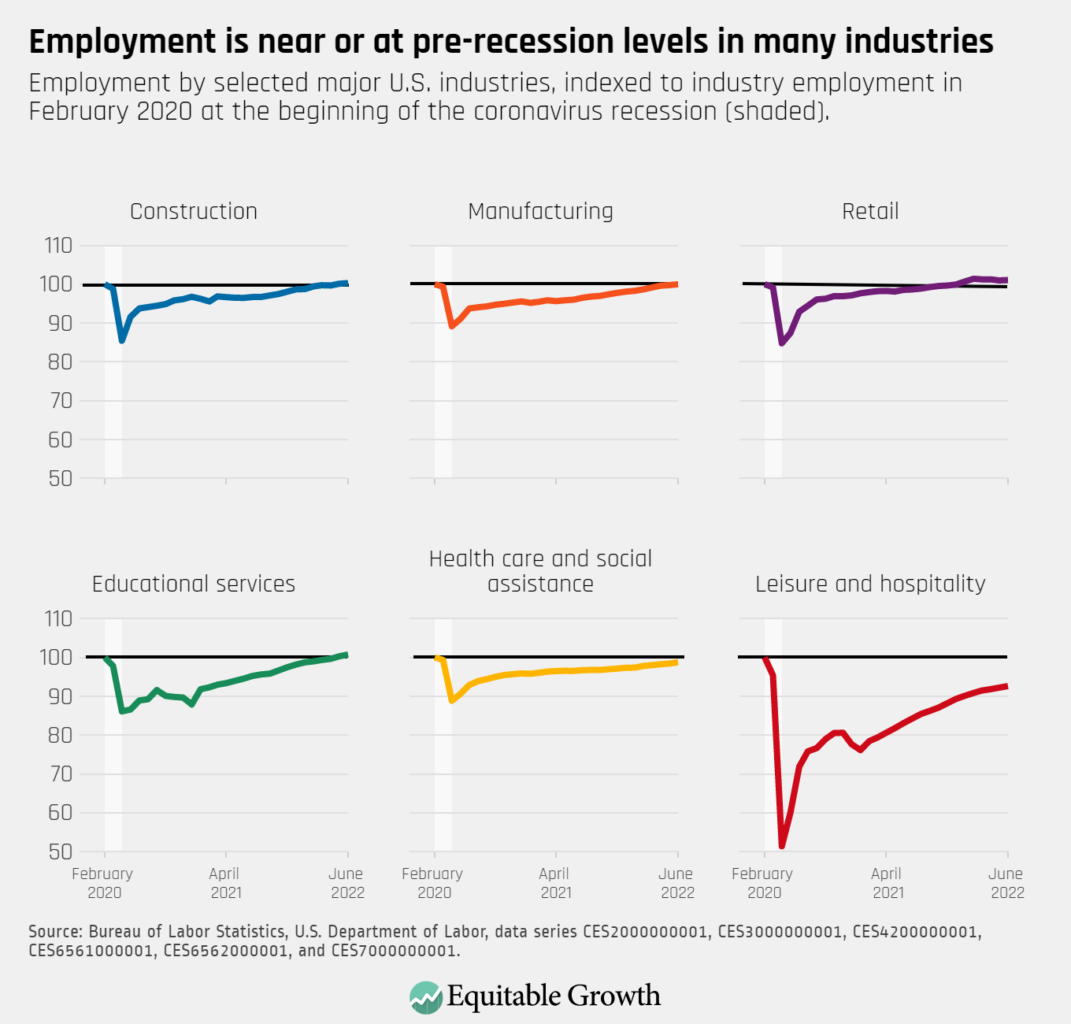
Employment in construction, manufacturing, retail, and educational services is now back to or surpassing pre-pandemic levels, but employment in leisure and hospitality has yet to fully recover.
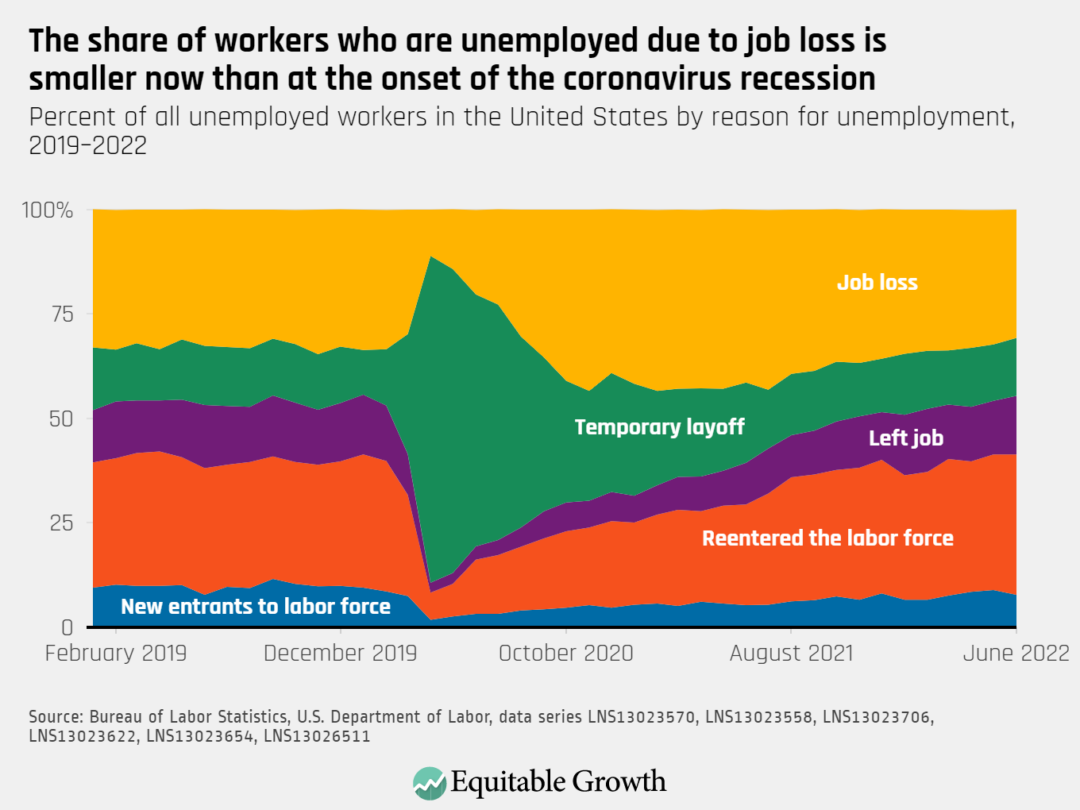
The number of unemployed workers remained steady in June. The share who are unemployed due to job loss fell to 30.7 percent, and 13.9 percent are on temporary layoff; 14.0 percent left their jobs, 33.6 percent are re-entering the labor force, and 7.8 percent are new entrants.