More frequent disaggregated data on U.S. income inequality would improve economic research and inform policymaking

Overview
Once a year, since March 2020, the U.S. Department of Commerce’s Bureau of Economic Analysis releases its data series on the distribution of growth in personal income with updated annual data from 2 years prior, providing valuable intelligence on who is benefiting from economic growth in the United States. In December 2021, the bureau released the disaggregated data on economic growth for 2019 and extended these data back to 2000.
The data are full of insights into the past 20 years of economic growth. They show, for example, that the economic policy response to the Great Recession of 2007–2009 was insufficient and left a huge number of Americans behind, and that inequality has continued to increase over the past two decades. Yet until the introduction of this new data series almost 2 years ago, federal statistical agencies essentially did not produce any comprehensive income inequality data, even though rising inequality has been a defining feature of the U.S. economy for the past 40 years.
The U.S. Census Bureau does provide data on money income, and some other releases, such as the tables released alongside the Consumer Expenditure Survey, have some distributional data, but neither provides a comprehensive look at income. Research shows that the release of economic growth statistics powerfully shapes the U.S. economic narrative. But economic growth is not a neutral concept. Devoting considerable resources to the production of national growth statistics while ignoring how that growth is distributed reflects an implicit belief that the division of growth is not particularly important.
While this may have been a defensible position in the 1950s and 1960s, when growth was broad based and most households saw increases in income that were commensurate with Gross Domestic Product growth, over the past four decades, growth has increasingly skewed toward the rich. That means that when headline growth is, say, 3 percent, it is actually usually much higher for those in the top 10 percent of households by income and lower for everyone else. This misleads U.S. households about the state of the economy, tilts economic narratives in favor of high-income households, and makes it impossible for policymakers to mount a policy response to rising inequality.
The Bureau of Economic Analysis’ distributional income data series represents a critical step in modernizing federal data for the 21st century economy, but it needs considerable development before it can be a true corrective to headline growth. A critical component is missing: speed.
Currently, the data on inequality in growth is released just once annually and on a 2-year lag. Yet for this data series to have a real impact on the economic debate, and to provide actionable intelligence for analysts and policymakers, it must come out quarterly, and it must come out on a short lag—preferably with the same latency as GDP growth, which is released on a one-month lag.
In December 2021, along with the 2019 inequality data, the Bureau of Economic Analysis also released a report on the feasibility of releasing a quarterly distribution of the data. The report also studies the feasibility of releasing more current data in a forecasting exercise that tries to predict current years and quarters of data using available data, some of which is only available on a 2-year lag. Frequency and latency of data series production are closely related, and both should be long-term goals for this data series. Unfortunately, the BEA report is largely negative on the feasibility of both these issues.
Economists at the Bureau of Economic Analysis are correct to point out the significant challenges that come with trying to create a higher-frequency and lower-latency data product, given the currently available data sources. But this report must not close off future research into such methods. Rather, this should be the start of a conversation about the resources the bureau needs to create a robust data series that will inform policymakers and the public in something close to real time.
This issue brief proceeds in three parts. First, it discusses why the federal statistical agencies must target more rapid measurement of inequality. Then, it tackles the perennial debate around rapidly released data—specifically, what is the appropriate balance between speed and accuracy? Third, it discusses some of the specific arguments the Bureau of Economic Analysis makes against the feasibility of quarterly reporting.
The brief closes with proposals for how Congress, the Biden administration, and the Bureau of Economic Analysis can work together to properly resource this work and add this important new tool to U.S. data infrastructure. Simply, it suggests that:
- The bureau should scope the work of improving this data series, identify both monetary and nonmonetary resources it needs, and request those resources from Congress. In scoping the work, it should solicit advice from academics and experts on how best to leverage existing data sources to construct high-quality estimates.
- Congress should work with the bureau and the Biden administration to provide the necessary resources to the bureau.
These may seem like self-evident steps forward, but decades of frozen budgets and resulting statistical program cuts have led to hesitancy within agencies to make ambitious budget requests. Congress must take the needs of a 21st century data infrastructure seriously by properly resourcing the economic statistical agencies to adopt bold new programs and hire a skilled workforce to carry them out.
Let’s turn first to why now is the time for federal statistical agencies to pursue releasing these data in as close to real time as possible.
Federal statistical agencies must pursue real time statistics now
Interest in, and demand for, real time economic statistics is booming. Throughout the coronavirus pandemic, important policy questions have hinged on having almost-immediate data. Are people spending or saving their stimulus checks? Is enhanced Unemployment Insurance discouraging workers from searching for jobs? What industries should be shut down—and which ones should be allowed to stay open—to balance the health costs of the pandemic against the need to produce critical goods and services?
Answering these questions requires a fast turnaround for economic data, and in many respects, the U.S. federal statistical system is well-positioned to provide answers. Our system of national accounts, for example, which was set up in the 1940s, recognizes the value of speed, providing estimates for current quarters just a month behind the close of the quarter. First estimates are revised many times and slowly become more accurate over time with revisions, but the system recognizes that a first estimate with some error is more valuable than no estimate at all.
Yet the limitations of our existing statistical system also are apparent amid the pandemic. Federal data are ill-suited to understanding current consumption patterns, for example, and researchers instead have turned to high-frequency transaction data from financial institutions to understand how the pandemic and its associated fiscal stimulus have affected the economy.
The pandemic underscores that federal statistical agencies should pursue more real-time data that can inform urgent policy questions. Many such measures, such as the distribution of economic growth, will prove just as interesting in normal economic circumstances as during crises like the pandemic.
Even more importantly, though, data series produced by federal statistical agencies are an important source of shared truth and academic consensus in economic measurement. If the agencies do not take advantage of modern advances in computing, modeling, and data access to release high-frequency statistics, then policymakers, the media, and the public will increasingly turn to private measurement efforts.
Academic economists are already making advances in this area. The availability of private administrative data and new measurement techniques has spawned efforts, such as Opportunity Insights’ Economic Tracker, which monitors employment at different levels of income and at granular geographic areas in close to real time during the pandemic.
These projects are incredibly useful for examining the state of the U.S. economy, but they come with significant caveats. First, private datasets sometimes disagree with one another. There are already examples of private datasets offering conflicting views of the economy. Several sources of administrative transaction data, for example, take data from banks and payment processors, including the JPMorgan Institute, Earnest Research, the many different data sources used by Opportunity Insights such as Affinity Solutions, and many more. There are several reasons these datasets may vary, but the most common reason is probably geographic or demographic bias that makes the sample unrepresentative of the U.S. population.
Second, private and academic efforts are necessarily less transparent. Academic teams are often unable to document their methodologies to the same exhaustive level of detail as federal agencies because when federal agencies need to make changes to their methodology, those changes are publicly announced and are often discussed and debated with stakeholders. Private teams may make sudden changes without carefully documenting them or making it obvious that something has changed.
Even if the methodology is well-documented and transparent, it is usually impossible for anyone outside of the academic team itself to verify results obtained using private data because the data are not widely available. This is not true of many federal datasets, which are often available to the public. When agencies use data that are not generally accessible to the public, those data are usually available to researchers at Census Research Data Centers.
One academic team is already publishing real-time inequality estimates similar to the BEA dataset on the distribution of personal income. University of California, Berkeley economists Thomas Blanchet, Emmanuel Saez, and Gabriel Zucman recently debuted their Realtime Inequality website, which provides monthly updates on income and wealth inequality in the United States. This research team provides a clear methodology and uses only government or other publicly available data sources, and the result is a transparent data series that provides valuable information on current movements in inequality.
A federal product would be even better. Federal data series go through an enormous amount of consensus-building peer review at advisory boards, academic conferences, stakeholder meetings, and more. This process provides a forum to explicitly debate important measurement choices, such as the simplifying assumptions that are used in the creation of the dataset and how to balance the latency of estimates against accuracy.
The proliferation of academic measurement efforts using private datasets and methodologies that aren’t verifiable and widely understood—while useful in the absence of federal real time data—could eventually lead to end-users cherry picking the measurement tool that best fits their ideological priorities. In the worst-case scenario, researchers could themselves be ideologically biased, and their measurements could be made using questionable assumptions that are difficult for outsiders, who don’t have access to the raw data, to assess. This underscores the important role that federal statistical agencies play in building consensus around certain data and why now is the time for them to invest in real time data collection efforts.
The appropriate balance between speed and accuracy
The BEA feasibility report from December 2021 performs two exercises to assess the potential accuracy of quarterly and lower-latency data. It concludes that, “While transparent, these forecasts have significant errors, which limit their utility to policy makers.” Before addressing the methodology of these forecasts, it is useful to establish what constitutes an acceptably accurate forecast.
Figure 5 from the BEA report is shown below, depicting their estimates of personal income and disposable personal income. The solid lines show their annual estimates interpolated to quarterly estimates. The dashed lines are forecasts based on microdata on a 2-year lag. (See Figure 1.)
Figure 1
BEA forecasts of U.S. income inequality and growth
Gini coefficients for U.S. personal income and disposable personal income, with BEA forecasts based on lagged data versus a series based on current data with interpolation for quarterly estimates, 2009–2018
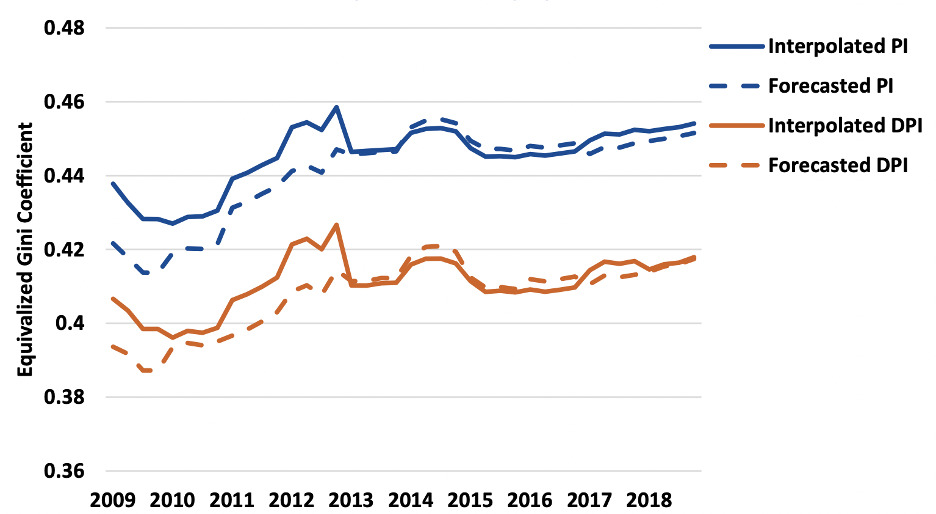
The Bureau of Economic Analysis says of this figure: “The forecast consistently underpredicts inequality for PI and DPI throughout the Great Recession and beginning of its recovery, while predicting fairly well during the stable growth period (2013–2018). The average forecast error for the quarters of 2009 (0.015) is larger than the growth in the Gini over the entire period (0.012).”
In other words, errors are high for the period between 2009 and 2013. Nonetheless, the series accurately captures the general trending up of inequality over the course of the recovery from the Great Recession of 2007–2009. Many parts of the U.S. statistical infrastructure deliver estimates that we know contain errors. The important question for agencies to ask is whether a noisy estimate nevertheless can provide useful information to policymakers and the public.
There is noise in this model, to be sure. In the first quarter of 2010, for example, the forecasted DPI series seems to rise sharply while the interpolated series falls slightly, indicating that this forecast was not simply the wrong magnitude but also the wrong direction of change for that particular period. These kinds of errors are more serious. When evaluating the validity of a forecasted series, agency economists should assess the extent to which a noisy series can transmit useful signal. Information on how a measurement is trending, even when levels are biased, is one such example of useful signal.
Our federal data infrastructure generally recognizes this issue. Many data series are constructed based on incomplete data and are revised multiple times, including our most foundational and important economic data series, such as GDP and employment. Analysts are aware that these datasets may be especially volatile in periods of rapid economic change. The U.S. Bureau of Labor Statistics recognized early in the pandemic, for instance, that the coronavirus could have huge impacts on the monthly Employment Situation release. It responded to this challenge transparently by educating data analysts and training its survey workers to collect more accurate information.
Recognizing the need for fast and accurate intelligence on the economic hardships faced by households during the pandemic, the U.S. Census Bureau quickly spun up two entirely new online surveys—the Census Household Pulse and the Census Small Business Pulse surveys—which track several measures of household well-being, including whether households are struggling to pay for basic expenses, food, or rent. There is some debate around how representative and accurate these data are, but in many cases, the Household Pulse has accurately tracked changes in more established data series, sometime before alternative data series were available.
None of this is meant to minimize the very real damage that can be wrought by inaccurate estimates. Large revisions to employment data series during the pandemic could erode trust in the statistical system with certain audiences. Agencies must proceed carefully. Prototype products such as the Household Pulse should be clearly labeled as experimental, and agencies should be transparent about unusual economic activity that may make data series inaccurate.
The Bureau of Economic Analysis currently describes the Distribution of Personal Income series as “prototype statistics,” as they should. The label is an acknowledgement that the possibility of error should not close off entire avenues of research.
Methods for improving income forecasts are available
The BEA feasibility report conducts two different statistical exercises to evaluate the feasibility of quarterly reporting of distributional income data. In the first forecast, the bureau simply converts its existing series from an annual one to a quarterly one by assuming that the distribution of each type of income remains constant during a year and applying these existing distributions to each of the dozens of components of quarterly aggregates for Personal Income.
In the second exercise, the bureau goes one step further, attempting to forecast future quarters using distributions from the past and new National Income and Product Accounts totals for income. As the bureau currently releases data on a 2-year lag, it attempts to forecast 2 years into the future, using distributions of income for quarter one of 2007 to predict quarter one of 2009, for example.
Both exercises assume the current distributions of the components of income will remain constant. So, if, for example, the 5th decile of income receives 6.3 percent of all wage income in the most recent year with comprehensive data, both forecasts assume that this group will continue to receive 6.3 percent of wage income and use updated aggregate earnings data from the National Income and Product Accounts to find totals for each group.
Although the methodology used in the report is an important first step, the size of errors in the BEA forecasts does not indicate that lower-latency or higher-frequency estimates are infeasible. The bureau did not consider creative ways of using existing datasets that could greatly reduce the error of current quarterly estimates. The authors of the feasibility report do acknowledge that a key to obtaining more accurate estimates is a data source available at quarterly or better frequency that distributes important income concepts so they can update these distributions more frequently. And while none of the data sources the bureau considered do exactly this, some could provide useful proxies if they are incorporated using appropriate imputation and modeling techniques.
A reasonable advance estimate of the distribution of growth does not require the bureau to have distributional data for every component of income. Compensation of employees—the name of the national accounts for employee wages, including benefits such as 401(k) contributions and employer contributions to Social Security—generally makes up about 62 percent of personal income, or about 58 percent of positive income, if you exclude the deduction for social insurance contributions. Accurately distributing this income component is the central challenge of modeling the income distribution in future periods.
To demonstrate, I decompose annual growth for three income groups in the BEA distributing personal income product. Following UC Berkeley’s Blanchet, Saez, and Zucman, I create three income groups: the bottom 50 percent, the 50th to 90th percentile (referred to as the upper 40 percent), and the top 10 percent. In each year, I calculate what growth for the income group would have been if the distribution of all income types remained static, but aggregates are updated. The difference between this and actual income for the group in the previous period is the contribution to growth purely from economic expansion. The difference between this measure and what actually occurred is therefore attributable entirely to changes in the distribution of income. (See Figure 2.)
Figure 2
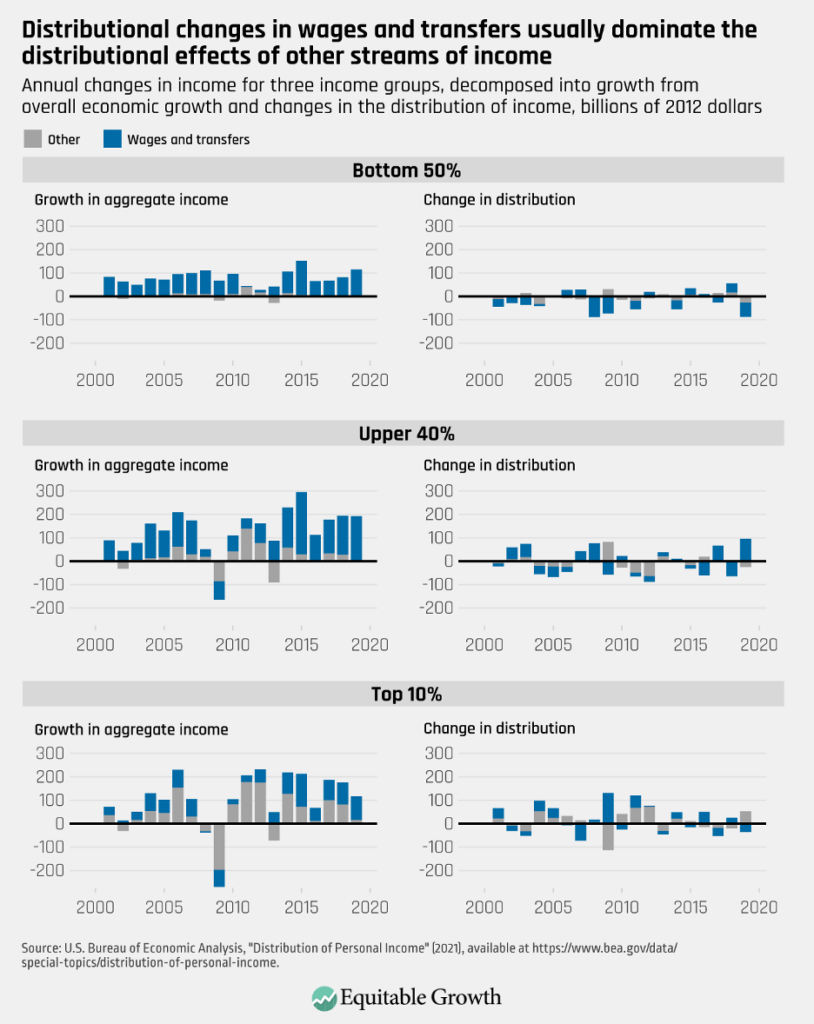
Figure 2 shows the results for all three income groups—the bottom 50 percent, the upper 40 percent, and the top 10 percent—with the contribution that comes from wages and transfers highlighted. As we can see, economic growth effects largely dominate effects from changes in the distribution. This is especially true if wages and transfers can be redistributed accurately, in which case both growth effects and the largest distributional effects could be removed as sources of error (with the caveat that an updated distribution will carry its own error), leaving only the gray portion of the bars of the right side of Figure 2 as unknown. Notably, these gray bars are larger for the top 10 percent, suggesting that it may be more difficult to make accurate estimates of this group.
Academic economists have made considerable progress on this methodological challenge. Jeehoon Han of Zhejiang University, Bruce Meyer of the University of Chicago, and James Sullivan of Notre Dame utilize the monthly Current Population Survey’s rarely used family income variable to predict poverty in current periods before the Census Bureau’s release of the annual poverty rate. An innovative paper from economist Byoungchan Lee at Hong Kong University of Science and Technology uses the Quarterly Census of Employment and Wages to measure earnings inequality in recent quarters.
Blanchet, Saez, and Zucman use Lee’s methodology to create their Realtime Inequality data series. As in the BEA forecasts, the Blanchet, Saez, and Zucman method holds the distribution for some components of income steady and distributes new aggregates according to the old, known distributions. But they also attempt to redistribute some categories in real time. Using the Quarterly Census of Employment and Wages’ granular geographic and industry breakdowns, they estimate changes in the distribution of wage income in current periods.
In its feasibility report, the Bureau of Economic Analysis notes that QCEW data are aggregated, and therefore not well-suited for distributional analysis. Yet Lee’s innovation is recognizing that although it does not contain data on individual employees, QCEW data are decomposed into more than 260,000 industry-by-county-by-ownership-type cells. This disaggregation, Lee argues, is “enough to capture major dynamics of earnings inequality.”
In fact, he is able to show that his constructed measure of earnings inequality closely follows an annual series based on the Current Population Survey’s Annual Social and Economic Supplement, which is the foundation of the BEA distributional dataset. Blanchet, Saez, and Zucman conduct their own validity check and find that their QCEW-based distribution of wages is a close match for the distribution in their primary data series based on tax data.
In addition to modeling changes in the distribution of wages, Blanchet, Saez, and Zucman also simulate changes in government transfers in real time. Although transfers are less than a third of the size of wages, they are the second-largest source of income for U.S. households and are especially important for households in the bottom of the income distribution: They make up a larger percentage of income than wages for the bottom three deciles. Moreover, transfer policies may change quickly when the economy is in recession, and the federal government swoops in to prop up struggling households. These policies can have a significant impact on inequality.
Blanchet, Saez, and Zucman account for this by simulating the distribution of government transfers using the known rules of each transfer program. The first round of pandemic stimulus checks, for example, sent out in late 2020, amounted to $1,200 for individuals and $2,400 for couples below a certain income threshold, allowing Blanchet, Saez, and Zucman to simulate the distribution of these checks in their microdata. They similarly simulate the impact of the Paycheck Protection Program—notably, they use program incidence information from a 2022 working paper that would not have been available if these measures were live in 2021—and the expanded Earned Income Tax Credit and Child Tax Credit.
Adjusting the distribution of wages and transfers leaves just the capital income components of Personal Income: rental income of households, household income receipt on assets, and proprietors’ income. To my knowledge, no researcher has yet identified datasets that could be used to calculate new distributions of these income categories in current periods.
Blanchet, Saez, and Zucman simply age previous distributions of these income sources forward. Rental income is the smallest source of income for households, at just 3.7 percent of total Personal Income. Proprietors’ income represents 8.7 percent of total Personal Income and is especially important to incomes in the top decile, where it represents 18.8 percent of Personal Income in 2019. The last bit of capital income is returns on assets, composed of interest and dividends income. This is the largest pot of capital income, representing 15.8 percent of all income and representing more than a quarter of all income for the top decile.
The overall accuracy and usefulness of the Blanchet, Saez, and Zucman model should be subject to scrutiny, but the initial results are promising. They are frequently able to closely predict the magnitude and direction of income growth for different groups. In 43 annual predictions of growth in the time period that is 1 year ahead of their current tax data, they rarely predict the wrong direction for growth for the four groups they analyze—the bottom 50 percent, the 50th to 90th percentile, the 90th to 99th percentile, and top 1 percent of the income distribution.
There are nonetheless significant errors in some years. While plots of their predicted growth against actual growth show mostly dots near a 45-degree line—a dot directly on the 45-degree line is a perfectly correct prediction—there are occasional outliers. In some cases, Blanchet, Saez, and Zucman’s predictions are several percentage points different from actual growth, and their predictions are less accurate at the top of the income distribution, as seen in Figure 3 from their paper, reproduced below. (See Figure 3.)
Figure 3
The Blanchet, Saez, and Zucman Realtime Inequality data series uses novel methods to predict U.S. income growth in real time
Realtime Inequality’s predicted income growth rates, compared to actual income growth rates, for four income groups in the United States
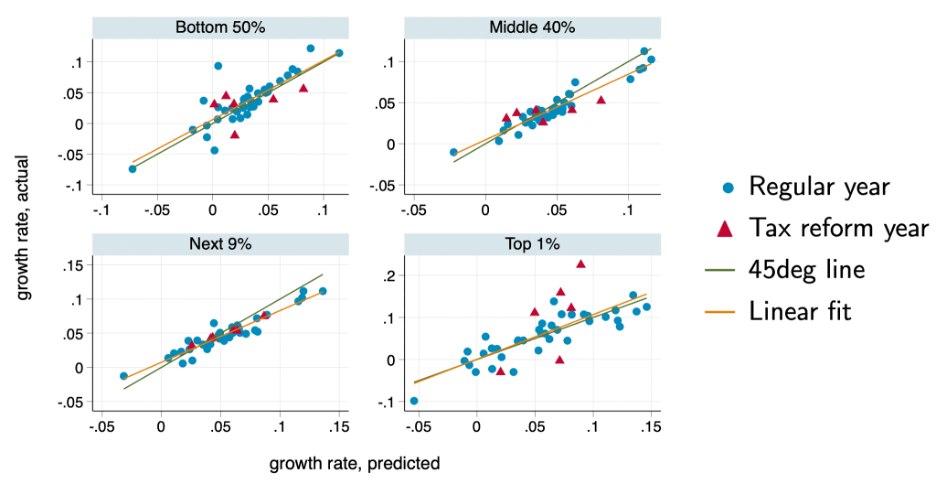
Blanchet, Saez, and Zucman’s methodology for distributing wage income in current quarters, despite these issues, is an excellent starting point for building a data series with current years and quarterly data.
In the BEA feasibility report, the authors outline what an ideal data source would look like. It would be a panel. It would include joint distributional information for transfers and wages. And it would have a quarterly release cadence. There is no data source that meets all these criteria, but economic measurement is often based on incomplete data and a reasonable set of assumptions. The Bureau of Economic Analysis should explore whether simulation and imputation based on data sources, such as the Quarterly Census of Employment and Wages, can help reduce forecasting error.
Conclusion and recommendations
U.S. economist Simon Kuznets first produced the National Income accounts in 1934. In the nearly nine decades since, these statistics—which are now produced in the United States by the Bureau of Economic Analysis and have spread to the rest of the world—have arguably had a greater impact on the theory and practice of economic policy than any other economic data series.
Kuznets was keenly aware of the limitations of national accounting. In addition to the oft-repeated quote that “The welfare of a nation can, therefore, scarcely be inferred from a measurement of national income,” he also observed that “Economic welfare cannot be adequately measured unless the personal distribution of income is known.” That sentiment has only become more accurate over time as the broad-based growth of the 1950s and 1960s has given way to starkly unequal growth over the past four decades.
Kuznets’ admonitions remain relevant today. To understand how the economy is performing for U.S. households, it is imperative to add distributional data to the existing national accounts data. These should be produced at intervals comparable to GDP growth so that aggregate growth and the distribution of it can be analyzed jointly and on even footing with one another.
The purpose of the federal statistical system is to provide a reliable, transparent, nonpolitical set of measurements to analyze, discuss, and debate. But the system cannot serve this purpose if it cedes certain types of economic measurement to academics and private research groups. Federal agencies must respond now to the demand for more real time data.
Doing so will require the Biden administration and Congress to devote more resources to this effort. The Realtime Inequality dataset was created by a team of economists who have been producing distributional growth estimates for more than a decade and who have access to IRS tax data that the Bureau of Economic Analysis does not. The Federal Reserve produces a similar product called the Distributional Financial Accounts. The working paper that introduced these accounts had 12 co-authors. By comparison, the BEA estimates are mostly developed by two economists at the agency.
 report
Disaggregating growth
March 28, 2018
 working paper
Simplified distributional national accounts
January 28, 2019
 Coronavirus Recession
Insufficient resources are the biggest impediment to further development of the data series. While the Bureau of Economic Analysis has taken the first steps by conducting a feasibility study using fairly naive forecasting techniques, more sophisticated forecasting techniques and data work will be necessary to increase the utility and quality of these estimates—meaning more economists’ time must be spent on this work—and as such, the bureau will require more funding.
The BEA feasibility report does not directly address the question of what resources the agency needs to more aggressively develop the distributing personal income series, but the necessary sums are likely not large. The BEA budget is just more than $100 million total, a relatively small amount of money for the federal budget. The bureau must scope the work, with the assistance of academics and other experts where appropriate. Where current resources are insufficient, it should identify the resources it and other federal statistical agencies need and communicate these needs to their parent departments and to Congress, preferably in the Biden administration’s annual budget documents.
The U.S. Commerce Department’s next budgetary request should explicitly include funding for this project, alongside a description of how the Bureau of Economic Analysis plans to expand and improve upon the data. If the Commerce Department or the bureau do not scope this work and provide an estimated budget for it, members of Congress should request it. Any member of Congress who believes that inequitable growth is hindering the broader economy must take steps to ensure the federal statistical agencies can properly measure its impact across the income distribution.