The U.S. economy is in its fourth decade of rising inequality amid the need for more accurate data on its consequences

Overview
Economic inequality in the United States continued to rise over the first two decades of the 21st century, according to new data from the U.S. Bureau of Economic Analysis—a trend that builds upon the sharp divergence between the fortunes of the truly rich and the rest of society that began around 1980. As we enter the fourth straight decade of rising income and wealth inequality and their attendant social inequities—such as the widening gulfs in college attendance and life expectancy—U.S. policymakers, now more than ever, need more accurate data to deal with the baleful consequences of inequitable growth.
Most of this rise in inequality occurred before 2000, but the latest data show that U.S. households are still slowly drifting apart from one another. December’s BEA data release expanded the bureau’s distributional data series to cover 2000 through 2019, where it previously only covered 2007 through 2018. These more complete data encompass the entirety of two business cycles: the dot-com bubble-induced recession of 2001 and subsequent expansion, and the Great Recession of 2007–2009 and subsequent expansion, before the arrival of the coronavirus pandemic and ensuing recession in 2020.
Until the Bureau of Economic Analysis extends the series backward further, it’s difficult to say how increases in inequality now compare to those that happened in the 1980s and 1990s—but two things are clear. First, inequality continues to rise. Second, these data are critical to understanding the consequences of economic inequality in the United States.
This issue brief provides analysis of the most recent release. The evident utility of the data series, as shown here, demonstrates why the Bureau of Economic Analysis should request more resources from Congress to expand and improve this dataset, especially by adding more current data that would allow us to analyze trends now, rather than 2 years in the past.
What the latest economic data show about rising economic inequality
The U.S. economy is in its fourth decade of expanding inequality. One way to see this is to compare average growth in incomes to the growth realized within particular income brackets. Average growth in disposable personal income over the period from 2000 to 2019 was about 2.3 percent but ranged as high as 2.7 percent for those in the top 10 percent of household income and as low as 1.6 percent for the lowest-income households. Even within the top 10 percent, there is significant dispersion: The top 1 percent had an average growth rate of about 3.3 percent. (See Figure 1.)
Figure 1
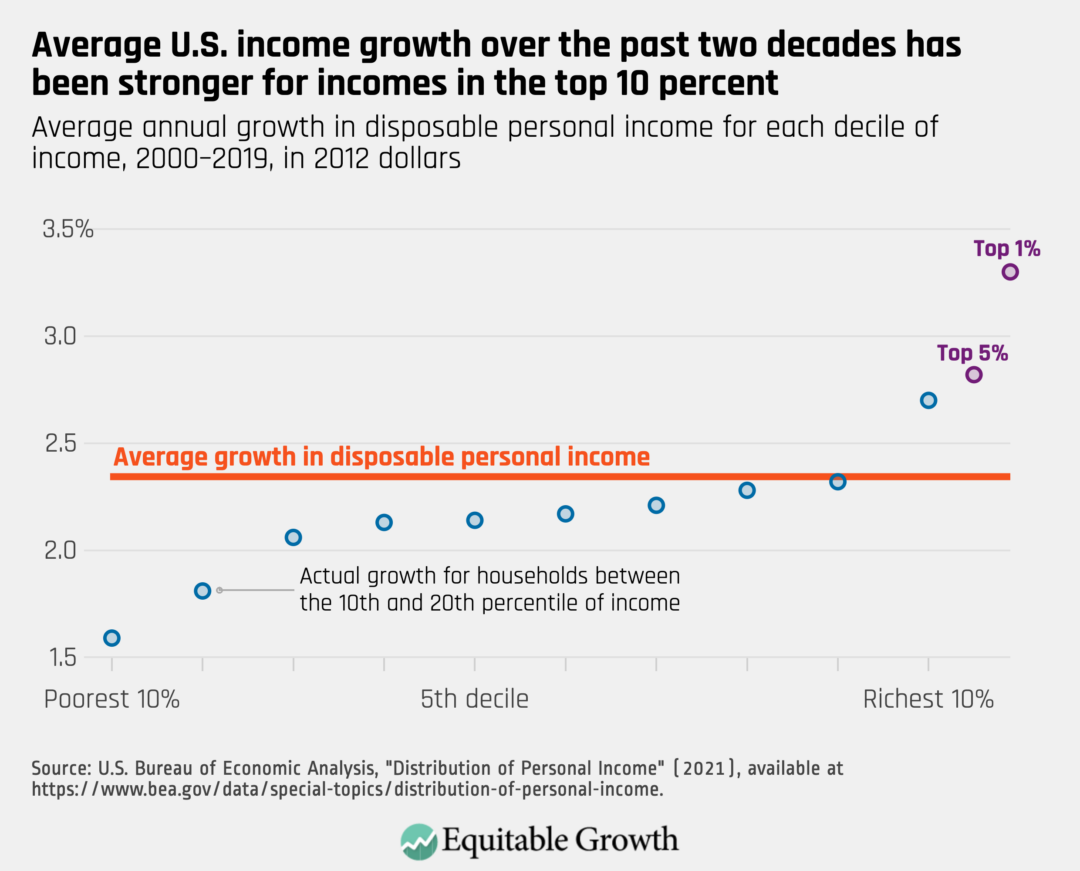
As Figure 1 shows, “headline” personal income growth figures—those that are most commonly reported by analysts, the media, and other sources—overstate the actual growth experienced by virtually all U.S. households. Only the top decile exceeds headline growth. Headline growth is simply an average, and in an age of inequality, the average is largely determined by very rapid income growth for the highest incomes.
These differences add up over a 20-year window: A household experiencing the same income growth rate as top 1 percent of households would end the 20-year period with income 20 percent higher than if they had instead experienced just average growth. The difference between experiencing the income growth of a bottom 10 percent household in this period or experiencing average growth is a 15 percent income premium over the period. And this represents just a small part of the run-up in inequality that started sometime around 1980. The Bureau of Economic Analysis should continue to extend the series back in time, so comparisons to this period can be made.
The federal statistical system needs to be resourced to expand and continue reporting on inequality
Four decades of rising inequality calls for a more robust policy response to ensure broad-based growth in the U.S. economy. An important first step is to develop the data infrastructure to track growth in inequality over time, so that policymakers can monitor and respond to the problem, and voters can hold them accountable to producing strong growth for all U.S. households.
Existing data series are insufficient. One of the few reports by the federal government on economic inequality is the U.S. Census Bureau’s September Income and Poverty Report. The Bureau of Economic Analysis has already significantly improved on this report by using a more comprehensive income concept, releasing more granular income groups (the Census Bureau releases quintiles), and fully accounting for income in one national account (the Bureau of Economic Analysis fully accounts for all Personal Income). But there is much more to do.
Congress must give the Bureau of Economic Analysis the resources to continue developing this work. There are three important avenues for further development of this product. First, the current BEA product underestimates top incomes because it does not account for capital gains. This is not an intentional omission but rather a reflection of the fact that capital gains are not included in any national accounts.
Economists Thomas Piketty at the Paris School of Economics and Emmanuel Saez and Gabriel Zucman at the University of California, Berkeley, in their pathbreaking 2018 article on distributional national accounts, attempted to mitigate this omission by using National Income as their income concept. National Income includes retained corporate earnings, which Piketty, Saez, and Zucman argue can act as a proxy for unrealized capital gains.
Distributing retained corporate earnings, however, requires making several simplifying assumptions that may be prone to error. Statistical agencies should research a separate series of the distribution of capital gains that is compatible with the distributional personal income data. Economist Jacob Robbins at the University of Illinois at Chicago defines a measure of Gross National Capital Gains that could be a model for such a data series.
Second, these data must be released on a shorter delay. Currently, the Bureau of Economic Analysis plans to release these data once a year in December, adding data for the period 2 years prior. This is what happened last month—2019 data were released in 2021. This is a useful tool for understanding the near past, but it will not help policymakers make real-time decisions, and it will not help households understand and respond to the economic conditions they currently face.
There are challenges with publishing more current data, but they are surmountable. With proper resources and a willingness to impute and model current data, BEA staff can release this data series at a higher frequency and with less latency.
Finally, expanding this new data series back in time to include the 1980s and 1990s would enable policymakers to have an even better grasp of rising economic inequality trends over generations. This year’s data release demonstrates how much policymakers can learn about inequality in the U.S. economy—and how much more they could learn if the data were released more frequently and collated over longer periods of time.
Examining U.S. income inequality over the past 20 years
U.S. households at different levels of earnings had significantly different experiences of the past 20 years, with the top 1 percent experiencing more income growth. Those with high incomes saw more immediate and deeper drops in income during recessions, while those with lower incomes were partially supported by government “transfers,” economic parlance for social infrastructure programs such as Unemployment Insurance that underpin the economy during downturns. But the flip side is that low-income households experienced years of stagnation after recessions had subsided, with very little of overall economic growth accruing to those in the bottom half of the income distribution despite moderate headline growth. (See Figure 2.)
Figure 2
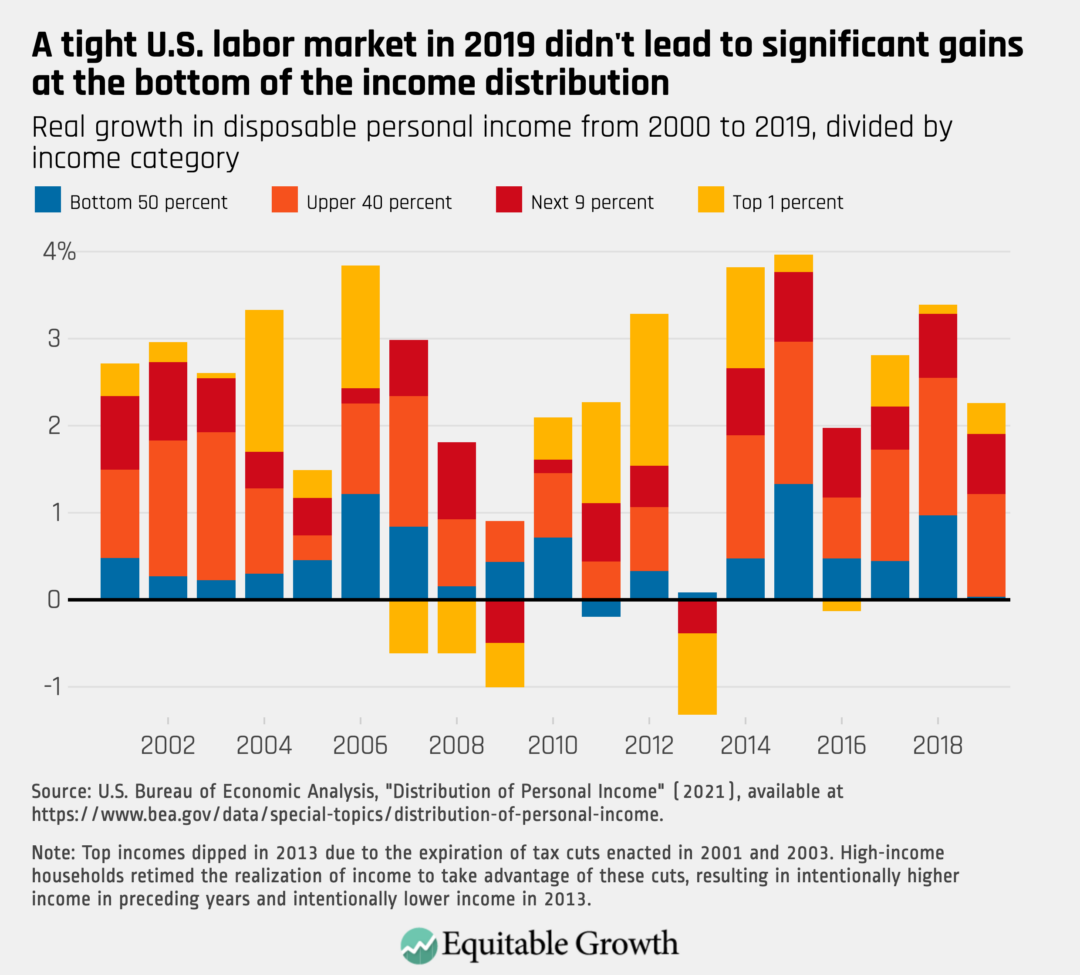
Figure 2 shows income growth in each year subdivided into four groups that some researchers and academics commonly use. They are the bottom half of all income earners in the distribution, the next 40 percent of earners (50th to 90th percentile), the next 9 percent at the top (90th to 99th percentile), and the top 1 percent. The blue portion of each bar shows the amount of growth that benefitted earners in the bottom half of the distribution. Warm colors—yellow, red, and orange—show the amount of growth in each year that accrued to the top.
U.S. households move between deciles frequently. The Bureau of Economic Analysis does not follow people over time, so those in the bottom 50 percent of income in one year may not be there the next year. This means these data do not chart economic mobility, only the shape of the overall income distribution. But the overall shape of the distribution is important. When wages for the bottom 50th percentile aren’t increasing, it means that there is little wage growth in the kinds of jobs occupied by those with low educational attainment, young workers, and those in vulnerable populations. The U.S. economy used to deliver real growth to this end of the distribution, but for the past four decades, it has been increasingly stingy.
Households in the bottom 50 percent of the income distribution experienced relatively little growth in incomes over the past 20 years: Over that entire period, the bottom 50 percent of the distribution captured just 20 percent of all growth, even though they represent half the population. Meanwhile, the top 10 percent—a group just one-fifth the size of the bottom 50th percentile—captured 37 percent of overall growth. (See Figure 3.)
Figure 3
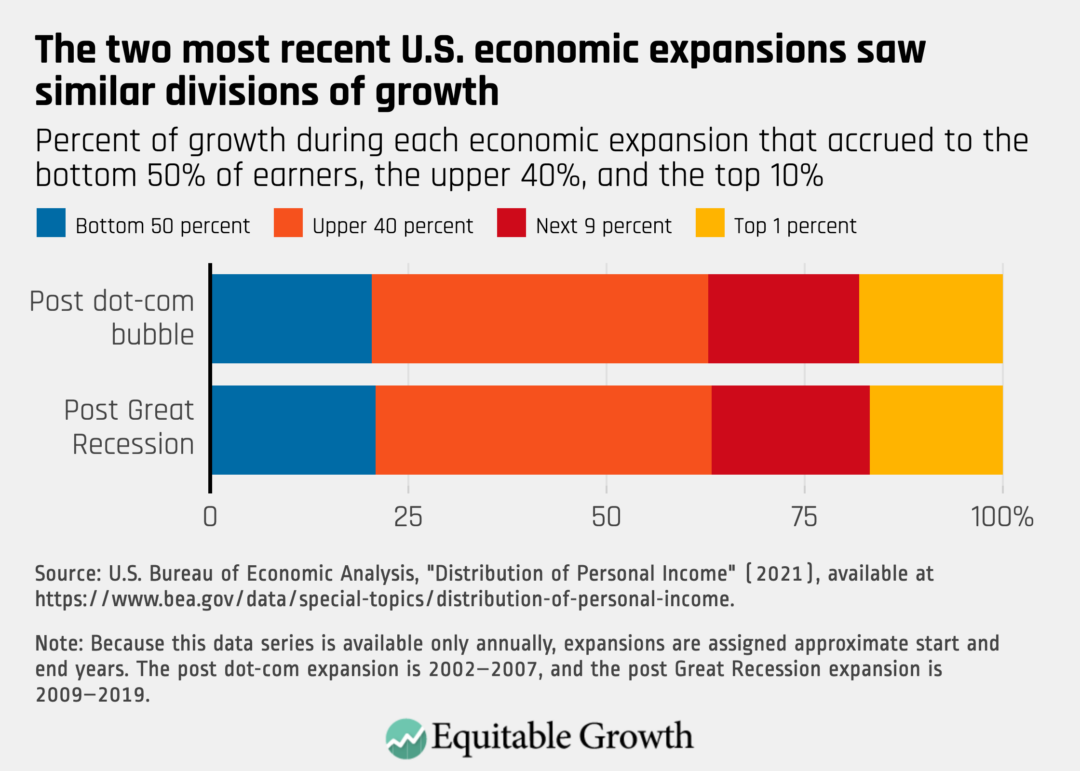
This pattern was stable across the two economic expansions in this time period. The expansion after the Great Recession was slightly more equal, with the top 1 percent of income earners benefitting less, compared to other groups, but differences were slight.
The BEA data series also provides detail on how particular components of income, such as wages, transfers, or business income, changed for households in each decile of income. Looking at fluctuations in these components is a useful way to understand how the economy works for U.S. households at different points on the economic ladder.
Households in the bottom half of the income distribution, for example, are largely dependent on wages and government transfers. In 2019, wages represented 49 percent of positive income for this group, and government transfers made up another 40 percent (you can see all the components that make up personal income here), with most other components contributing very little to incomes of the bottom 50 percent of income earners. So, fluctuations in overall income for this group are largely due to wages and transfers. (See Figure 4.)
Figure 4
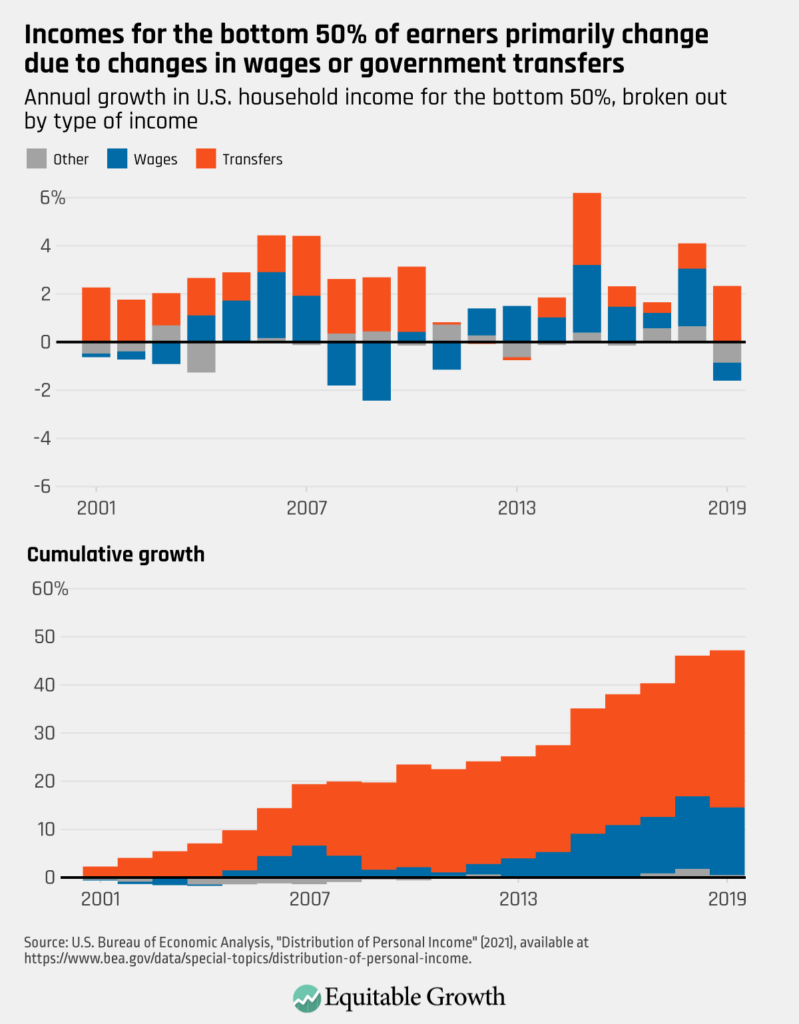
The top panel of Figure 4 shows annual growth in each component, while the bottom panel shows cumulative growth. The majority of all growth for this group came from growth in government transfers. Wage growth contributed 30 percent of all growth for the group, while the contribution of all other income sources was negligible.
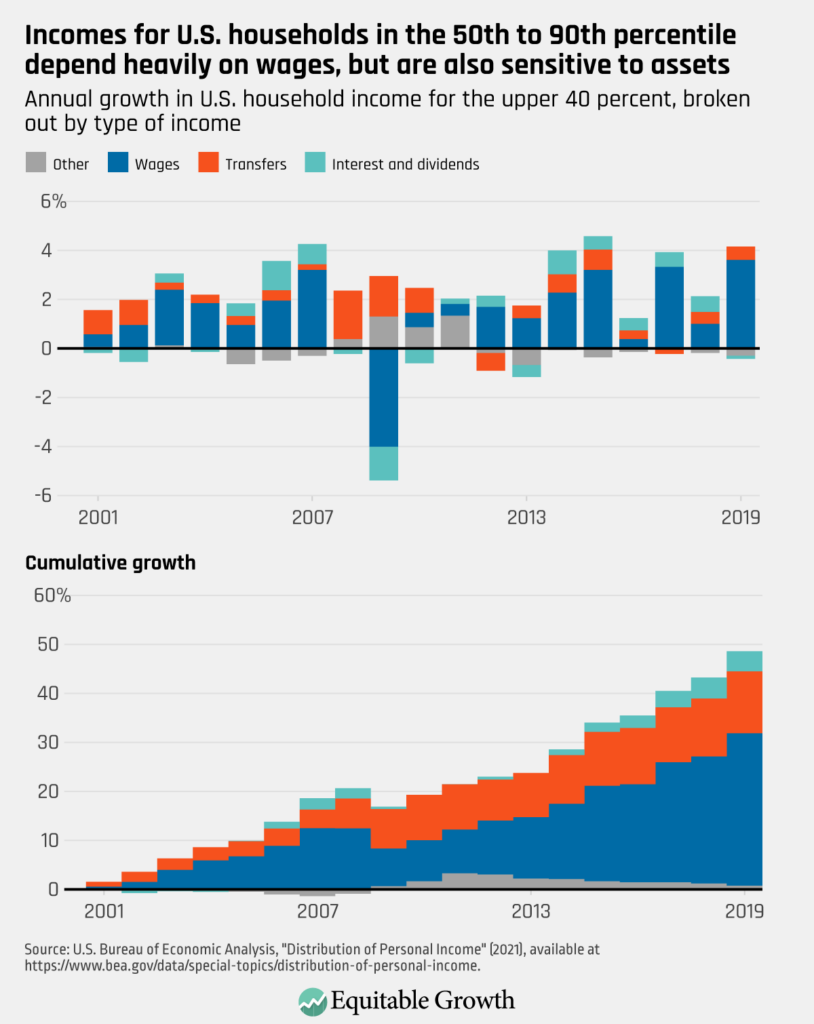
The “upper 40” group of households derive most their income from wages, but government transfers still provided about 13 percent of income for this group in 2019. Unsurprisingly, the relative importance of these two categories for income growth is flipped for this group of households, compared to “bottom 50” households. Over the 2000–2019 period, 64 percent of income growth for this group came from growth in wages, but the Great Recession hit the wages of this group particularly hard. Subsequent years saw a rapid recovery. Transfers accounted for about 26 percent of all growth for this group over this time period. Yet this group did earn some interest and dividend income, accounting for about 8 percent of income. (See Figure 5.)
Figure 5
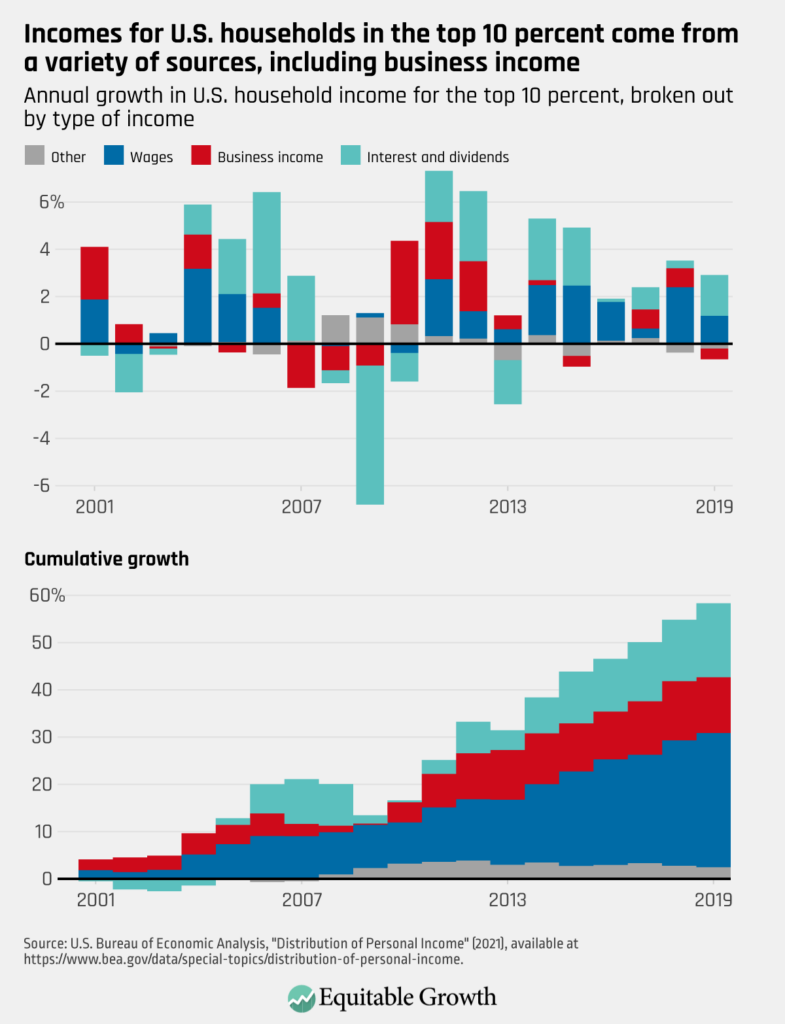
The top 10 percent of households by income have the most diverse sources of income. Although wages are still important for this group, making up about 51 percent of positive sources of household income, these households also have significant amounts of business income and interest and dividends income. About 27 percent of all growth over the period came from interest and dividends, while about 20 percent of growth came from business income. (See Figure 6.)
Figure 6
Conclusion
The BEA distributing personal income data series has progressed rapidly in just a couple of years. Every year has seen significant improvements in the statistical methodology and the amount and types of data available.
The current product allows for useful analysis of the recent past, with important applications to current policy debates. Knowing how growth in the economy is distributed is just as important as knowing how much the economy is growing. Congress must resource this effort, so the Bureau of Economic Analysis can expand the data series. This should include:
- Improve frequency and latency: The bureau should investigate ways to decrease the lag in the release of estimates. Right now, data are released in December for 2 years prior. In December 2022, we will get data for 2020, giving us our first glimpse of the coronavirus pandemic, yet this lag is too long. Ideally, estimates would be released quarterly, putting this product on the same footing as GDP growth.
- Extend the time series back: There also is significant value in having a complete history of inequality in the modern U.S. economy. The bureau should make efforts to extend the data series back in time to allow comparisons with earlier eras.
- Account for capital gains: Although this has traditionally not been the purview of the bureau, capital gains are increasing and contribute significantly to economic inequality. The Biden administration or Congress should consider tasking the bureau or another agency with tracking this trend.
Together, these three steps would vastly improve our nation’s economic statistics and enable policymakers to act on the harmful consequences of four decades of rising economic inequality.