New Great Recession data suggest Congress should go big to spur a broad-based, sustained U.S. economic recovery

Overview
As federal policymakers debate President Joe Biden’s proposed $1.9 trillion American Rescue Plan, critics now argue that it will “overshoot,” meaning it would boost economic activity beyond the desired level. The economic track record of the past 10 years shows these concerns are misplaced. Undershooting the policy response would be a far more dangerous prospect and could lead to a repeat of the slow and inequitable economic growth that followed the previous U.S. recession.
After the Great Recession of 2007–2009, then-President Barack Obama and the U.S. Congress passed an insufficient stimulus, then pivoted too quickly to debt reduction. This was a crushing mistake that left many U.S. workers and their families stuck in the doldrums for years, facing stagnant, or even declining, incomes. The slow and uneven recovery was the direct result of these policies. This time, federal policymakers would be wise to err on the side of doing too much rather than too little.
A new data series from the U.S. Department of Commerce’s Bureau of Economic Analysis—its Distribution of Personal Income series—shows just how devastating this pattern was for most U.S. workers and their families. The agency’s new data series charts the distribution of aggregate growth in Personal Income and Disposable Personal Income, and reports how much growth accrues to the bottom, middle, and top of the income distribution. A new release in December 2020 updates the dataset through 2018, capturing most of the recovery from the Great Recession.
The lesson from the data is clear. The policy response to the Great Recession left millions of low- and middle-income families struggling while wealthy families saw significant additions to their incomes. Consider the cumulative growth in disposable personal income of high- and low- or moderate-income Americans. High-income households in the top 10 percent initially suffered a steep drop in income at the onset of the Great Recession due primarily to the collapse of income from assets such as stocks and bonds, which cratered early in the economic downturn, alongside business income losses. Low- to middle-income households in the bottom half of the income distribution did not initially suffer as dramatic a fall. (See Figure 1.)
Figure 1
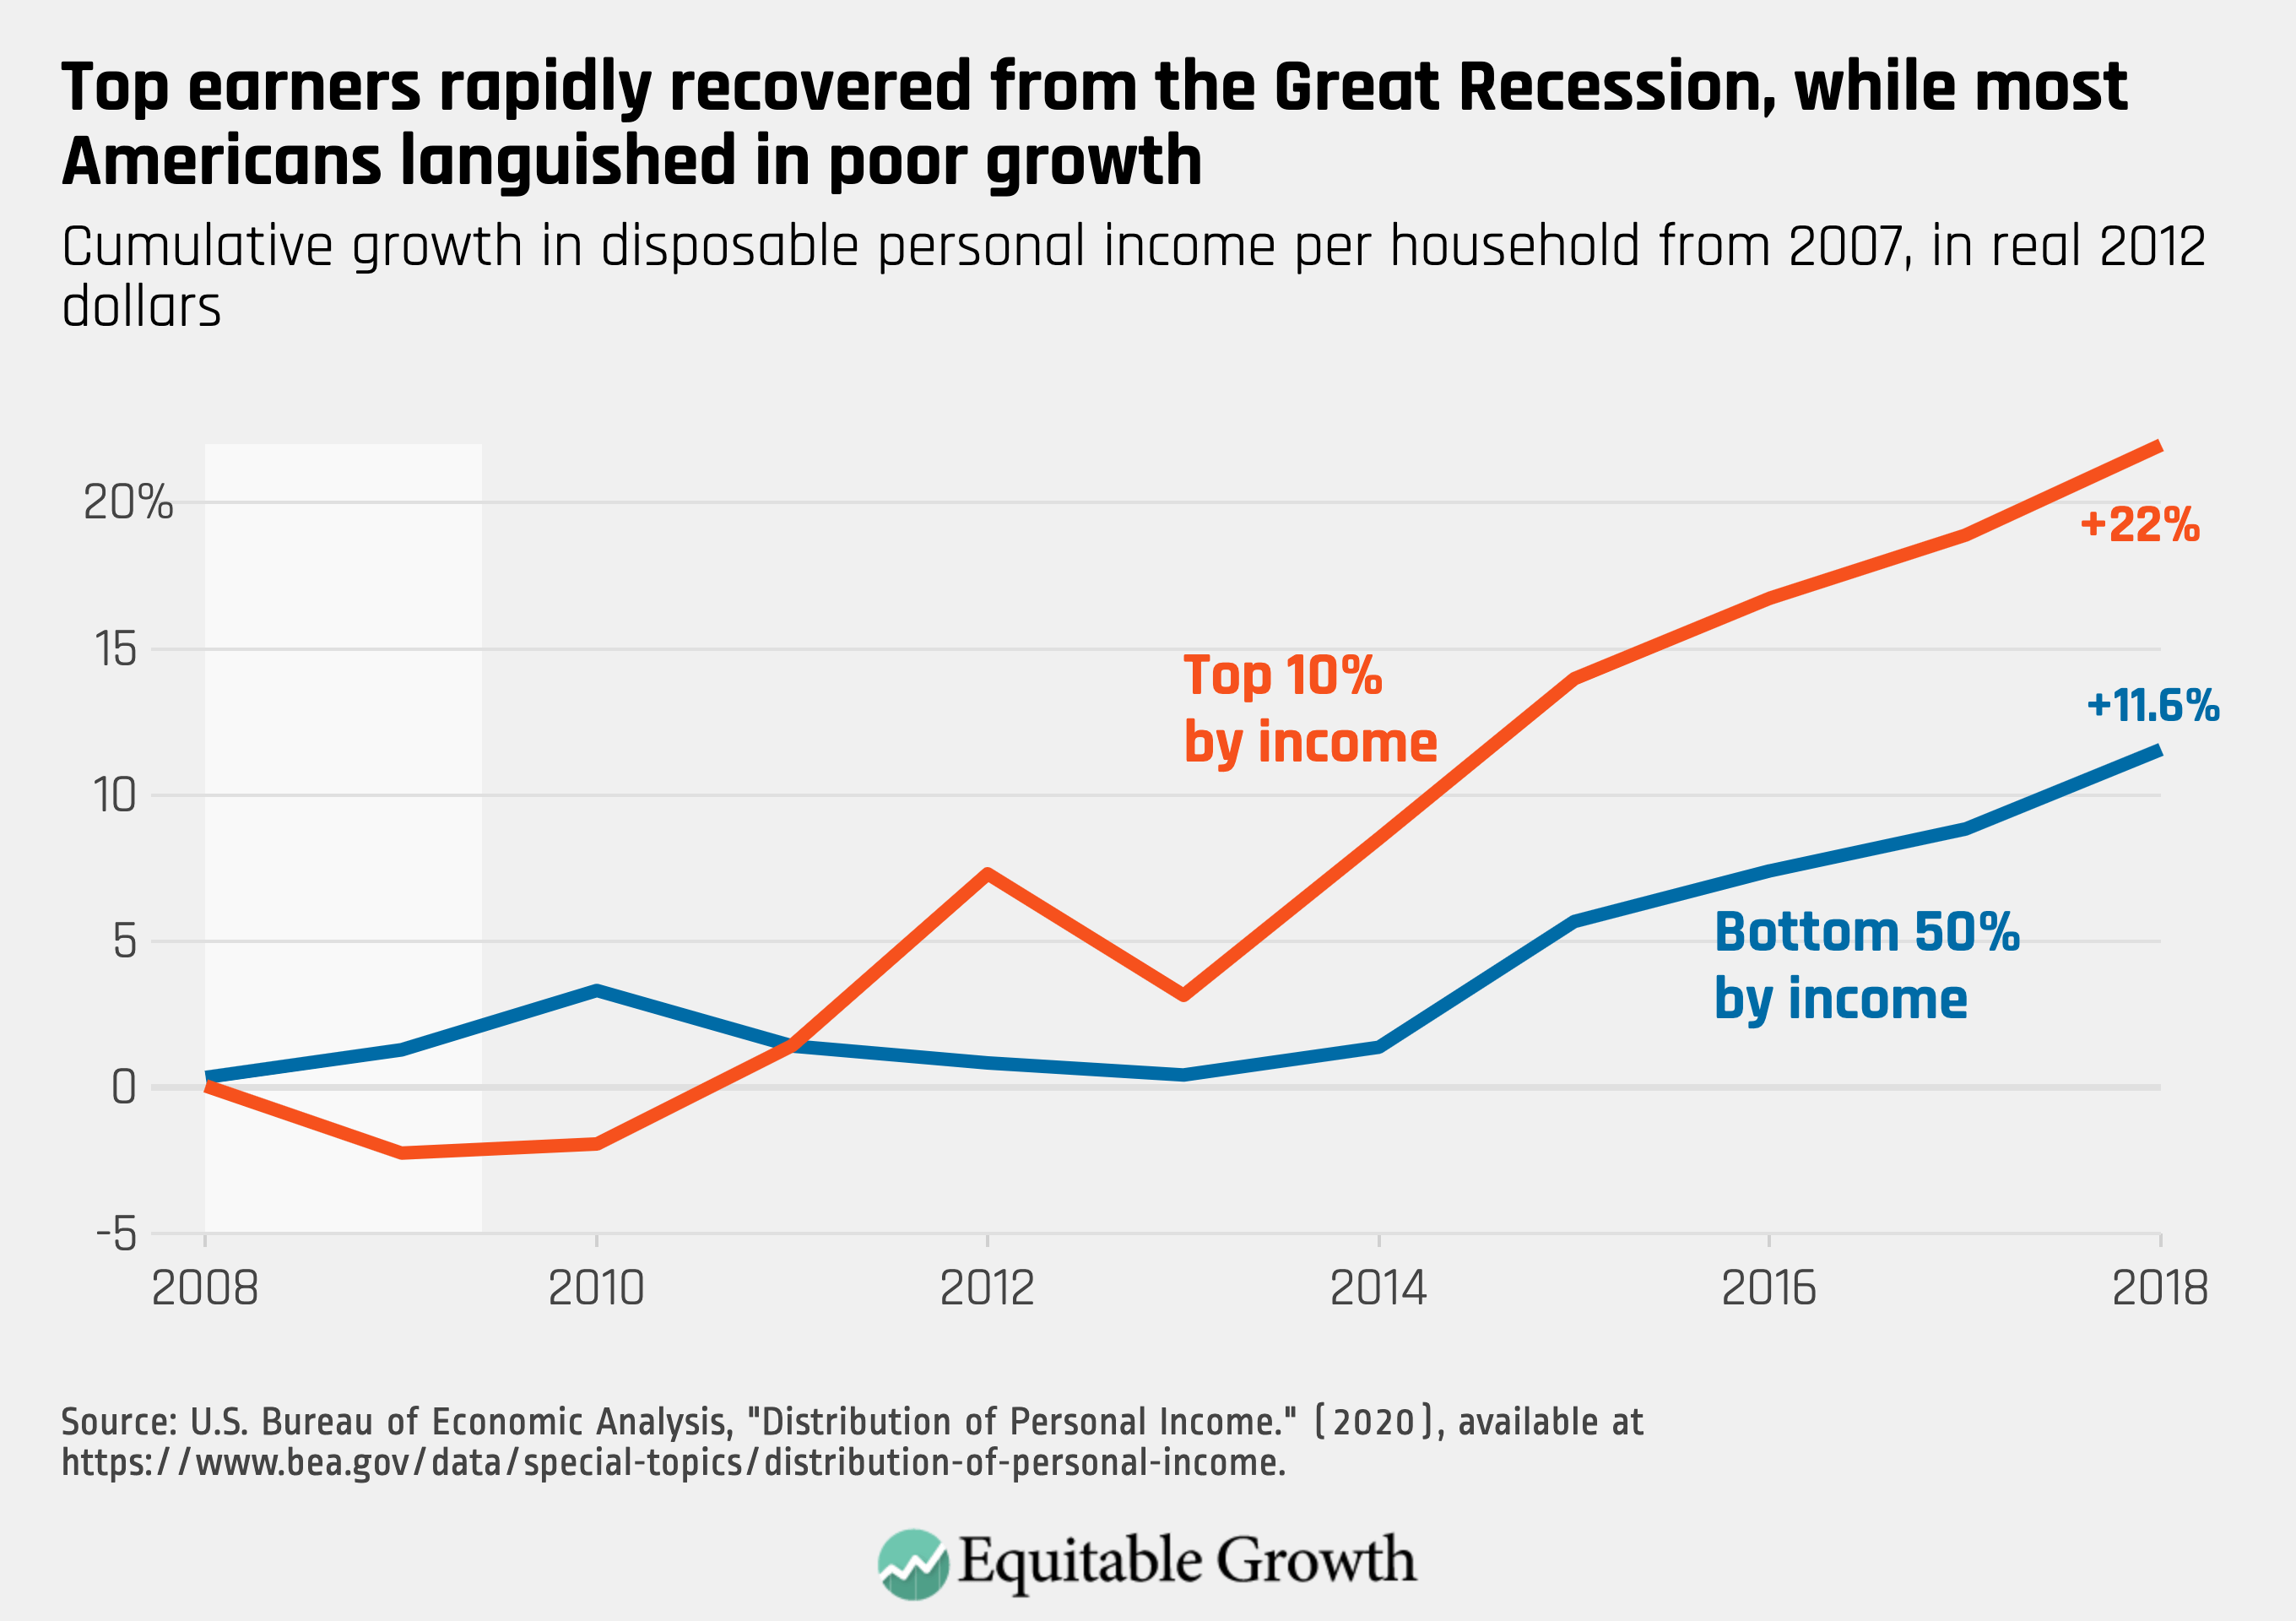
One reason for the less dramatic shock to income seen in Figure 1 among households in the bottom 50 percent was because disposable personal income incorporates transfers from the federal government to households, so losses in this group were partially compensated for by rising Unemployment Insurance payments, Supplemental Nutrition Assistance Program benefits, and other government benefits. But this group then became mired in years of stagnant, or even declining, income as these benefits ended amid a still-tepid economic recovery, and did not experience substantial income gains until 2015.
By comparison, households in the top 10 percent of income recovered almost immediately after the end of the Great Recession and ended 2018 up 22 percent, compared to 2007. Importantly, the jump in top incomes in 2012 and steep decline in 2013 seen in Figure 1 does not represent a real decline, but rather is the result of households retiming their income to occur in 2012 so they could avoid rising top-income tax rates in 2013 as a result of the expiration of high-income tax cuts first enacted during the George W. Bush administration.
This issue brief breaks down the new BEA data series to discern why the U.S. economic recovery from the Great Recession was so weak and uneven, and what lessons can be learned from the policies of economic austerity enacted by Congress too swiftly after the end of the previous recession. Those lessons, briefly, are that policymakers should enact strong fiscal stimulus today and should invest in the development of distributional data so they can understand in real time how broadly shared the coming economic recovery is.
What happened to families’ income during the Great Recession?
The Bureau of Economic Analysis’ new data series provides a holistic look at how incomes changed for households in the bottom 50 percent of income during the Great Recession and the subsequent recovery. Personal Income consists of wages, transfers from the government, rent income, interest and dividends, and income from individually owned businesses and businesses organized as partnerships. Americans at the bottom and middle of the income distribution derive a significant amount of their income from the first two of these, wages and government transfers.
Government transfers initially blunted the impact of the 2007–2009 recession for low- and middle-income Americans. But once the initial stimulus wore off, transfers declined, and wages languished, providing positive but small contributions to income. (See Figure 2.)
Figure 2
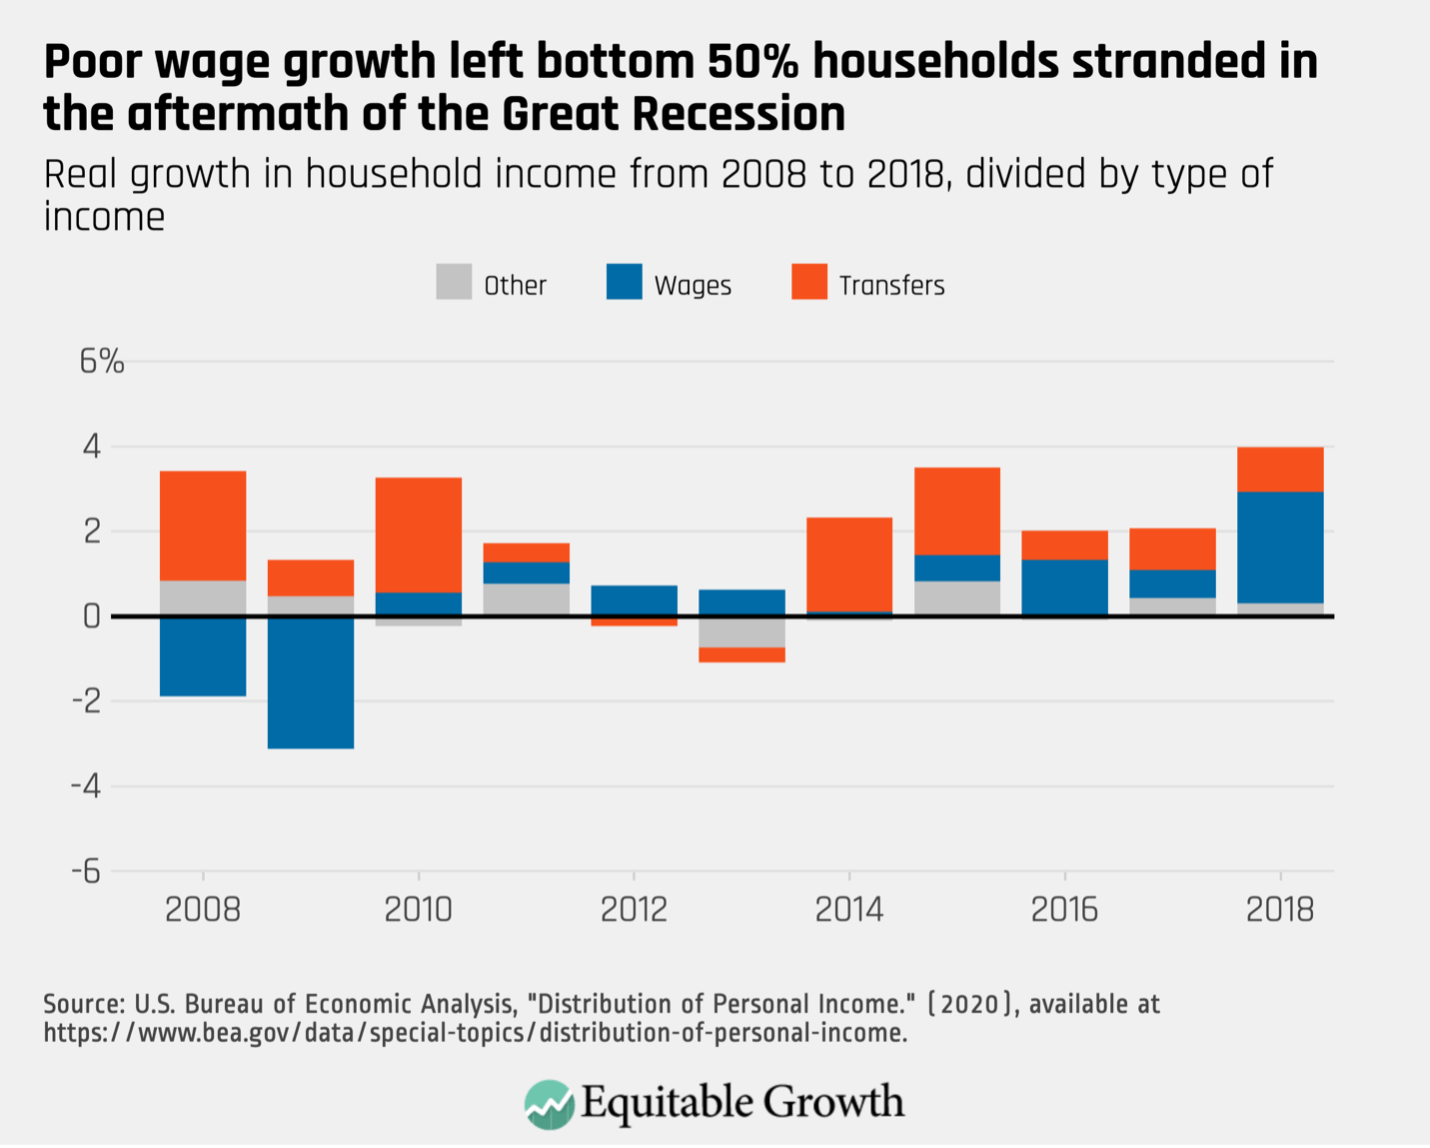
Households were bolstered in 2014 by the implementation of the Affordable Care Act. But wages continued to stagnate until around 2016. It wasn’t until the tail end of the recovery from the Great Recession that the labor market started to really work for people in this group.
By contrast, households in the top 10 percent by income recovered quickly and were helped along by a mix of income sources, such as dividends from stocks, interest from bonds, rising business income, and much stronger wage growth, than what other Americans experienced. (See Figure 3.)
Figure 3
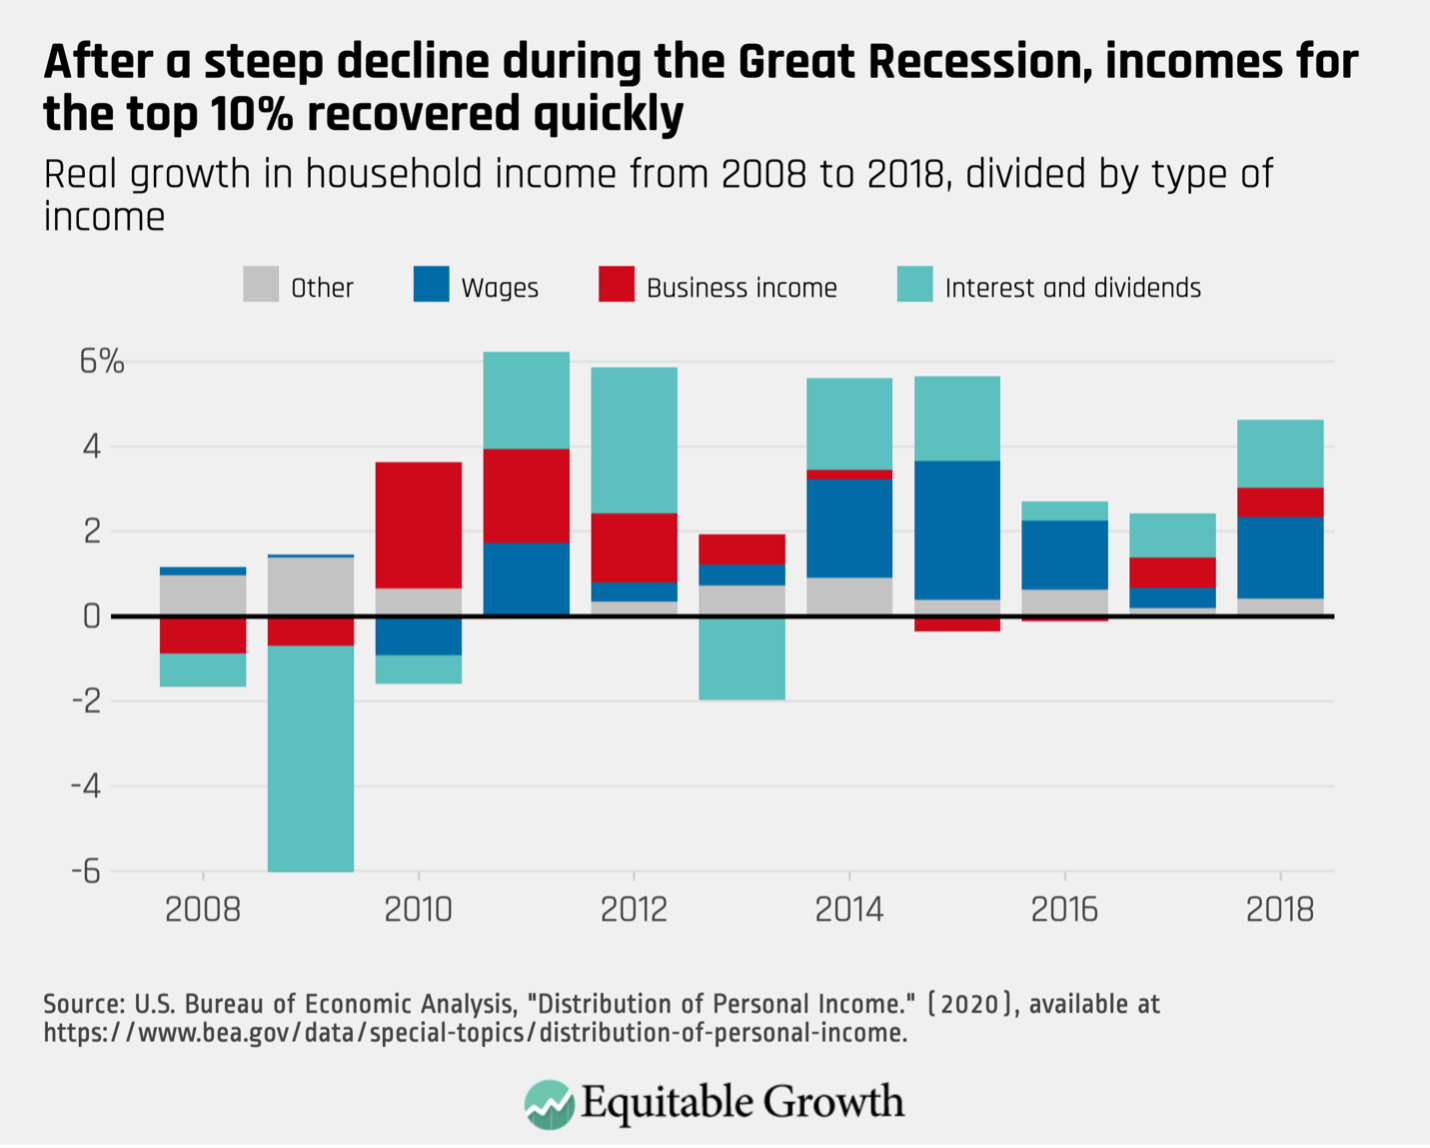
The result is that the top 10 percent of households routinely flirted with 6 percent income growth in the years after the Great Recession because they did not rely on any single source of income, but rather combined good wage growth with resurging business income and returns on their financial assets throughout the recovery period.
What’s more, this data series may understate the resurgence of top incomes after the Great Recession. The dataset-based definition of Personal Income notably excludes capital gains—the profits made by selling financial assets such as stocks. Income from capital gains is notably concentrated at the top of the income distribution.
The lesson: More economic stimulus is needed today to spur a more sustained economic recovery
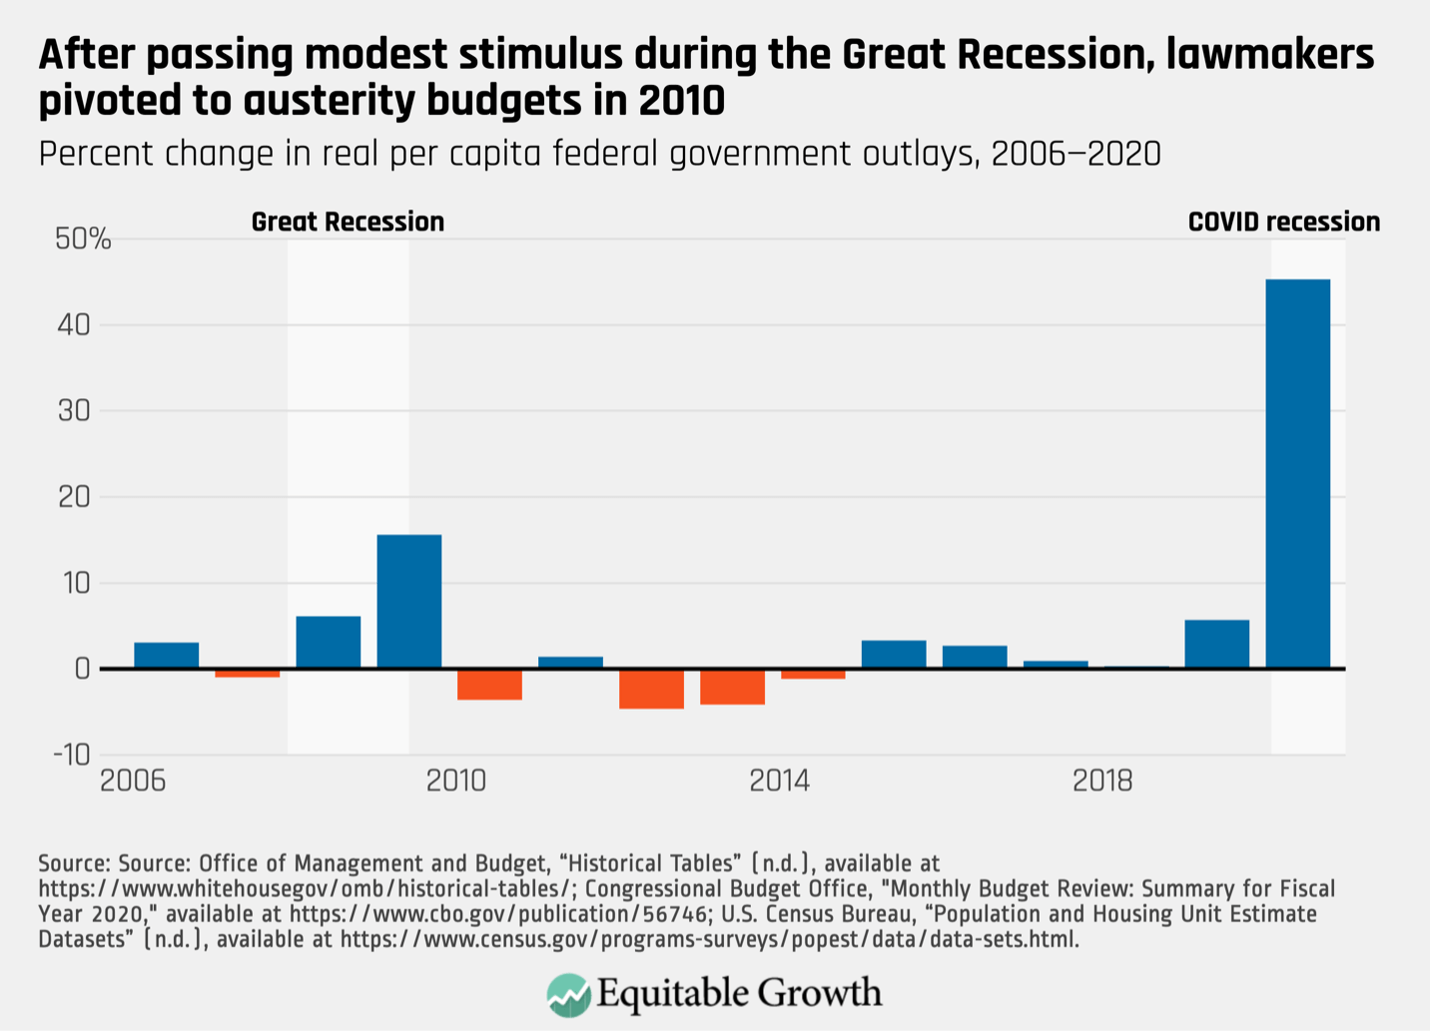
What happened after the Great Recession that led to 5 years of mediocre economic progress for most Americans? Many factors may have contributed, but 2010 was famously the year that the United States—and most of the rest of the world—pivoted to austerity politics, slashing budgets in response to the supposed largesse of economic stimulus enacted in 2009. And that stimulus was comparatively small; lawmakers in 2020 spent more money over a much shorter span of time to prop up the economy.
Beginning in 2010, federal budgets declined significantly for the first time in decades. State and local budgets likewise declined significantly, and the public-sector workforce shrunk all the way through early 2014. (See Figure 4.)
Figure 4
The lesson for the Biden administration is clear: Don’t let the foot off the gas. The slow recovery from the previous recession was a disaster for tens of millions of U.S. workers and their families. Although incomes eventually started to grow, the net result over a record-long expansion was that most families just barely recovered levels of wealth they had before the Great Recession. And young workers who graduated into the Great Recession economy may be dealing with the scarring effects for years to come.
Fast forward to today. The ongoing coronavirus recession is punishing for most families. Unemployment remains high, and it is concentrated among low- and middle-income earners. Yet, according to Opportunity Insights, high-wage employment is actually rising. And just like during the Great Recession, financial assets initially suffered but are now going up. The stocks that comprise the S&P 500 index are now up about 14 percent over their pre-pandemic high in February 2020, providing a significant boost to high-wealth households. More than half of all stocks are owned by the wealthiest 1 percent of U.S. households, and the top 10 percent own more than 80 percent of all stocks.
In recent months, aggregate job growth slowed considerably and has been especially weak for women and workers of color, strongly suggesting the initial signs of recovery amid the coronavirus recession may not last, absent more government intervention. And federal policymakers don’t yet know how low- and middle-income households will fare when eviction and foreclosure moratoriums are lifted—two economic cliffs that could impose sudden hardships on a large number of Americans. Nor is there a full picture of how this pandemic is impacting incomes yet.
The $1.9 trillion stimulus package that is currently working its way through Congress would provide significant support to incomes for low- and middle-income families. President Biden’s package includes enhanced Unemployment Insurance that will help sustain these families through the recovery, stimulus checks that will help them pay their bills now and will boost aggregate demand, and aid to states that will help them retain essential workers and open schools. These programs, and others included in the bill, will boost the incomes of workers outside the top 10 percent and help the economy avoid the pitfalls of the Great Recession recovery.
The BEA data on the previous economic recovery show the dangers of an inadequate policy response. Indeed, there are two specific lessons policymakers should take from the new BEA data.
First, Congress needs to pass a strong relief package and should continue to spend if economic indicators suggest that the U.S. labor market is not recovering quickly enough. After all, the overarching goal of federal policy is to get back to a tight labor market as quickly as possible and to avoid economic scarring that will permanently impact the economic prospects of the young and the economically vulnerable.
Second, these new distributional data provide actionable insights on how families fare during recessions and recoveries. To manage an effective recovery, Congress and the Biden administration need to understand how the economy is functioning in real time.
Right now, we are largely reliant on imperfect indicators that only hint at how families are faring. Policymakers know unemployment is up and aggregate Gross Domestic Product is down. But if the administration and Congress had access today to the kind of disaggregated statistics from the BEA running through 2018, then they could act with full knowledge of who was hurt most by the recession and who is being left out by the recovery.
Just imagine if federal policymakers could know in detail now just how incomplete the recovery from the current recession is today. If they did, then they could consider further economic stimulus with a clear target for how much stimulus is needed and how it should be targeted. Alas, policymakers are always seeing the economy imperfectly because data are often not available until long after the fact.
Piloting the U.S. economy through recessions and recoveries will be easier if policymakers know how the economy is faring for different kinds of families across levels of income, geography, race and ethnicity, and gender. Work by the BEA, the U.S. Department of Labor’s Bureau of Labor Statistics, and the U.S. Census Bureau to provide more granular economic data series should be considered an essential part of our economic crisis toolkit and funded accordingly.
Appendix
A note on data-analysis methods
The BEA data series provides total shares of Personal Income for each income decile of U.S. households. It reports, for example, that the bottom decile held 2.17 percent of all Personal Income in 2018. From this, it is easy to calculate growth rates for the various deciles, but there is no population adjustment. Because the dataset uses households as the unit of analysis (BEA starts with the Current Population Survey, which surveys households), I adjusted for the number of households in the economy to create Figure 1.
This “population” adjustment does not necessarily lead to a data series that closely tracks the per capita Personal Income series. Households sometimes grow faster or slower than the overall U.S. population does. Over the years analyzed in this issue brief, households generally grew faster than the population, leading to lower rates of growth across the board. Per capita Personal Income shows much stronger income growth in the aftermath of the Great Recession than my per household measure does, for example. In other years, the effect is reversed: The Great Recession was deeper in per capita Personal Income than in per household Personal Income.
To create Figures 3 and 4, I used Household Income rather than Disposable Personal Income, because it is easier to reconcile this measure with the distributional tables that the Bureau of Economic Analysis provides. At the recommendation of the agency, I did not adjust for household growth in these figures.
Notably, the BEA dataset is cross-sectional rather than panel. That is, when it refers to the top 10 percent, it does not mean the same group of people in each year but rather the 10 percent of people in the U.S. economy who happen to have the highest incomes in that particular year. In a given year, a large number of people may move up or down the distribution and find themselves in new groups.