GDP 2.0: Measuring who prospers when the U.S. economy grows

This post was updated on July 11, 2023.
Gross Domestic Product, or GDP, is the constant go-to economic indicator that news anchors and U.S. Members of Congress alike love to dissect. Reading quarterly reports from the U.S. Department of Commerce’s Bureau of Economic Analysis on GDP growth is a form of divination that, in popular imagination, tells us whether the economic fortunes of the United States are trending up or down. Strong GDP growth is considered evidence of good fortune for all Americans under the presumption that “a rising tide lifts all boats.”
This presumption is mistaken. Aggregate GDP growth may once have indicated good fortune for most Americans, but over the past several decades many Americans have been left behind as growth increasingly tilted toward the rich. This reality makes GDP a misleading statistic for the opinion leaders and politicians who rely on it. The consequence is that policymakers’ diagnoses of the U.S. economy, and their prescriptions for what ails it, are based on the wrong metric.
The good news is that the data and the statistical know-how are now available to fix the problem. The Bureau of Economic Analysis, or BEA, now publishes its Distributing Personal Income data series, which reports on income growth for every decile of income and the top one percent. This data set is still considered a prototype by the agency, but with further investment and refinement, these statistics will allow policymakers to evaluate how the U.S. economy is performing for the working class, the middle class, and the affluent.
GDP 2.0 is Equitable Growth’s name for accounting for inequality in the national accounts, a project that the Bureau of Economic Analysis is now executing on in its Distributing Personal Income prototype series. This prototype data makes it easy to see, for the first time, how the U.S. economy is performing for those at the bottom, middle, and top of the income distribution. Although BEA’s current dataset is an excellent start, there is more to be done.
The current BEA Distributing Personal Income prototype series has a number of excellent features, including a breakdown by types of income and metrics for income before taxes and transfers as well as after taxes and transfers. But for this prototype to become the go-to economic growth metric it needs to replicate more features of the aggregate GDP metric, which became a standard of policy debate because estimates are frequent, timely, and elevated in major agency news releases.
GDP 2.0 will have a significant impact on how U.S. economic policy is discussed and what economic policy is implemented. Specifically, it will:
- Connect the idea of aggregate economic data with the real-life circumstances of families in the economy
- Focus the attention of the nation on improvements in the economic well-being of families, which is what growth is supposed to deliver
- Guide policymakers in designing policies that produce broad-based growth
- Allow citizens to hold their elected representatives accountable to delivering an economy that works for all
This column explains why standard GDP growth is insufficient for understanding our modern economy, why measurement is an important first step for better economic policy, and the current status of progress toward GDP 2.0. It concludes with suggested actions that both Congress and the executive branch could take to make GDP 2.0 a reality. These are:
- Congress should continue to fully fund this work at the Bureau of Economic Analysis.
- Congress should pass a data synchronization bill to expand BEA’s access to IRS tax return data.
- The U.S. Department of Commerce should request funding to expand and improve the current BEA data series so it can leave the prototype phase of development.
- The Bureau of Economic Analysis should attempt to improve the timeliness of the data. Currently, it is released annually on about a one-year lag. Sub-annual releases and lower reporting lags should both be investigated.
Who benefits from economic growth?
The National Income and Product Accounts were devised in the 1930s, the result of a concerted effort by many economists to better quantify economic output. Simon Kuznets was primarily responsible for their development in the United States and later won a Nobel Prize in economics in 1971 for his work. Gross Domestic Product, a part of those accounts, was a tool well-adapted to the economic problems of the mid-20th century United States. It allowed economic policymakers to understand the vast depth of the Great Depression and highlighted the need for bold action. Similarly, it served as a guide in World War II, providing some indication of how many planes and boats and tanks we might plausibly manufacture if the full resources of the nation were focused on the task.
These are no longer the only economic questions the nation needs answered. In an era where inequality has swelled to levels approaching the Roaring Twenties, elected officials need to know who is prospering from economic progress so they can manage the economy for broad-based growth that benefits all Americans. This need is acute now, because headline GDP growth has become unmoored from the economic fortunes of many Americans.
Growth was more equitably distributed between 1963 and 1979 than it is today. Back then, Americans in the bottom 50 percent of the income distribution tended to see the strongest income growth, and other households saw fairly similar levels of growth at a lower level. Starting around 1980, this relationship began to change. In the decades since 1980, most Americans have seen growth in their own incomes that is below GDP growth, and the distribution has become much more uneven. This is possible because the most affluent Americans have seen very high income growth over this time period, which boosts the average. (See Figure 1.)
Figure 1
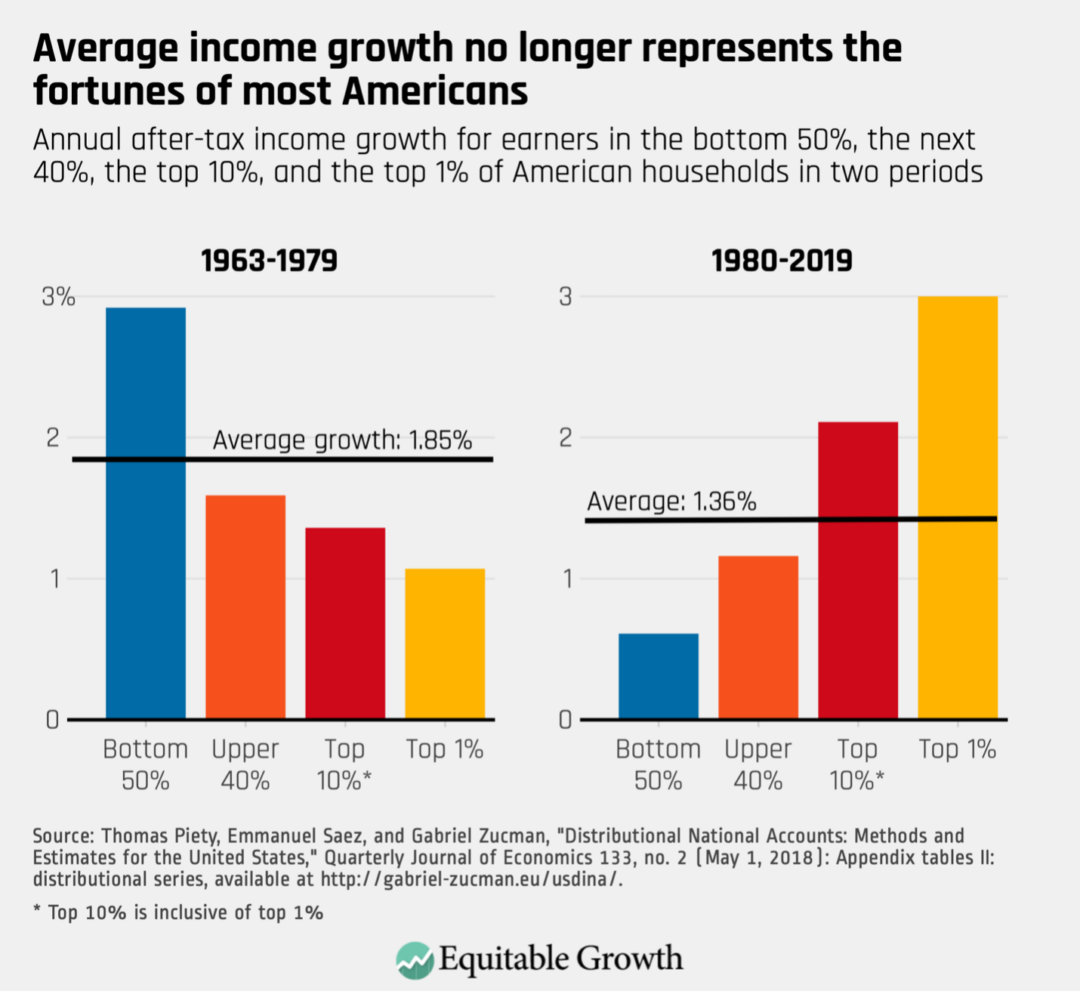
This divergence between the average and the actual fortunes of families is a problem Kuznets warned about in one of his very first publications about national accounts. In a section of his 1934 report to Congress titled “Uses and Abuses of National Income Measurements,” he noted that, “Economic welfare cannot be adequately measured unless the personal distribution of income is known,” and concluded, “the welfare of a nation can, therefore, scarcely be inferred from a measurement of national income.”
This divergence makes GDP increasingly misleading as a guide to public policy: It does little good to target GDP as an outcome if most GDP growth flows to a small group of families, leaving the rest with scraps. Despite this, politicians continue to fetishize GDP growth, and pundits encourage them. The Trump administration made a campaign issue out of targeting 3 percent growth and sometimes promised to achieve much higher growth.
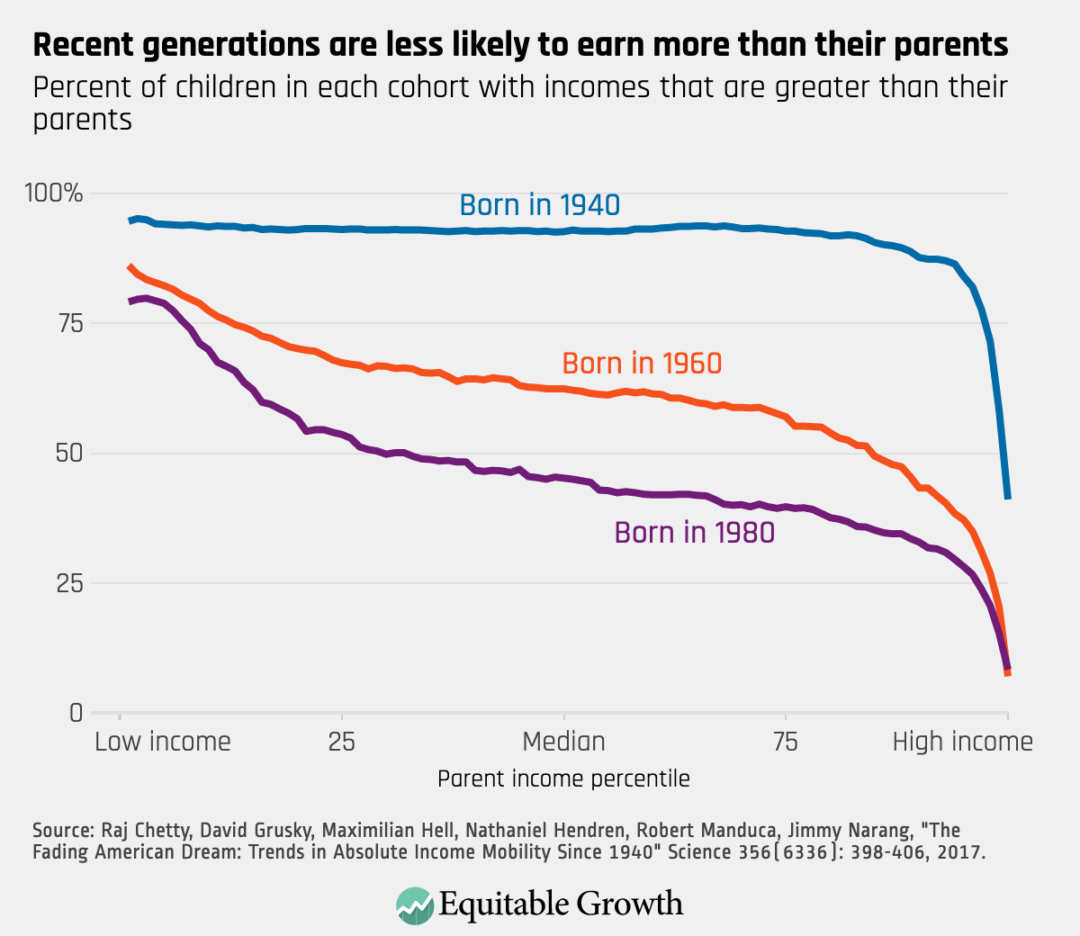
The pattern of growth shown in Figure 1 has serious downstream consequences. To take just one significant example, Harvard University economist Raj Chetty and his colleagues have demonstrated that absolute intergenerational income mobility has declined precipitously in the United States, and that two-thirds of this decline can be attributed to unequal patterns of growth.
Chetty and his co-authors find that children in the United States used to have a 90 percent chance of earning more than their parents did, comparing parents at age 30 to children at age 30. But by 1980, the chances had dropped to just 50 percent. This is partially due to lower average growth in the decades since 1980, but Chetty’s research finds that it is primarily caused by most income growth accruing to the high end of the income distribution. (See Figure 2.)
Figure 2
Measurement molds policy and steers public debates
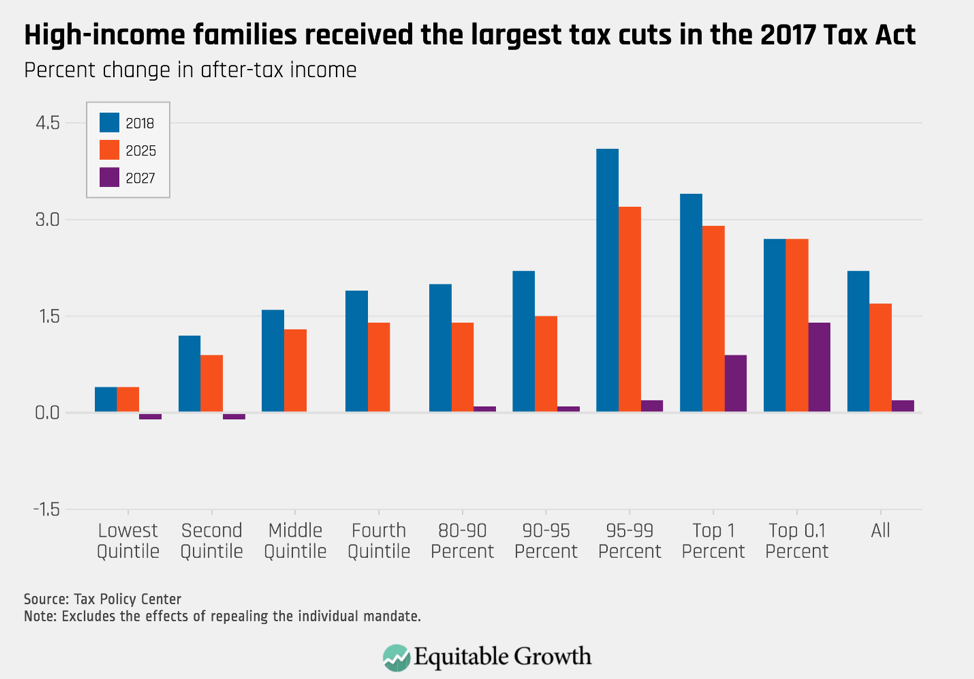
The measurements at the center of national policy debates affect both what policies are discussed and what policies are adopted. A central conceit of many recent policy battles is that growth is an unalloyed good, worth targeting without regard for other considerations. The Tax Cuts and Jobs Act of 2017 was sold on exactly these grounds by its primary proponents.
But claims about economic growth are nearly useless without the relevant context that most growth in the modern U.S. economy accrues to the highest income earners in society. With that bit of context, it becomes difficult to understand why policymakers should be targeting growth at all. Surely we should instead look at distributional tables that tell us how people in particular income brackets will be affected by the tax, as Equitable Growth has advocated.
Indeed, trumpeting the impact of the Tax Cuts and Jobs Act on growth only serves to obscure what the distributional table shows: The law will raise the incomes of the wealthiest Americans and will do little for those at the bottom between now and 2027. (See Figure 3.)
Figure 3
Importantly, political scientists find that our headline economic indicators have a big impact on economic narratives. These narratives mislead people about the strength of the U.S. economy. In a 2020 working paper published by Equitable Growth, a team of political scientists find that the overall tone of economic news is driven entirely by the fortunes of the top 1 percent of income earners. Alan Jacobs of the University of British Columbia, J. Scott Matthews of Memorial University, Timothy Hicks of the University College London, and Eric Merkley of the University of Toronto tracked dozens of print newspapers over several decades. They isolated economic reporting and used text analysis to find the overall tone of economic news, positive or negative.
They find that economic news is positive when the very richest members of society are faring well. Yet the tone of the news is not correlated with the fortunes of anyone else. This is not the fault of journalists. The researchers find that journalists rely on aggregate measures such as GDP to ascertain the health of the economy, and GDP no longer follows the fortunes of the average American.
Targeting a common, available metric without adequate consideration of context can lead people down strange paths. An often-repeated example is US News & World Report’s annual Best Colleges rankings. These ratings so dominated the public imagination that colleges became obsessed with improving their ratings. Since the ratings were based on a small set of measurable outcomes, such as graduation rate, class size, and admissions selectivity, colleges quickly found ways to improve their ratings by changing their practices.
Baylor University, for example, offered financial incentives to freshmen to retake the SAT, raising their incoming class average and their ranking. Multiple colleges gave falsified data to US News. Some schools hired their own graduates to boost graduate employment metrics. These and other attempts to game the system forced US News to rethink how they compile the statistics, but problems persist.
This college rankings example shows that measurement shapes outcomes. The metrics that are collected shape the policy options that elected officials consider. The political science research cited above shows that economic narratives in the media are likewise shaped by the available indicators. The U.S. economy has changed enormously since Kuznets first devised the National Accounts in the 1930s. Managing our complicated modern economy requires more context. It requires GDP 2.0.
GDP 2.0: Measuring who prospers when the U.S. economy grows
Academic economists have already provided a working prototype of what GDP 2.0 might look like. Thomas Piketty at the Paris School of Economics, and Emmanuel Saez and Gabriel Zucman, both at the University of California, Berkeley, have published a public dataset they call Distributional National Accounts that uses U.S. tax data to measure the distribution of income in the United States from 1962 onward. Some of the charts in this column use their dataset. Recently, they launched Realtime Inequality, a website that provides estimates that are only a couple of months old on a monthly basis.
But academic datasets are not a long-term solution for the problem. Government statistics are produced on reliable schedules, using standardized methodologies and the best available data. A distributional measure of growth presented alongside the headline GDP growth number would make the report more meaningful to American families who are not currently well-represented by overall GDP growth.
A government-produced dataset is necessary, and the Bureau of Economic Analysis is now producing prototype statistics that break down income growth in the Personal Income national account. The agency has now released statistics showing how personal income growth was distributed between 2000 and 2021. These statistics are already a powerful tool for examining changes in inequality over the past two decades. The BEA’s data includes breakdowns of income growth for each decile of income and the top 1 percent.
Additionally, the Bureau of Economic Analysis reports how incomes are divided between wages, business income, rental income, asset income, and government transfers. This added dimension is useful for analysis. My analysis, for example, decomposing gains in income for the bottom 50 percent of households since 2007 shows that about half of this group’s gains came from increased transfer payments, such as the Earned Income Tax Credit and Child Tax Credit, but especially thanks to the enactment of the Affordable Care Act in 2010. (See Figure 4.)
Figure 4
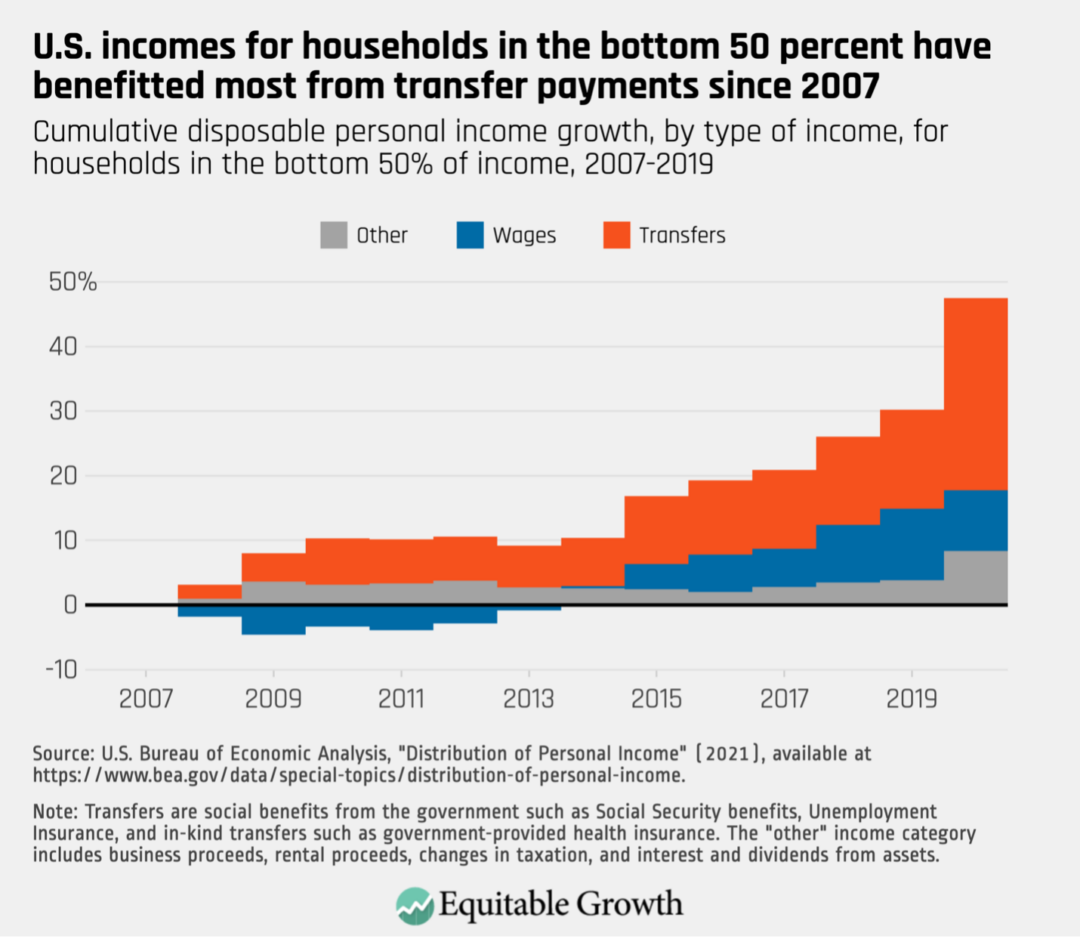
Figure 4 details that wages accounted for only about 36 percent of gains for this group, suggesting that without government intervention, inequality would have progressed significantly faster. This analysis is useful for forecasting as well. Transfer payments will not continue to expand due to the Affordable Care Act, so absent other new transfer programs, this group may see their fortunes decline in the near future.
Although the BEA data series is already a notable addition to our federal data infrastructure, it can be further improved. Most notably, the data is currently released at a relatively slow pace compared to other national accounts statistics. Distributing personal income is produced once annually, in December, with about a one-year time lag. Provisional 2021 statistics, for example, were released in December of 2022. Prior to 2022, the lag was two years, so BEA has made some progress.
Yet statistics such as aggregate GDP growth and Personal Income growth, which the new BEA data series is based on, are released much faster. These accounts are released quarterly, and lag the quarter they are reporting on by only one or two months in most cases. Although there are data and methodology challenges, there are methods of reducing production time that the agency could explore now.
More work remains to fully implement GDP 2.0
Indeed, although BEA’s prototype is an incredibly important first step, more needs to be done. Both congressional and executive branch action can improve implementation.
Congressional action
In 2022, Congress fully funded the Biden administration’s request for $2.7 million to improve the distributing personal income dataset. Congress must continue to fund the Bureau of Economic Analysis at current levels or higher so that the agency can devote resources to this new initiative. Currently, the dataset is maintained by just two BEA economists. In order to move out of the prototype phase, the agency will require robust funding from Congress.
Congress should also pass a data synchronization bill. Data synchronization is a proposed policy that would allow BEA to receive additional tax data from the IRS. These data would assist BEA broadly in providing timely and accurate economic reporting. They could help BEA make the distributing personal income dataset more accurate by allowing BEA economists to better account for very high incomes.
Executive branch action
The U.S. Department of Commerce should continue to request funds for the Bureau of Economic Analysis from Congress to produce this distributing personal income data series. Commerce should pair this request with concrete plans for the enhancement of the product. BEA should use funds to explore ways to improve the timeliness of the current data series. If currently available data sources are inadequate, BEA and Commerce should detail improvements to our statistical data infrastructure, such as larger survey samples or more frequent survey administration, which would make greater timeliness possible and present those plans to Congress.
The metrics that policymakers use to evaluate the U.S. economy are reflective of what type of success we, as a nation, value. If realizing the promise of the American Dream is important, then adopting GDP 2.0 will align our economic policies with our values. Adding this crucial context to our National Income and Product Accounts is not just a bookkeeping exercise. It’s a way to set new economic goals and guideposts. Without these guideposts, we cannot achieve strong, stable, and broad-based economic growth.