New digital tools demonstrate the promise of measuring well-being in the United States

This summer, the Washington Center for Equitable Growth partnered with New America, the Justice, Health & Democracy Impact Initiative at Harvard University, and the U.S. Departments of Commerce and the Treasury to lead a sprint with The Opportunity Project, a U.S. Census Bureau program that leverages open data to solve challenges facing the nation. Through a 14-week technology development sprint, nongovernmental solutions teams worked with federal data stewards to build digital tools that measure household and community well-being in new and more accurate ways.
Our collaboration was motivated by the continuous challenges to individual and shared well-being in the United States in recent years. The forces of a global pandemic, an intensifying climate crisis, and persistent racial and economic inequality have exposed vulnerabilities in U.S. social and economic systems that can be attributed in large part to our single-minded focus on growing Gross Domestic Product at all costs.
Some of the downsides of GDP are well-understood. For example, GDP, as an aggregate statistic, does not account for who is actually benefiting from economic growth. And economic growth that accrues mostly to the top of the income distribution is of little use for most U.S. households. When those at the bottom don’t share in the fruits of economic growth, they are left vulnerable to recessions, pandemics, and natural disasters.
But GDP has many other blind spots. The COVID-19 pandemic, in particular, demonstrates that overall economic success alone is insufficient for protecting the health and well-being of a nation’s citizens. While the quality of data on COVID-19 deaths by country varies, GDP per capita does not appear to be a predictor of fewer COVID-19 deaths. If anything, it may be positively related to deaths.
A country’s ability to cope with a future pandemic or the reality of climate change will ultimately require more than wealth. Building resiliency and sustainability into the economy and our communities can help. Ultimately, nations that prioritize short-run economic growth at any cost might be trading a resilient, healthy economy over the long run for temporary benefits now—a kind of economic sugar rush.
Measuring noneconomic markers of people’s well-being may also help us learn more about the relationship between economic success and the happiness of a nation’s residents. For instance, the Social Progress Imperative’s Livable Cities Tool—one of the digital products that was produced during this summer’s Opportunity Project sprint—shows that while economic and noneconomic well-being are correlated, some cities buck this trend, with these residents enjoying strong well-being despite fewer economic resources. These places provide intriguing examples of how governments can create policies that support human flourishing when resources are limited.
This column briefly explores the reasons many countries and places are starting to explore well-being measurement. It then details the four prototype tools that were developed in The Opportunity Project sprint that we led in concert with the U.S. Departments of Commerce and the Treasury.
Exploring metrics for well-being
The metrics of success that are commonly referenced in policy debates—such as GDP, unemployment, wage growth, and others—do not divulge much information about the traits that communities need to weather significant crises. They don’t tell us, for example, if residents of a nation have strong support networks, access to healthy food or public transportation, and other resources that could help them weather hardship.
Increasingly, research shows that these noneconomic metrics may have significant benefits for society. Many well-being frameworks, for example, try to capture the level of social connection between people within a community. Economists are increasingly realizing that noneconomic metrics such as these are, in fact, related to income, mortality, and a variety of other important life outcomes. A society with better well-being along these lines may be setting itself up for stronger long-run growth as its citizens build more human capital, are more productive, and live longer, healthier lives.
As such, some nations and intergovernmental organizations are starting to invest in developing well-being metrics that can be used to improve policymaking and identify areas of concern in communities. The United Kingdom’s Office of National Statistics, for example, now publishes regular updates on quality of life in the UK. New Zealand issues a well-being budget that directs investments around the nation with the goal of improving targeted areas of well-being. And the Organisation for Economic Co-operation and Development has launched its own Better Life Index, which rates and ranks member countries in 11 different well-being categories, both economic and noneconomic.
The United States does not have any formally agreed-upon, whole-of-government measures that align with various dimensions of well-being. It also lacks an official means to track household and community well-being. Yet there are a handful of promising efforts that indicate a potential shift in the coming years.
One such effort is the recently released Federal Plan for Equitable Long-Term Recovery and Resilience—a whole-of-government approach to the vital conditions for thriving people and places. This project has the potential to act as a bridge between a focus on resilience and broader well-being efforts. Additionally, some U.S. localities have started to adopt well-being indices, such as Santa Monica’s Wellbeing Index.
This paucity of data collection initiatives in the United States was part of the inspiration behind The Opportunity Project’s 14-week technological development sprints this summer. The prototype tools that came out of the exercise represent new and innovative ideas for how the government can measure well-being in the United States more accurately than GDP suggests.
Outcomes from The Opportunity Project’s 14-week sprint
Together, our sprint leadership team—compose of the Washington Center for Equitable Growth, New America, the Justice, Health & Democracy Impact Initiative at Harvard University, and the U.S. Departments of Commerce and Treasury—recruited four teams of technologists and data scientists, a team of cross-discipline expert advisors with deep knowledge and practice in the area of well-being measurement, and a dozen community leaders as user advocates, who were interviewed and consulted by solutions teams about their lived experience and perspectives on well-being.
Teams were tasked with using federal open data to build new digital tools, and we recruited 20 data stewards from across 14 federal government agencies to advise teams on the possibilities and gaps within existing data. Altogether, we identified 61 data sources across federal data and other relevant data sources spanning dozens of domains of life: the economy, community demographics, health, housing, transportation, education, crime, and more.
As part of The Opportunity Project, teams created public-facing digital tools that can help policymakers understand well-being in their communities and better utilize federal data to advance local well-being. All the teams are still developing and improving these tools, working to empower communities to better understand how decision-makers can lead with well-being in mind.
The products created by the four teams are the Economic Vulnerability Dashboard, the Wellbeing Infrastructure Tradeoffs Tool, the Livable Cities Tool, and the City Builder platform. Each is described in detail below.
Economic Vulnerability Dashboard
United for ALICE created the Economic Vulnerability Dashboard, or EVD, to help identify where it is hardest for asset-limited, income-constrained, employed, or ALICE, families to live and where there is the most support. (See Figure 1 for a preview of what the tool looks like.)
Figure 1
The Economic Vulnerability Dashboard identifies communities that offer more and less support for vulnerable families
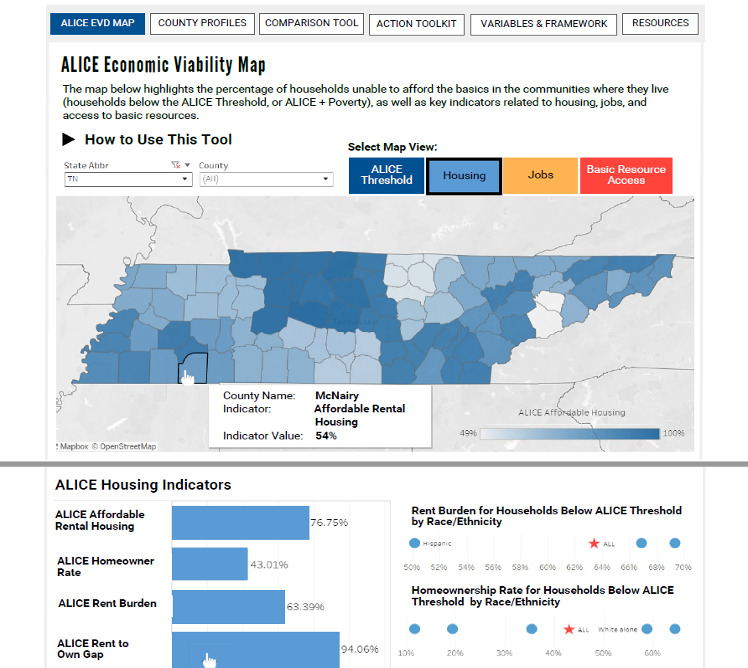
The dashboard quantifies local gaps in housing, jobs, and basic community resources in each area. To understand the geography of vulnerability and disaggregate indices that could conceal vulnerability, the dashboard utilizes comparisons between measures to map these gaps. It also generates profiles for individual communities and provides an action plan for addressing deficiencies in any particular indicator.
Wellbeing Infrastructure Tradeoffs Tool
A collaborative team led by the Full Frame Initiative developed the Wellbeing Infrastructure Tradeoffs Tool, or WITT. With the goal of empowering communities themselves to pursue “shovel-worthy rather than shovel-ready” infrastructure projects, the tool was created to identify trade-offs in city planning processes and ensure an inclusive and representative public feedback process. (See Figure 2 for a preview of what the tool looks like.)
Figure 2
The Wellbeing Infrastructure Tradeoffs Tool empowers communities to gather feedback on how potential infrastructure projects will impact residents
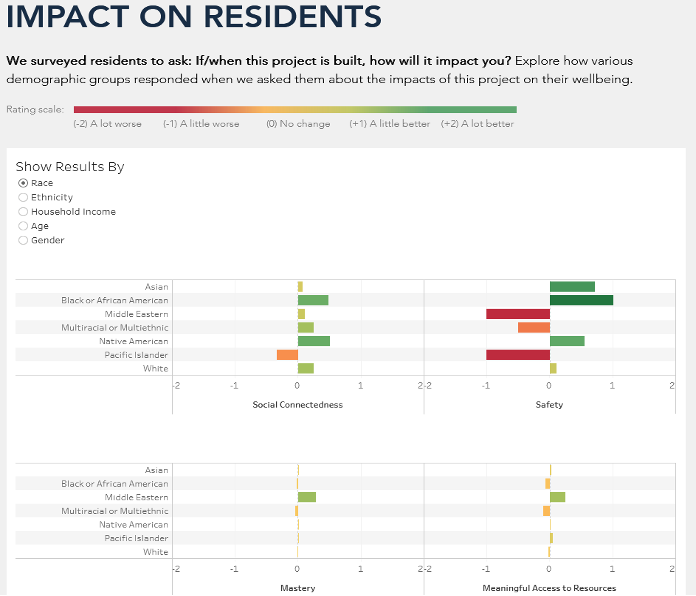
The tool integrates participatory data from impacted community members, verifies representation to ensure populations are not over- or undersampled, and provides insights on how different populations—such as racial or socioeconomic subgroups—perceive the impact of the project on well-being differently. It also provides a map of community assets, such as parks and public facilities.
Livable Cities Tool
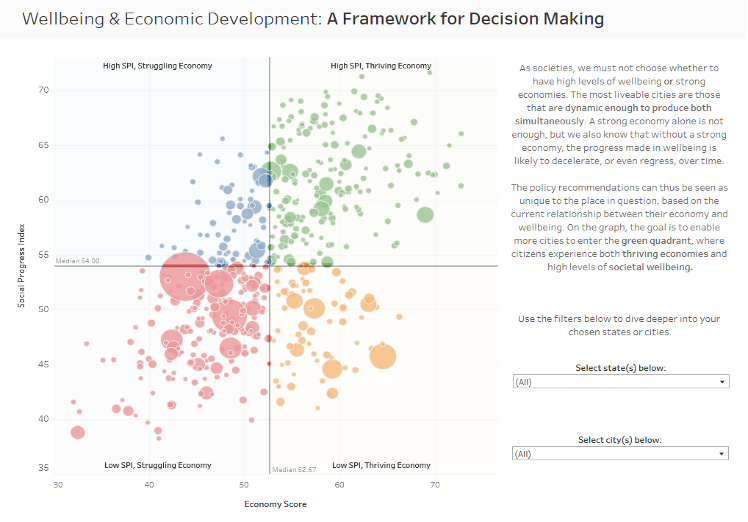
The Social Progress Imperative and its partners built the Livable Cities Tool to help communities link economic conditions to social outcomes, identify and learn from peer cities, and facilitate informed decision-making. In addition to geospatial overlays for 67 different well-being indicators, the heart of the tool is a framework for decision-making and city-specific scorecards to understand the well-being of a city’s constituents—especially the relationship between social and economic indicators—and identify opportunities for areas for investment and improvement. (See Figure 3 for a preview of what the tool looks like.)
Figure 3
The Livable Cities Tool links cities’ economic conditions and social outcomes to improve decision-making by local government officials
City Builder platform
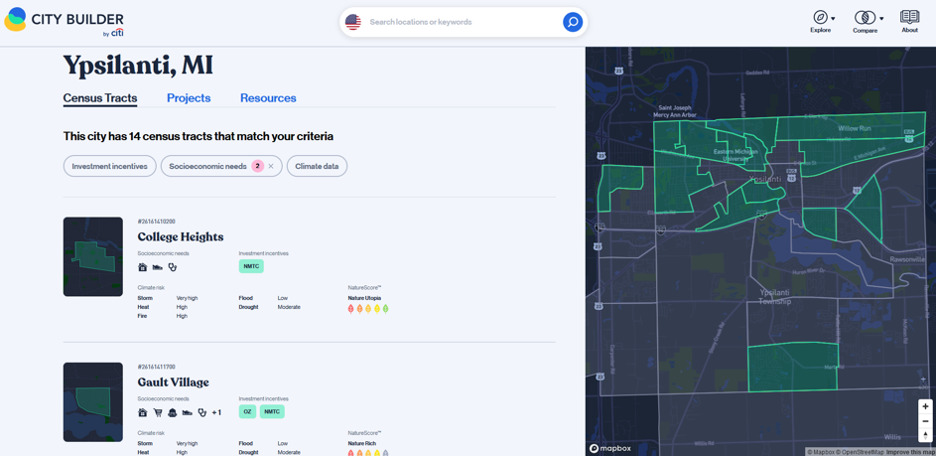
While already an established tool, Citi Ventures’ City Builder platform used the sprint as an opportunity to evaluate how information about community and resident well-being is communicated to stakeholders interested in place-based investing. By adding additional measures of well-being and information on how the indicators have changed over time, City Builder aims to empower users to better understand well-being within a community. (See Figure 4 for a preview of what the tool looks like.)
Figure 4
The City Builder data platform helps users learn about localities where they might want to make place-based investments
Significant challenges to reporting on well-being remain
While The Opportunity Project sprint generated impressive tools that communicate and promote well-being in new ways, the experience also highlights the significant challenges to deploying well-being metrics more broadly.
Some of these barriers are data infrastructure challenges, such as the fact that many federal datasets are not currently updated frequently enough or don’t provide detail at the appropriate local level. There are also myriad planning questions that will require interagency cooperation to solve, including aligning on the dimensions of well-being, clearly delineating how the siloed federal statistical agencies will each contribute to the projects, and building deeper partnerships between federal and local leaders to empower communities to drive data and measurement needs as they define well-being in their particular contexts.
 post
post
Economic research is increasingly finding that communities where residents have strong social connections, access to built and natural spaces that foster mental and physical health, and opportunities to learn and grow throughout their lives can play an important role in fostering economic growth and resilience. We hope the data projects from this Opportunity Project sprint can serve as useful prototypes for federal and local policymakers who are thinking about the broader implementation of well-being metrics.
– Elizabeth Garlow is a senior fellow at New America. Austin Clemens is the director of economic measurement policy at the Washington Center for Equitable Growth. Tony Guidotti is the Justice, Health, and Democracy fellow at the Edmond and Lily Safra Center for Ethics at Harvard University.