Structural racism and the coronavirus recession highlight why more and better U.S. data need to be widely disaggregated by race and ethnicity
Overview
The enduring legacy of structural racism in the United States is not news to the multihued communities of color across our nation. And in these Black, Latinx, Native American, Asian American, Native Hawaiian, and Pacific Islander communities, it comes as little surprise that many of these communities are suffering and dying more from the novel coronavirus and COVID-19, the disease caused by the virus, or that many also are bearing the greater brunt of the job losses and income declines amid the coronavirus recession.
The public health crisis today is especially acute among these communities of color. Black Americans, for example, are dying from COVID-19 at about 1.5 times their prevalence in the U.S. population. Latinx communities are suffering much higher rates of infection. Native Americans living on reservations are dealing with outsized outbreaks of the coronavirus and COVID-19.
In many communities of color, workers and their families, are more likely to be employed in lower-paying jobs with fewer benefits such as paid sick leave and often in jobs on the front lines of the current pandemic. And heightened levels of respiratory disease leave many of these individuals more likely to be infected by the coronavirus—respiratory ailments that are largely attributable to systemic racism that results, for example, from polluting industries and power plants sited in neighborhoods of color. Despite these facts, in the early days of the pandemic, most states were not reporting infections and fatalities by race. Thanks to the efforts of academics and policymakers who sounded the alarm early, racial breakdowns of coronavirus’s effects are now widely available.
Then, there are the already wide economic divides in homeownership, income, and wealth between Americans of color and White Americans, which may be growing wider due to the convergence of these crises in 2020. Add in the enduring police killings of unarmed Black victims—also no surprise to Black Americans—and the ensuing protests are now drawing the acute attention of our nation on the many ways that systemic racism persists in the modern-day United States.
Discrepancies in economic outcomes by race and ethnicity have long been known, but the coronavirus recession is putting a spotlight on the unique ways that the U.S. economy fails these groups amid economic downturns often further marked by racial repression. Alas, this spotlight is not matched by the collection of widely disaggregated data by race and ethnicity by federal government statistical agencies. And, as a result of attention garnered by the ongoing police killings of Black Americans, more data are likely to be demanded on issues of systemic racism in our society, just as the coronavirus recession is sparking new data-gathering demands.
This issue brief details the steps Congress and executive branch agencies can take to improve our understanding of economic and social outcomes for all communities of color. There are many ways the economic statistical agencies could improve data collection, provide more analysis of racial economic divides, and alter the presentation and publication of statistics to better inform policymakers on the needs of marginalized communities. This issue brief focuses on three concrete policy actions that could be taken now with a focus on oversampling in existing federal surveys:
- Provide funding for the U.S. Census Bureau and the U.S. Bureau of Labor Statistics to perform an oversample of Black, Latinx, Native American, and AANHPI populations, and to provide cash incentives to respondents if necessary, in the monthly Current Population Survey and the Annual Social Economic Supplement
- Request that the Federal Reserve consider oversampling Black, Latinx, Native American, and AANHPI populations in its Survey of Consumer Finances
- Direct the Government Accountability Office to study the feasibility, desirability, and cost of instituting oversamples for these groups in other surveys conducted by federal statistical agencies
Our current socioeconomic state of affairs is bleak, but it is no worse in aggregate than what so many communities of color have faced for generations. Current statistical surveys already show clear divides in unemployment rates and income levels by race and ethnicity across our nation, with the aggregate metrics indicating that many Black Americans live in a nearly permanent recession, and that overall, communities of color experience more frequent and prolonged periods of recession. By providing the means to more finely disaggregate data, policymakers can better understand the consequences of structural racism and the coronavirus recession today so that they can design policies that result in more equitable economic recovery attuned to the specific needs of all Americans.
Better data on communities of color are important to socioeconomic research and policymaking
The Current Population Survey and the Annual Social Economic Supplement, or ASEC, play a critical role in economic research. The monthly CPS is the foremost survey for understanding labor attachment (economic parlance for workers’ engagement in the jobs market) and is available at a higher frequency than most other surveys. The ASEC supplement to the Current Population Survey is the most commonly used source of income data for many researchers and includes much more detailed income reporting than the U.S. Census Bureau’s annual American Community Survey. And the Federal Reserve’s Survey of Consumer Finances is the most commonly cited survey for the measurement of wealth in the United States and the primary source of data on the Black-White wealth divide.
But the sample populations of these surveys do not support analyses of racial and ethnic segments of the population by age, gender, or geographical location without significant error. Oversampling is a survey technique where certain populations are sampled at a comparatively high rate, compared to their prevalence in the population, so they are overrepresented in the final survey sample. Oversampling communities of color can aid in uncovering the different economic and social experiences of Americans of different demographic groups by providing a granular view of key economic variables—and taking into account generational changes within these communities over time as well.
Oversampling for these data will also help target ongoing policy needs. The Coronavirus Aid, Relief, and Economic Security, or CARES, Act of 2020, for example, provided more than a trillion dollars in rebates alongside Pandemic Unemployment Assistance that proved pivotal to helping low-income households survive the first wave of the coronavirus recession while keeping the U.S. economy running. This aid was crucial, but the money could have boosted the economy even more strongly if we had the data to target it more efficiently.
Oversamples of particular racial and ethnic groups are a cost-effective way to make the analyses of small U.S. subpopulations viable in these surveys. Increasing the sample size of these surveys indiscriminately would inflate their costs and provide still more detail on populations that are already well-covered. Oversamples allow researchers and policymakers alike to zoom in on subpopulations whose economic experience is not well-represented by the aggregate data and learn more about the specific ways some groups are being left behind in our economy.
Disaggregated data shape how we view and manage the economy
The data that federal agencies choose to collect and the ways in which they release that data can have significant impacts on economic narratives and economic policymaking. As Rhonda Sharpe of the Women’s Institute for Science, Equity and Race writes, “If the data are collected and reported without taking a true diversity of experiences into consideration, it can’t be used to create a more inclusive society.”
Earlier this year, Equitable Growth published a working paper that finds the tone of economic news is uncorrelated to the fortunes of the bottom 90 percent of income earners, after controlling for income changes among the top 10 percent. The researchers blame this elitist tone on the outsize emphasis that reporters place on aggregate GDP growth, which does not represent the fortunes of most Americans and yet is released frequently and widely regarded as perhaps the most important economic indicator.
To the credit of the federal statistical agencies, many of their most notable economic releases provide racial breakouts. The Census Bureau’s Income and Poverty report, for example, provides extensive disaggregation by race. And the Bureau of Labor Statistics’ monthly Employment Situation Report provides White and Black unemployment figures alongside overall unemployment in the press release.
But there are limits to the existing data. Although these and other current surveys are sufficient for gleaning disaggregation by race and often for deciphering the intersection of race and gender, the data on smaller subgroups come with large amounts of uncertainty. Users may want to look at race at the intersection of occupations and industries, for example, or at subgroups within race groups that experience particularly poor labor market outcomes, such as young Black males. The appendix at the end of this brief gives some examples of the level of error that analysts face when working with some of these subgroups in the Current Population Survey and Survey of Consumer Finances.
The case for oversampling in surveys
Survey data are incredibly important sources of information for academics, the policy community, and journalists alike. In addition to their distribution by federal agencies, large surveys like the CPS and the SCF power public resources like the Prosperity Now Scorecard and PolicyLink’s National Equity Atlas, which provide invaluable snapshots of economic progress across geography, race, gender, and other demographic groups.
But surveys suffer from a significant drawback for analysts who want to study subgroups of the population. Sample sizes in most surveys are insufficient for disaggregation of subgroups of the population. Oversampling in these surveys would make it possible for analysts to study a much wider array of outcomes for subgroups of workers and communities from the Black, Latinx, Asian American, Indigenous American, Native Hawaiian, and Pacific Islander populations.
There is precedent for oversampling. The Current Population Survey’s Annual Social Economic Supplement currently features two existing oversamples: an oversample of Hispanics and an oversample of households with children under age 18, which was instituted to make it possible to reliably analyze the effects of the State Children’s Health Insurance Program at the state level. This latter oversample was instituted by Congress in 1999 in that year’s consolidated appropriations act. 42 U.S.C. § 1397ii contains the relevant language for expanding the sample and could provide a guide for implementing future expansions.
These two surveys are especially good targets for an expansion of sampling. The Current Population Survey, first administered in 1940, is the workhorse survey of economic statistics in the United States. It is one of the few surveys that is administered monthly with a nationally representative sample. IPUMS, a project of the Minnesota Population Center at the University of Minnesota, puts an enormous amount of work into standardizing CPS data between years and making it available to anyone. There are now nearly 5,000 new users per year for its CPS portal. Its users create more than 30,000 data extracts annually, according to IPUMS.
Additionally, the full microdata for the CPS survey are released by the Census Bureau about a month after the survey’s reference week, making it easy for anyone to access the survey results and perform their own data analysis. Largely through the efforts of nongovernment analysts, CPS data are a critical window into the labor force attachment and income of non-Hispanic Black workers. Its yearly rotation group schedule also provides 1 year of panel data that is rare for economic surveys.
Because it is issued monthly, CPS is the most important tool we have for understanding the impacts of recessions as they are happening. The monthly CPS is being widely used by academics right now to understand the early phases of the coronavirus recession.
Michelle Holder of the City University of New York, who literally wrote the book on economic outcomes for Black males during the Great Recession, told us that although her work showed that Black males ages 16 to 24 appear to have had the highest unemployment rate of all major sex-race-gender combinations during the early stages of the Great Recession, CPS sample sizes are too small to reliably characterize levels and trends in this group. In the Appendix, we show that 95 percent confidence intervals (statistical parlance for the likely range of an estimate) for this group can have a range of around 10 percent, compared to just a percentage point or two for the same analysis for White respondents. Analyses of racial disparities in unemployment at the state level are similarly hindered by sample sizes in the CPS and generally require averaging 3 months or more of data together.
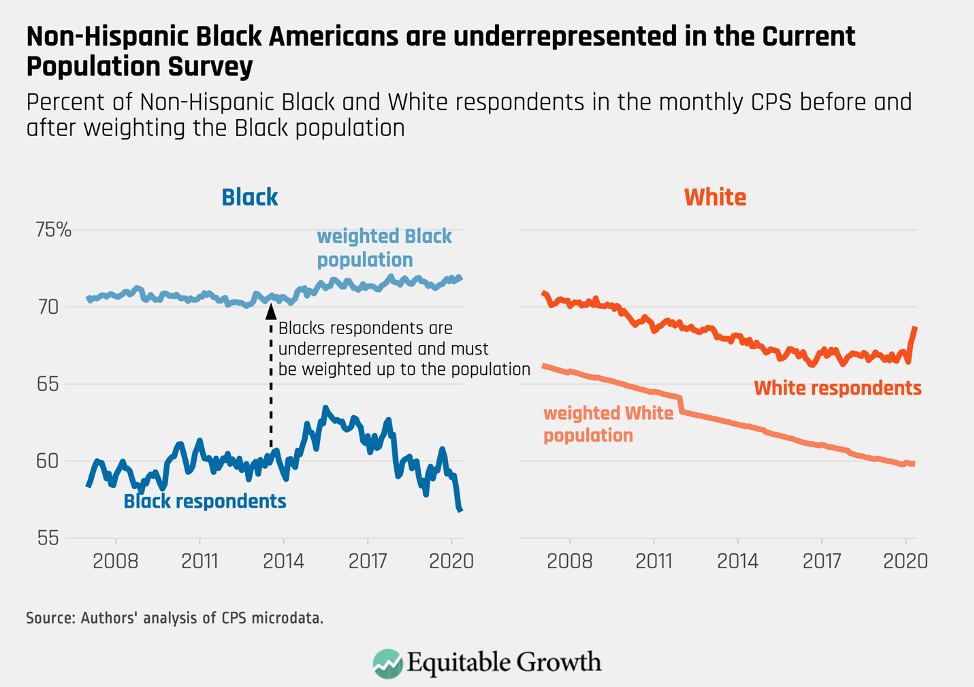
Non-Hispanic Black workers are, if anything, underrepresented in the CPS, as they now routinely represent a lower percentage of respondents to the survey than they are in the population. This underrepresentation can be even more severe for Black respondents of certain ages or education levels, making it more difficult to examine these relatively small groups. Some of these education-level and age subgroups are less likely to respond to surveys, and statistical agencies should also explore the possibility of paying respondents to fill in demographics that are not well-represented. (See Figure 1.)
Figure 1
Then, there’s the Federal Reserve’s Survey of Consumer Finances, which is conducted every 3 years. This survey is the data source for virtually all analyses of levels and trends in wealth in the United States. It is essential in helping economists and policymakers alike understand the size of the Black-White wealth divide. Just as with economic outcomes for income and unemployment in the Current Population Survey, the SCF demonstrates that when it comes to wealth, many communities of color face a very different economy than White Americans. And, in the case of wealth, the deprivation Black Americans face is based on a well-known and explicitly racist policy history.
But the Survey of Consumer Finances suffers from many of the same problems as the Current Population Survey. The SCF does have an existing oversample of high-wealth respondents, which is important because a significant amount of wealth is concentrated in a small number of households, and it is difficult to survey high-wealth households. But this is also effectively an oversample of White people, who are far more likely to have high levels of wealth.
Although measures of wealth are available in other surveys (including the Survey of Income and Program Participation, which has oversampled both Black people and Hispanics in its low-income oversample), the SCF is the gold-standard survey for understanding wealth in the United States and collects data on a much larger number of wealth categories than anything else available. Like analysis performed with the CPS, data from the SCF quickly becomes unreliable when subgroups of respondents in a single community of color are selected for analysis.
Administrative data cannot replace surveys
Economists are increasingly relying on administrative data instead of survey data for a number of reasons. Administrative data often consist of a much larger sample of people (sometimes virtually all participants in the U.S. economy) and are therefore ideal for disaggregation of small subgroups. They sometimes collect more detailed information than surveys do, may be less subject to misreporting, and, in some cases, can be observed on a very short lag at a high frequency.
But administrative data have many drawbacks. First of all, administrative data cannot replace surveys for many kinds of more immediate analysis. In the case of government administrative data, many datasets are not available until 2 years after the fact or longer. Secondly, gaining access to these datasets takes time and requires an application, which often means well-resourced researchers are advantaged by this application process. Finally, working with these datasets requires significant and uncommon data expertise. It is therefore not a viable option for many analysts.
A case in point is the IRS’s tax data, taken directly from tax returns. These data are, in many ways, the gold standard of analysis for most forms of income in the United States. But it is slow, arriving more than a year after the calendar year it documents. These data also lack racial demographics and must be merged with other sources to study race.
Private administrative data, such as credit card expenditures from banks or scheduling software data from Homebase or other human resources firms, are likewise often only accessible to a small group of researchers, either because access must be negotiated or purchased. Additionally, private administrative data often represent a particular subgroup of the population that may not be representative of all Americans.
Because both federal and private administrative data are often available only to a select group of academic economists, the researchers who can obtain access to these data resemble the demographics of the economics profession. Case in point: Just 3 percent of Ph.D.s are awarded to Black graduates, and little progress has been made toward diversity over the past two decades. If the researchers who have access to these gold-standard forms of data are largely White and male, then important perspectives on the data may be missed, especially when it comes to racial discrepancies.
Because of these pitfalls, administrative data are not a solution to the problem of racial disaggregation in surveys. Administrative data allow for the analysis of very small subgroups of the population because the reach of the data is so vast. But there is reason to believe that the researchers who have access to these data may not be as diverse as the profession at large. Expensive private datasets are not accessible to many researchers, and delays in the release of federal administrative data mean surveys are sometimes the superior tool, even when a researcher has access.
Properly resourcing statistical agencies
Instituting these oversamples will not be free, but the small investment they would require would be well worth it. The Census Bureau has requested just $67 million for the Fiscal Year 2021 collection of the Current Population Survey and the Survey of Income and Program Participation. These surveys are the backbone of our economic statistical infrastructure and are responsible for an enormous amount of academic research about the U.S. economy.
Similarly, a recent report by the Bureau of Labor Statistics suggests that fielding a new cohort for the National Longitudinal Survey would cost just $50 million over 5 years (two previous cohorts of this survey oversampled both non-Hispanic Black people and Hispanics). As The Brookings Institution notes, federal data collection is a very modest investment with enormous returns.
Unfortunately, federal statistical agencies are often seen as less important than other federal priorities and thus are frequently subject to cuts or freezes in funding. These cuts mean these agencies must conduct surveys infrequently, accept less accurate or less frequently released statistics, and, in some cases, halt certain types of economic data collection altogether.
Small investments in the statistical agencies can have outsize impacts, giving us access to new insights about the U.S. economy. Those insights can change narratives and shape policy. Instituting new oversamples in existing surveys must be matched by budget commitments that will allow the statistical agencies to adequately carry out their jobs.
Oversampling would capture disparities in the U.S. economy
Amid the coronavirus recession, continuing high unemployment and depressed consumption could take years to overcome, especially for those workers and their families who are suffering the most devastating labor market disruptions in communities of color across the nation. Although the release of the employment situation report for May 2020 contained some positive news for unemployment in aggregate, many analysts noticed that despite a dramatic recovery in employment for workers overall, unemployment for Black workers was essentially unchanged, increasing by 0.1 percentage points, a statistically insignificant change. This remarkable discrepancy occurred against the backdrop of protests over the police killings of George Floyd, Breonna Taylor, and others—protests that are highlighting anew the structural racism in our society.
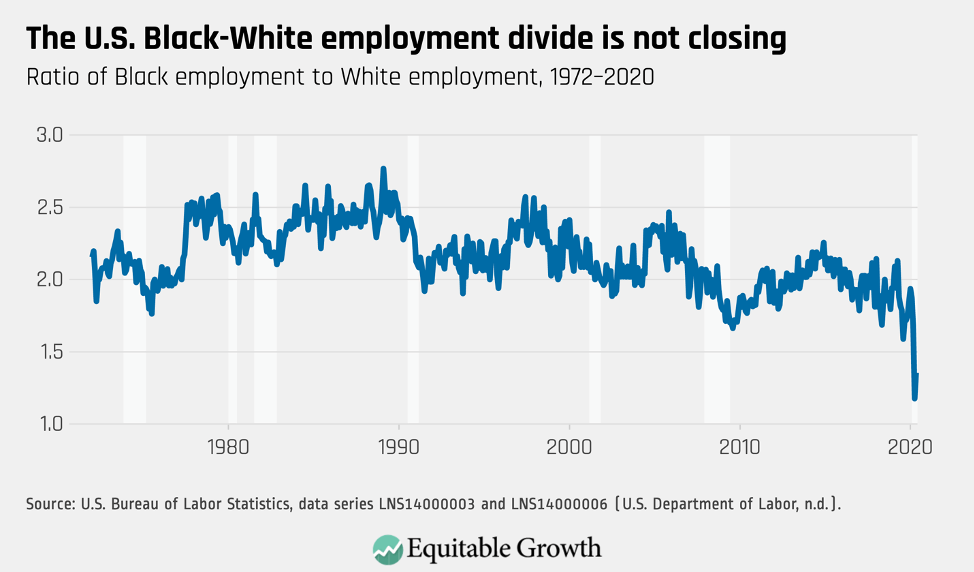
Indeed, economic outcomes for Black Americans are so consistently depressed when compared to outcomes for White Americans that virtually any economic observer can tell you right off the top of their heads what the ratio of Black unemployment to White unemployment is: about 2. This has been generally true in good times and bad since we first started measuring Black unemployment in 1972. (See Figure 2.)
Figure 2
Because Black workers are disproportionately employed in essential, face-to-face jobs—think bus driver or grocery clerk—they have fared a bit better in this recession, relative to other groups, than they have in the past. But while their jobs have been spared a bit more than usual in recessions, their lives are more likely to be on the line. The unusual nature of this recession underscores the need for an oversample that will allow analysts to divide workers of a single race by occupation, gender, and age. All of these groups are experiencing the coronavirus recession in distinct ways.
The same persistent divides can be observed across many other economic variables, including income and wealth. As the country grapples with the legacy of slavery and ongoing systemic racism, economists and policymakers should consider why these divides persist despite the commonly held belief that today’s labor market is less discriminatory. Policing and criminal justice is far from the only domain where systemic racism causes significant harm to the Black community, although research shows that discrimination in the criminal justice system is closely tied to poor labor market outcomes for people of color.
Economists, in particular, must do some soul searching. Most economists are blind to the importance of racial discrimination in their research due to the economic models they employ that largely do not account for racial discrimination. As researchers in the field of stratification economics point out, existing theories of discrimination in the U.S. labor market cannot account for persistent, decades-long divides in economic outcomes between races. Classic models of racial discrimination predict that the free market will adjust and eliminate discrimination, but we haven’t seen this in practice.
Research shows, for example, that job applicants with “Black-sounding” names receive 50 percent fewer invitations to a job interview than those with “White-sounding” names. The researchers find that this is true across industries and employers. Black and Latinx workers who apply for jobs in person are significantly less likely to receive callbacks than White applicants. Similarly, research shows that Black men have to spend more time looking for work and are more likely to have unstable work histories.
The problem is especially acute now. Research shows that Black workers and their families are more affected by recessions. As a group, Black communities experience a deeper recession than others and are likely to be slower to fully recover from a recession than other groups. Amid the coronavirus recession, the losses of jobs among Black workers are, so far, less dramatic, but Black workers are more exposed to the coronavirus and COVID-19 because of their prevalence in front-line professions. This brief is not intended to summarize the many, many ways that Black people experienced the economy differently from White people, but this fact has been extensively documented.
Latinx, Native Americans, Asian American, Native Hawaiians, and Pacific Islanders likewise have their own distinct economic characteristics that are not well-represented by economic aggregates, and these groups also face unique challenges during the coronavirus recession. Latinxs suffer from much higher infection rates and are likely to be in front-line occupations. Native American reservations are dealing with severe outbreaks of the coronavirus. And Asian Americans are facing discrimination and harassment due to racist conspiracy theories about the origins of the virus. Knowing more about these populations of Americans is difficult because existing data sources for these highly heterogeneous groups are lacking, which is why they merit more granular analysis.
Oversampling needs to be accompanied by revamped survey instruments
Oversampling is only a first step in trying to create a federal statistical infrastructure that meets the needs of Black communities and other underserved communities of color. It will also be necessary, in some cases, to rethink survey instruments. The U.S. Census Bureau had planned to change its two-part race and ethnicity questions, which includes a question that asks the respondent if they consider themselves Hispanic and a separate question to indicate whether the respondent considers themselves Black, White, or another race. Census Bureau research found that a new one-question design would have a number of benefits.
Although this change was initially planned for the 2020 Census, the Census Bureau ultimately decided against it, in keeping with the White House Office of Management and Budget’s standards for race and ethnicity in federal data. This decision should be revisited, and OMB should revisit these standards. The one-question design that Census planned has a number of benefits.
Other subgroups cannot be found in the Current Population Survey data at all. There is no option, for example, for a respondent to indicate that they are of Middle Eastern descent. These respondents will generally just indicate that they are White. The result is that Americans of Middle Eastern descent simply can’t be analyzed: They are invisible in our most important economic survey.
Similarly, there are no questions about sexual orientation and gender identity in the CPS or the SCF, making it impossible to analyze these populations. These questions are present in the American Community Survey, and there is good reason for analysts to want to study these groups. Some may face economic discrimination or otherwise have unique experiences in the economy. Encouragingly, investigations into the possibility of identifying these communities by the Census Bureau are feasible.
Conclusion
The policies discussed in this brief are just a small first step toward better economic data coverage for marginalized groups. But ongoing protests against systemic racism and the unique ways that the coronavirus recession is harming Black, Latinx, Indigenous, Asian American, Native Hawaiian, and Pacific Islander communities makes it urgent that federal statistical agencies attempt to make changes that will give economists and policymakers better insight into their economic health now. Providing funding and direction to our statistical agencies will have a lasting impact on our ability to serve these communities. We are advocating three specific actions that could be taken now that would significantly enhance our ability to disaggregate economic data by race.
- Provide funding for the U.S. Census Bureau and the U.S. Bureau of Labor Statistics to perform an oversample of Black, Latinx, Native American, and AANHPI populations. The size of such oversamples should be selected to allow for reasonable disaggregation along the lines of race, age, and gender for Black and Latinx populations. For smaller populations, such as Asian Americans and Pacific Islanders, oversamples should allow analysis at the intersection of race and gender. Congress should also provide funding so the Census Bureau can give cash incentives to populations that are difficult to survey in the monthly Current Population Survey and the Annual Social Economic Supplement.
- Request that the Federal Reserve consider oversampling Black, Latinx, Native American, and AANHPI populations in its Survey of Consumer Finances. The size of the oversample should reflect the importance of understanding Black wealth by generational cohorts.
- Direct the Government Accountability Office to study the feasibility, desirability, and cost of instituting oversamples for these groups in other surveys conducted by the federal statistical agencies. This brief covers two very important economic surveys. But there are a number of other federal data collection efforts that would be well-served by oversampling underrepresented populations. The GAO can identify some of these needs to help guide future congressional action.
—Austin Clemens is a computational social scientist at the Washington Center for Equitable Growth. Michael Garvey is a macroeconomic policy analyst at the Washington Center for Equitable Growth.
Appendix: Standard errors in the Current Population Survey and Survey of Consumer Finances for some sample populations
This appendix demonstrates that in the two major surveys discussed in this brief, sampling errors for communities of color are large. We focus on Black Americans, but the same findings apply to Latinx, Native American, and AANHPI communities, the latter of which is where this problem is even more pronounced because they make up a small portion of the population. Even a significant oversample is unlikely tell us much about small subgroups within the AANHPI population, but it could make it possible for us to look at large subgroups, such as male and female.
The CPS surveys about 60,000 households each month. In March, the Annual Social and Economic Supplement surveys about 100,000 households. These sample sizes are sufficient for studying outcomes for all non-Hispanic Black Americans and gender divisions within the Black community. But at the level of a particular age group of Black Americans, or for Black workers in a specific set of occupations or industries, the error on monthly estimates becomes large. Analysts can mitigate this issue by aggregating multiple survey periods at the expense of timeliness.
To demonstrate the approximate amount of uncertainty in subgroups that might be interesting to researchers, we created standard errors for various point estimates in the monthly CPS and the ASES using bootstrap methods suggested by the Bureau of Labor Statistics. The BLS suggests applying a bootstrap and making a design-effect adjustment to account for the complex design of the survey. They recommend multiplying variances for unemployment totals by 1.6 and all other population estimates by 1.3. Because the CPS has a complex sampling frame, the resulting survey estimates are likely biased.
A basic statistic that is followed closely by economic observers is the employment-to-population ratio: the number of people who are employed divided by the total population of working-age adults. Ninety-five percent confidence intervals for this measure for the whole population have a range of less than 1 percentage point.
Young males are a subgroup where calculating the employment-to-population, or EPOP, ratio is important. Constructing estimates over time shows that the confidence intervals around our point estimates of EPOP for young White males consistently have a range of about 3 percentage points. For young Black males, the range is around 7 percentage points, occasionally reaching 8 percentage points. (See Figure 3.)
Figure 3
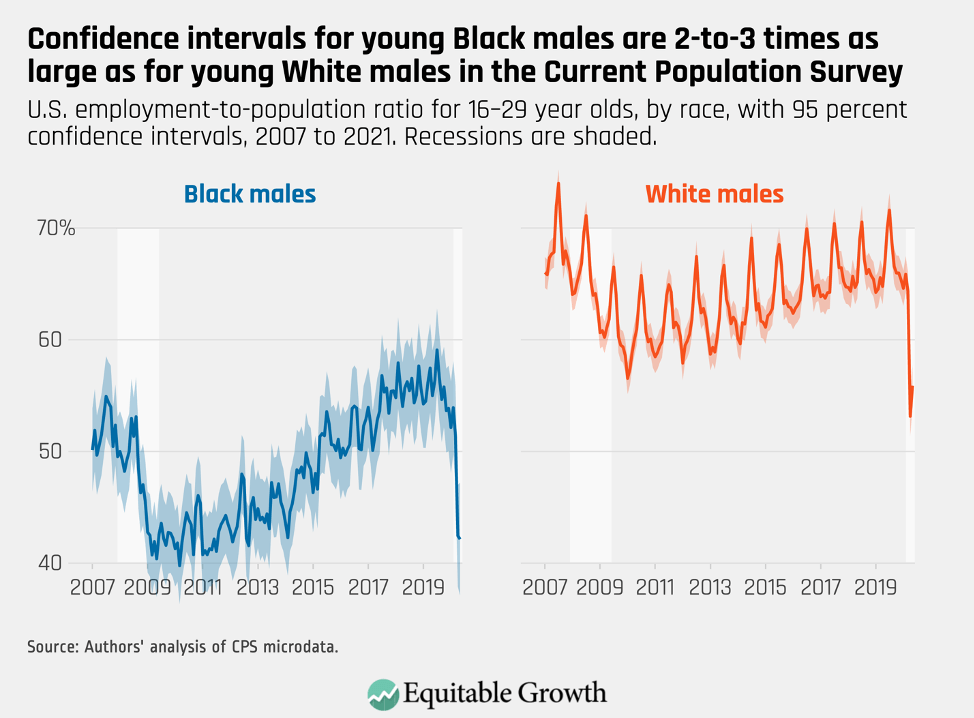
Even without confidence intervals, the lower reliability of estimates for Black males can be seen simply by looking at the trendline. The White employment-to-population trendline exhibits a stable pattern of seasonal differences with long-term trends responsive to the business cycle. The corresponding Black trendline is unstable, and any month-to-month difference is more likely noise than trend, making it difficult to know if the EPOP ratio for this group increased or declined in any given month.
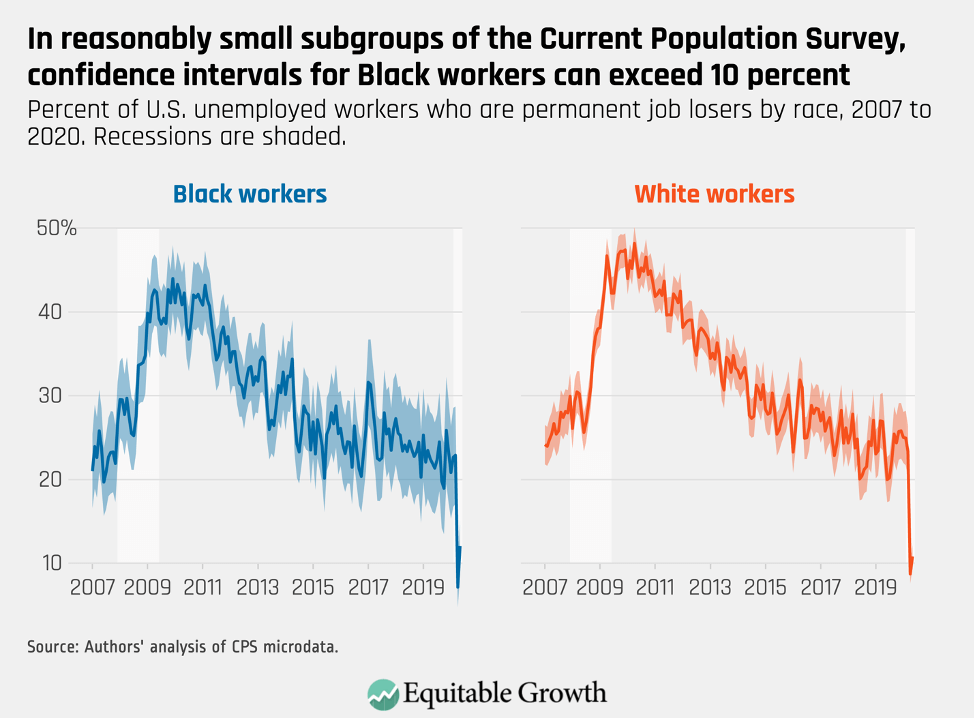
Young males are an entirely plausible population on which analysts might want to focus and are not a particularly small subgroup. Analysts also might be interested, for example, in analyzing only the unemployed population. As the coronavirus pandemic recession drags on, we might want to know what proportion of the unemployed permanently lost their jobs instead of going on furlough or other options.
This population is much smaller and splitting the data by gender or age is not practical. Figure 4 shows the proportion of the unemployed that are permanent job losers, by race. Both lines are unstable, but confidence intervals for Black workers often exceed 10 percentage points. They are a more manageable 4 percentage points for White workers. (See Figure 4.)
Figure 4
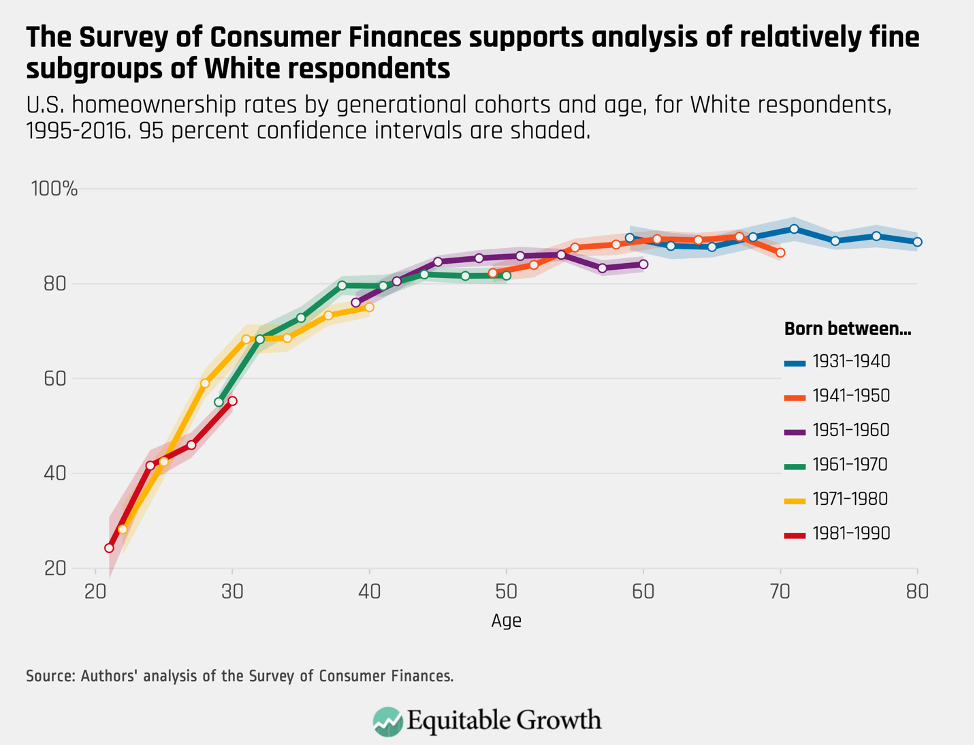
A bit more than 6,000 families are surveyed for the Survey of Consumer Finances, which is conducted every 3 years. The survey’s microdata include five implicates (statistics speak for separate observations) for each respondent to allow analysts to account for imputation error, and a set of replicate weights is also provided to account for sampling error. To show the approximate levels of error that might occur in analysis of SCF data, we replicate calculations of homeownership by age cohort published by one of the authors of this issue brief and Equitable Growth Visiting Fellow John Sabelhaus.
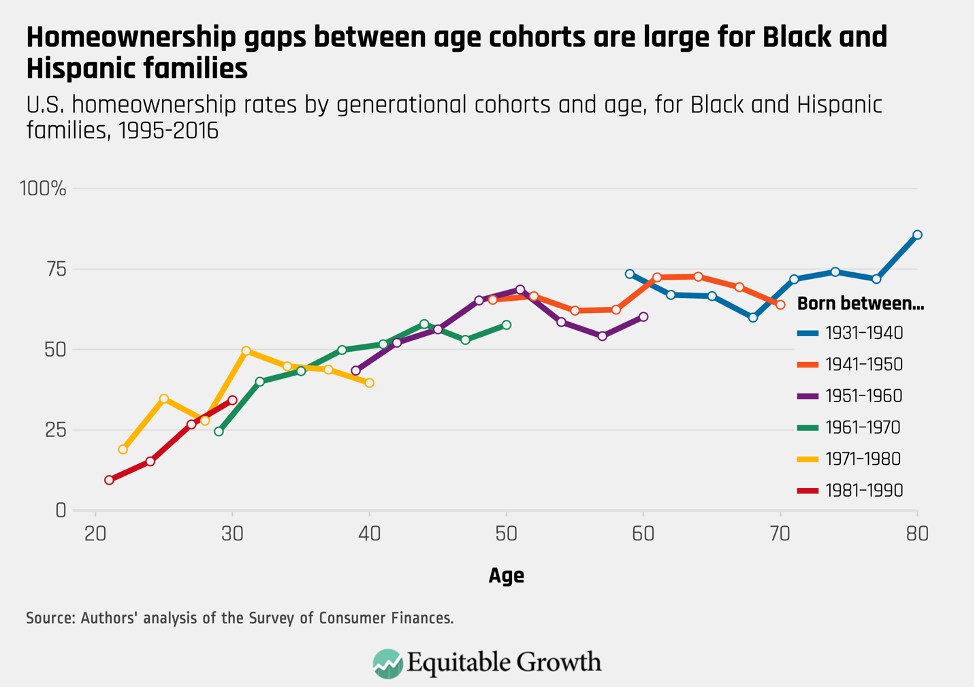
Sabelhaus and Clemens show that successive generations have experienced lower rates of homeownership within several subgroups. An example of such an analysis by Sabelhaus and Clemens groups Black and Hispanic respondents to increase sample size and plots homeownership in each of the surveys between 1995 and 2016, with respondents broken out by year of birth. At the same age, younger cohorts tend to have lower rates of homeownership than older cohorts. (See Figure 5.)
Figure 5
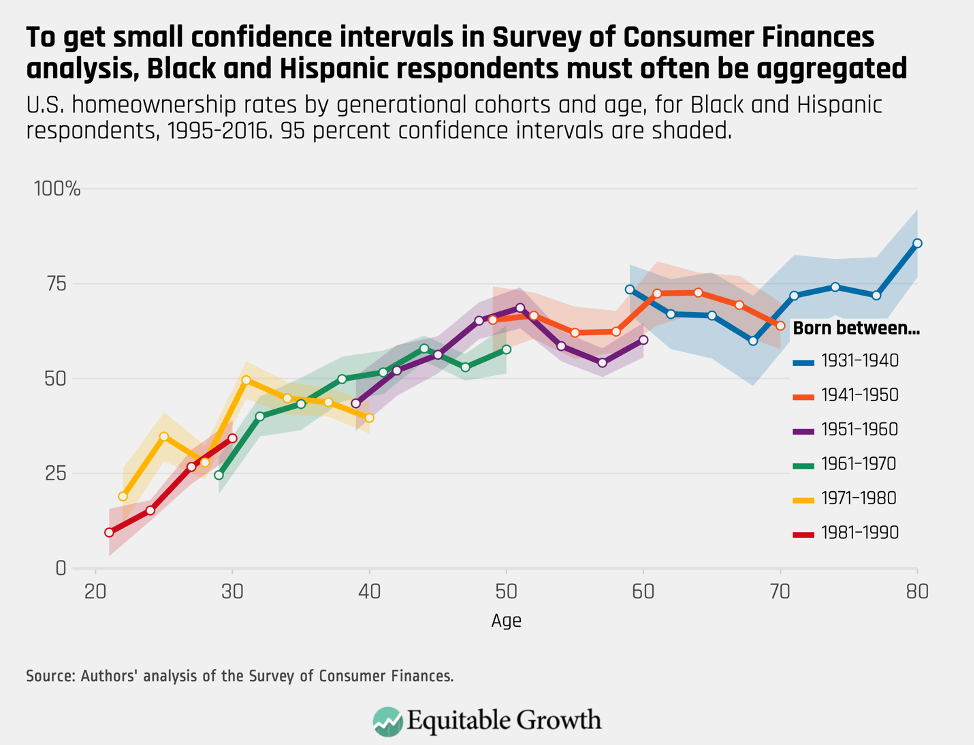
Grouping Black and Hispanic respondents is necessary. Below, we show the same graph with 95 percent confidence intervals for each point estimate. Although some of the gaps between cohorts appear to be statistically significant, many do not reach a 95 percent level of confidence. (See Figure 6.)
Figure 6
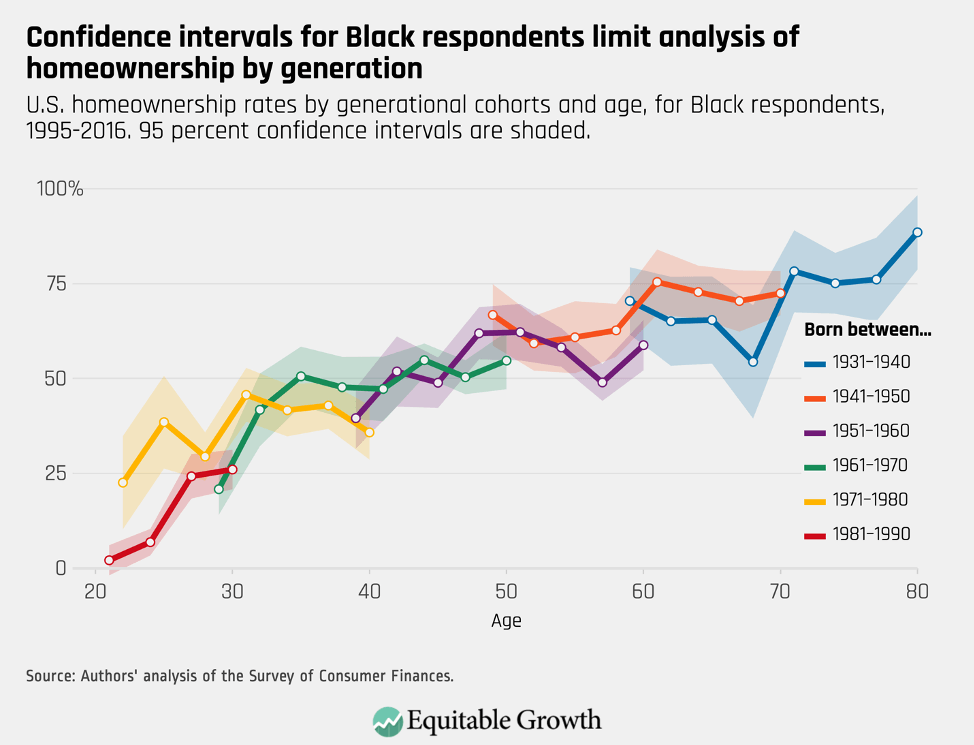
By contrast, the situation for Black respondents alone is intractable. Confidence intervals are large, with ranges exceeding 20 percentage points in several instances. Analysis of subgroups of this size is essentially impossible. (See Figure 7.)
Figure 7
As with the CPS, Black and Hispanic families are, if anything, undersampled in the survey, because the SCF’s oversample of wealthy families tips the racial composition heavily toward White families. Below, we show that the exact same analysis for White respondents produces tight confidence intervals of just a few percentage points. Even though the gap between homeownership at age 40 for older and younger Gen Xers is only about 4.5 percentage points, this difference is statistically significant. (See Figure 8.)
Figure 8