Equitable Growth’s Jobs Day Graphs: May 2020 Report Edition
1.
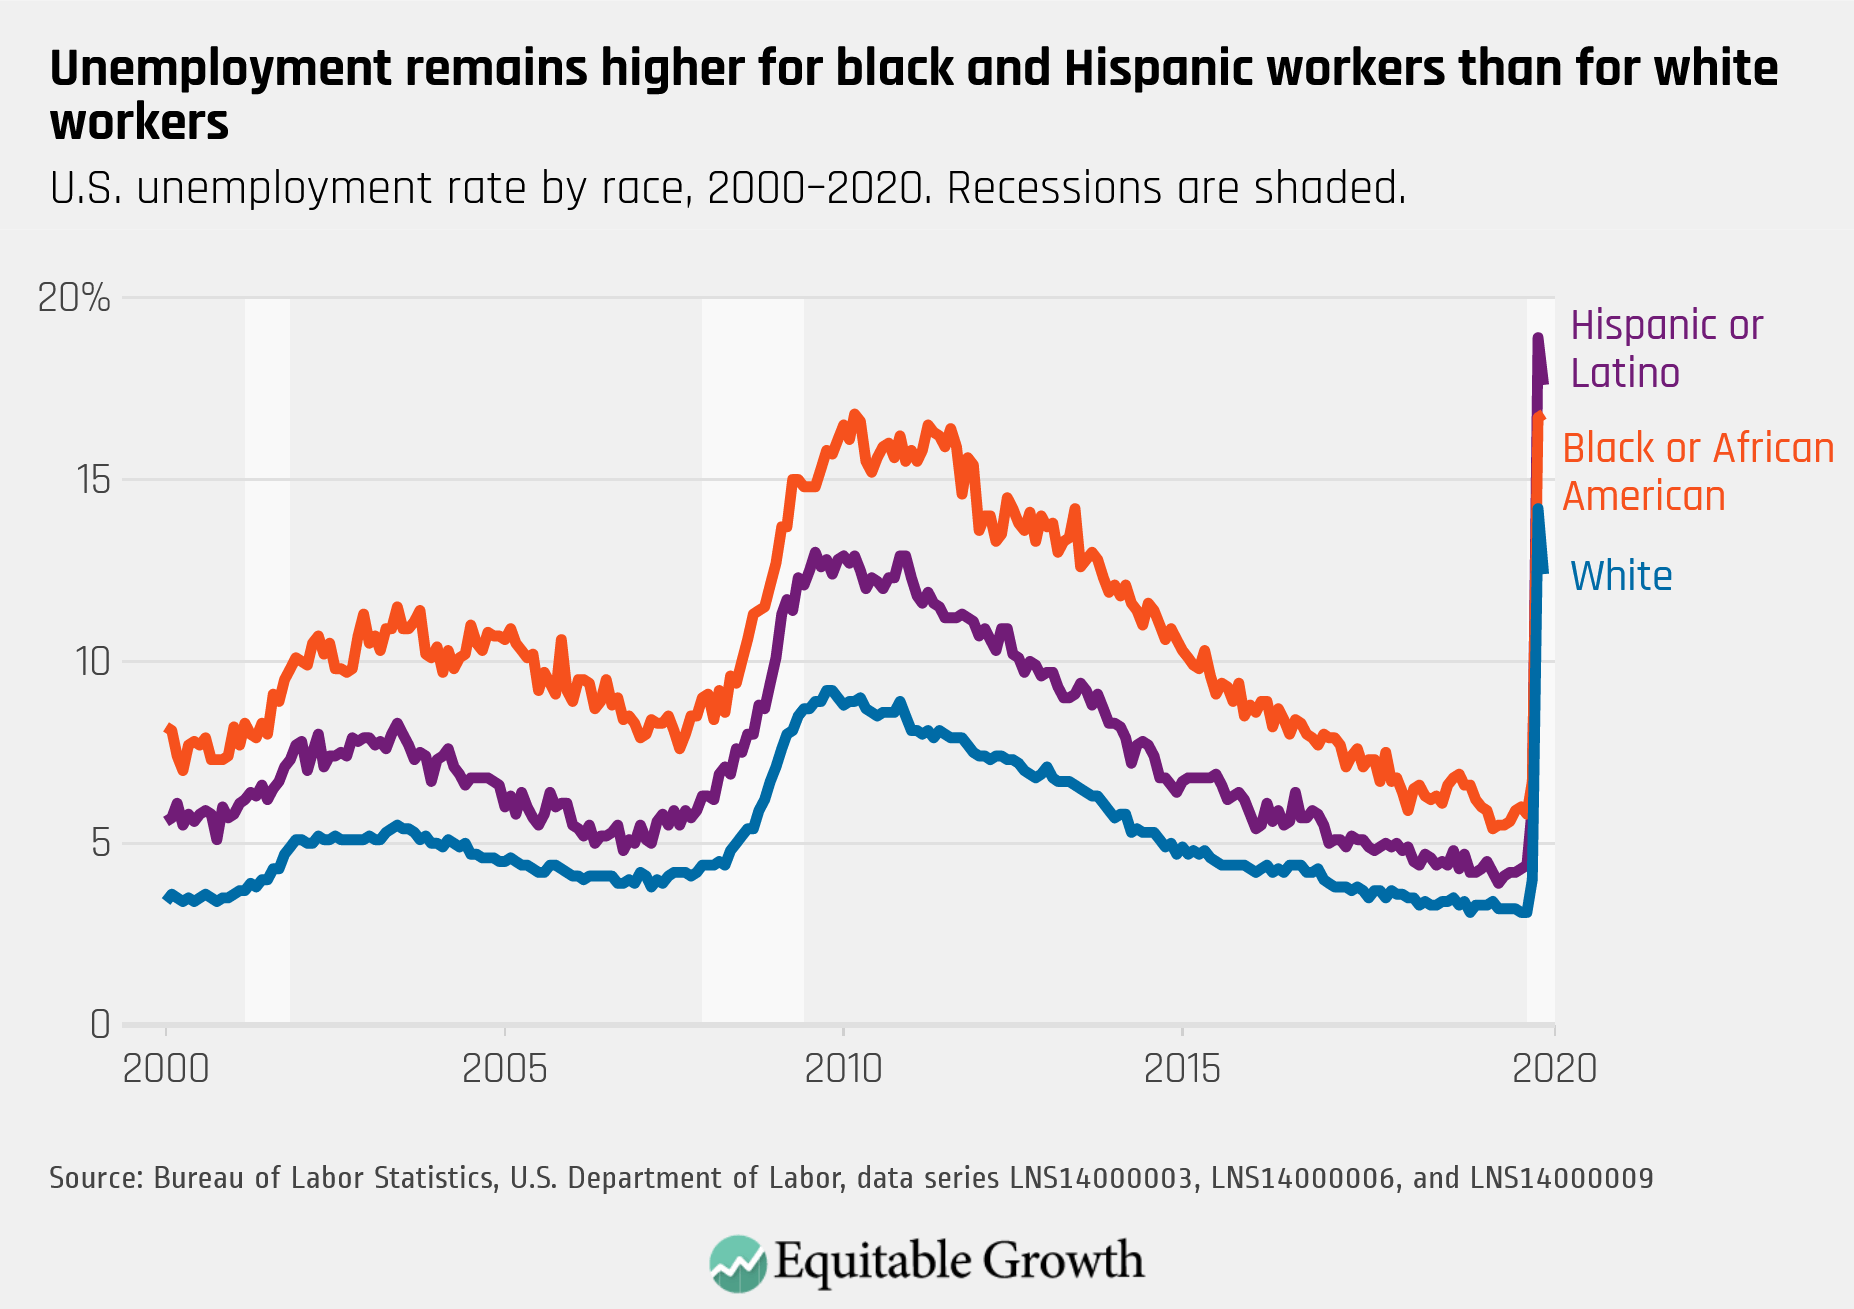
As the overall unemployment rate declined to 13.3%, this was led by a decline in white unemployment from 14.2% to 12.4%. Meanwhile, Black unemployment increased slightly from 16.7% to 16.8% and Hispanic unemployment declined from a historic high of 18.9% to 17.6%.
2.
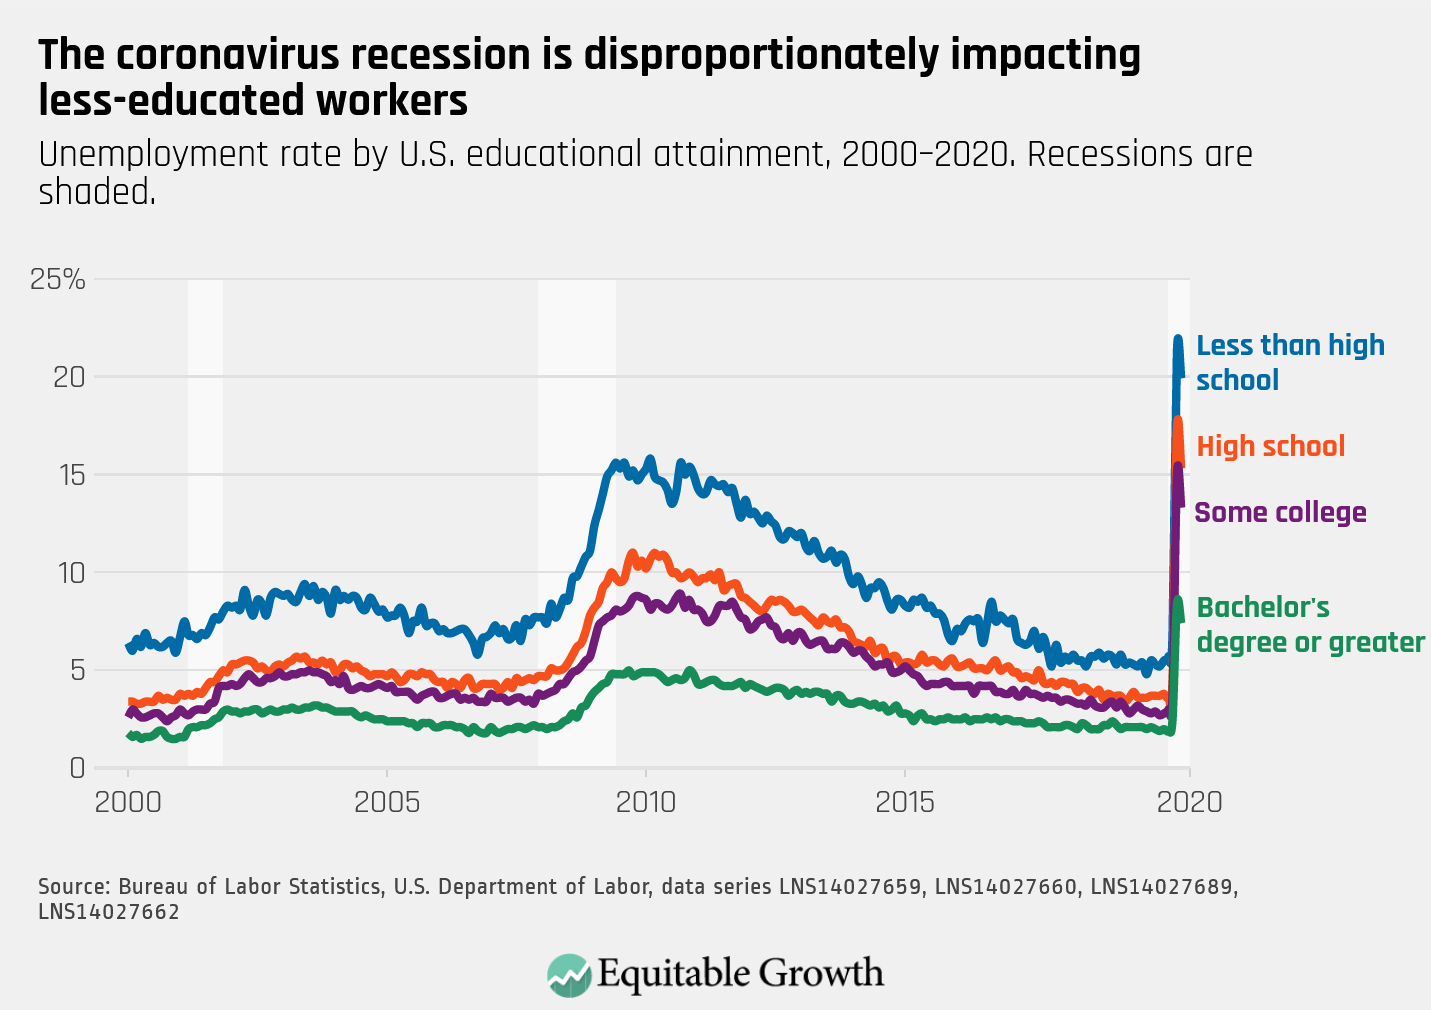
The unemployment rate declined for all education levels, while maintaining higher rates of unemployment for less educated groups.
3.
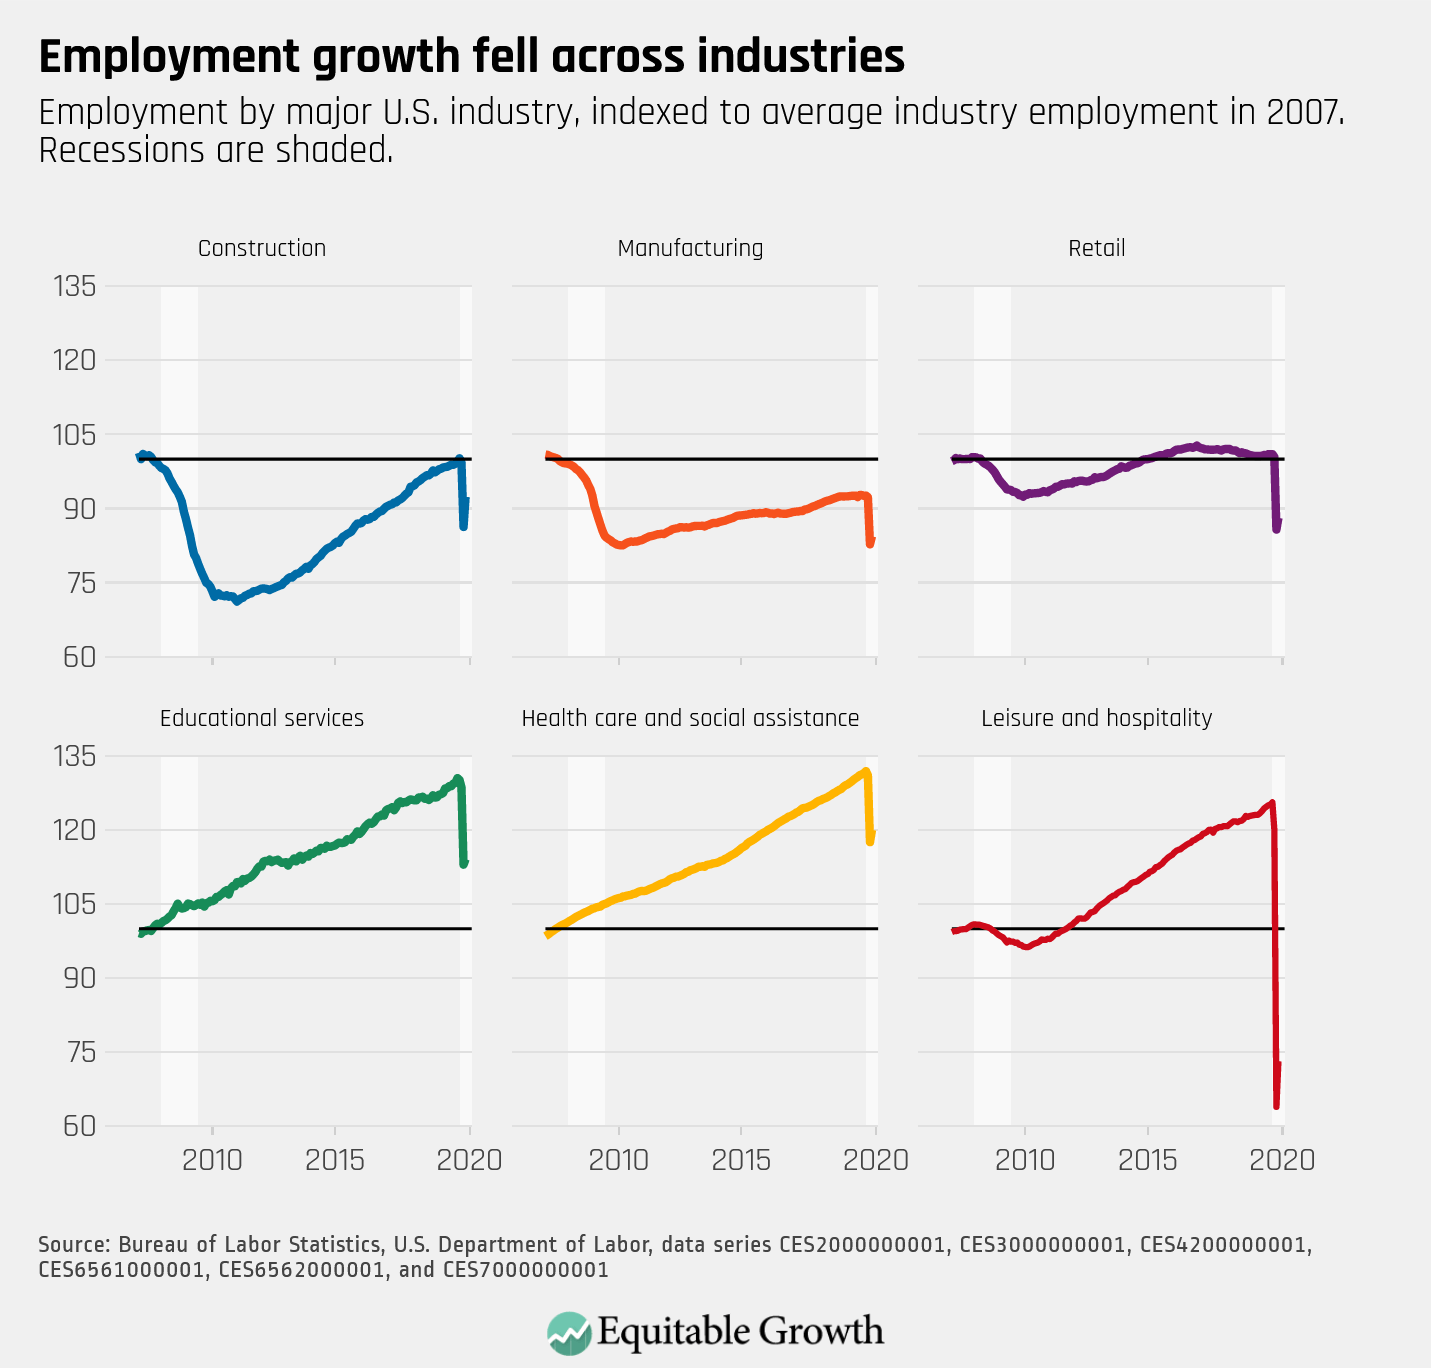
Employment across sectors began to rebound in May, and growth was led by leisure and hospitality after this industry lost nearly half of all employment in the prior month.
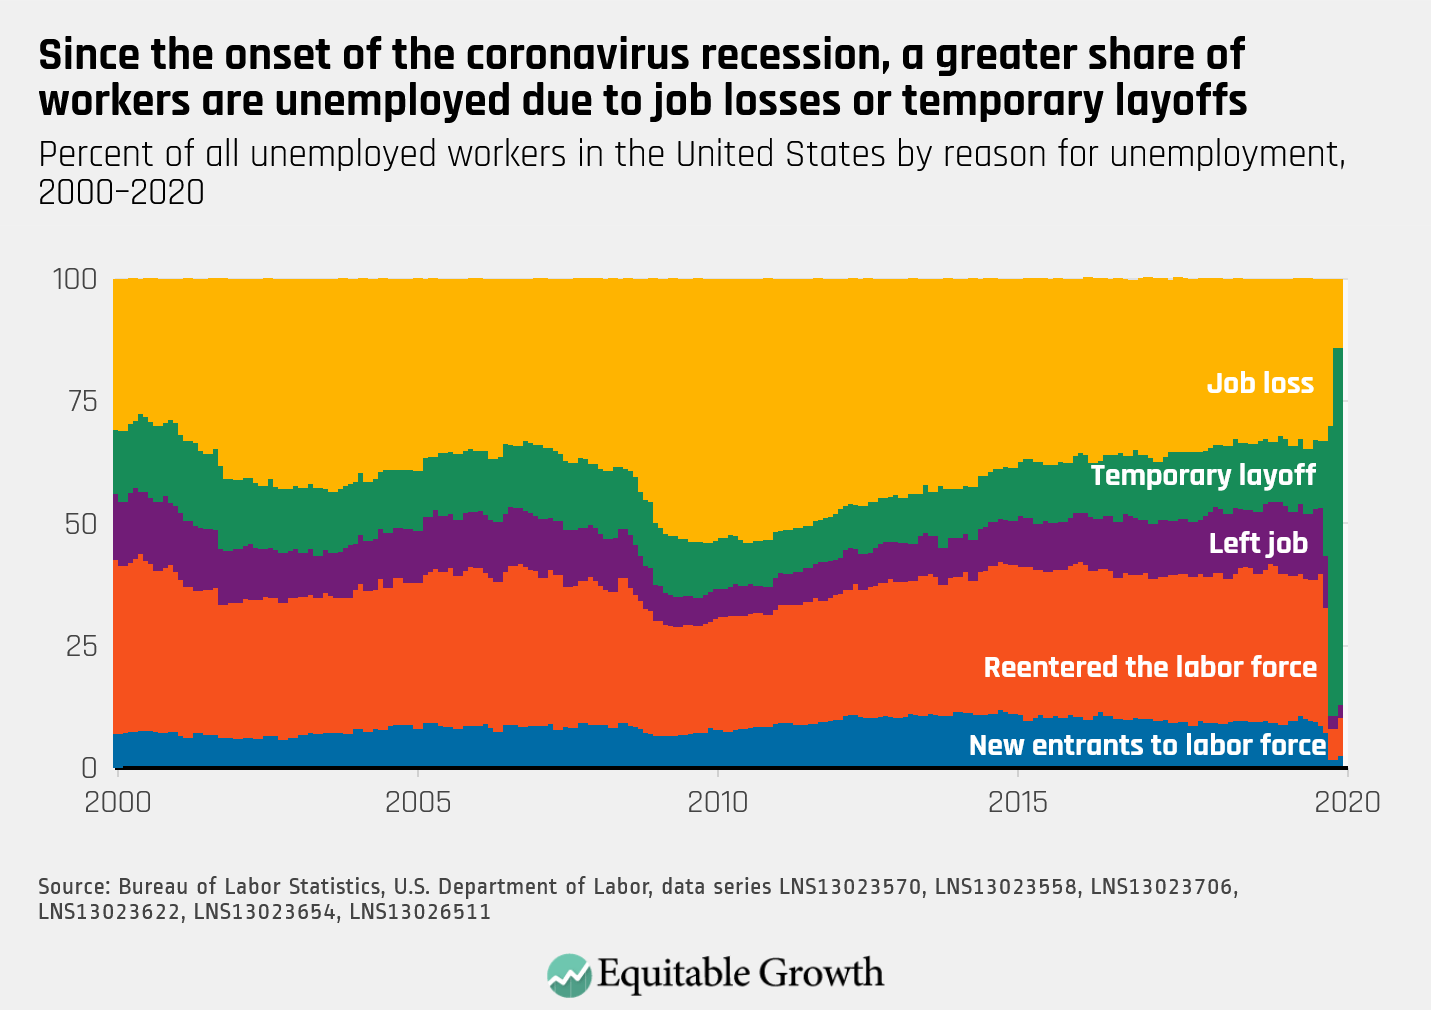
4.
The proportion of unemployed workers who were on temporary layoff declined in May, while permanent job losers, re-entrants, and new entrants to the labor force all increased.
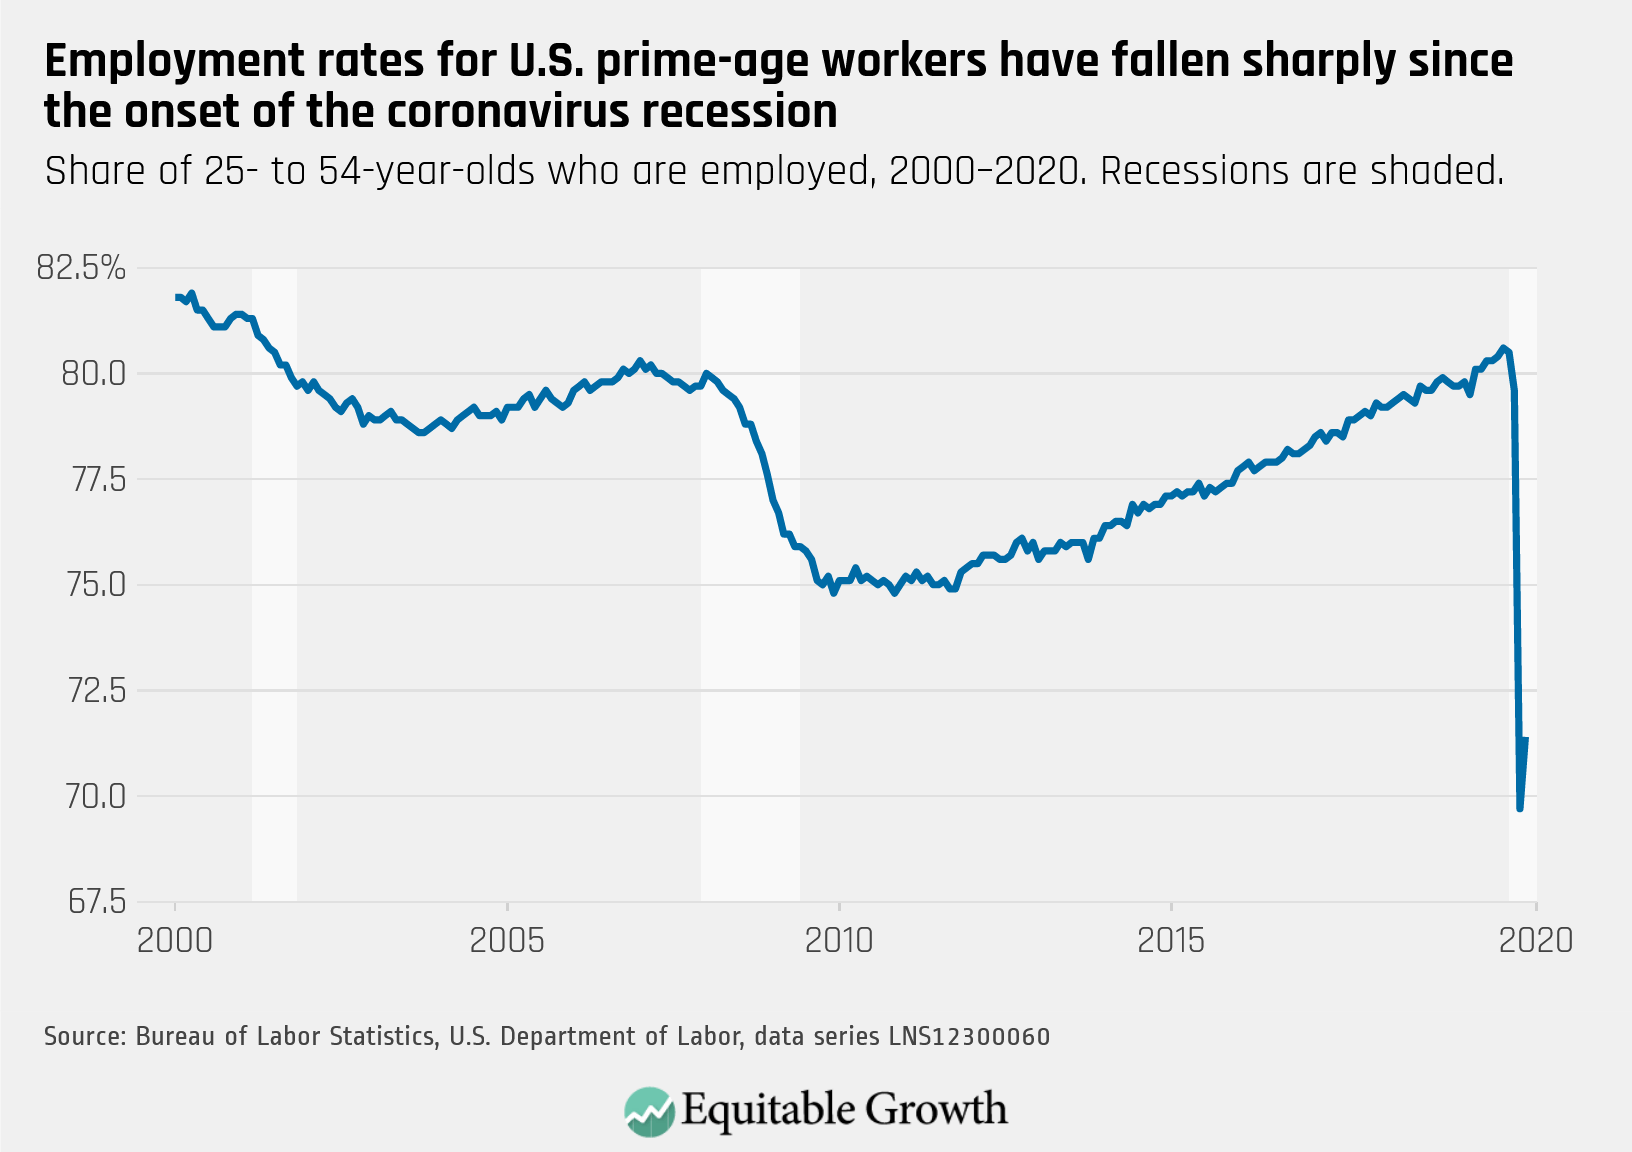
5.
After the most extreme decline in employment levels in history in April, the prime-age employment rate moved upward in May to 71.4%