A generational perspective on recent U.S. homeownership divergence by income and race

Overview
Between the end of 2012 and the end of 2019, the Federal Reserve Board estimates that the total value of U.S. owner-occupied housing increased nearly 60 percent, from $18.5 trillion to $29.3 trillion. Most of that growth—more than 90 percent—was because existing house prices increased, not because new houses were being built. The value of homes alone accounted for about one-third of the overall increase in household wealth over this time period.
Housing is the most important source of wealth for most U.S. families and thus an important wealth equalizer. Yet the increase in house values during the recent expansion did not help to equalize wealth, as might be expected. Homeownership declined after the Great Recession, and those declines were concentrated in the bottom half of the income distribution and among Black and Hispanic families. That means the increases in house values reinforced—rather than offset, as would be expected—increasing inequality in other types of wealth.
Recent trends in homeownership across broad socioeconomic groups are alarming, especially when viewed from a lifecycle perspective. This perspective acknowledges that homeownership varies systematically and expectedly with age. Most adults start life as renters and gradually become homeowners, then remain homeowners through retirement while living independently. As a result, housing wealth is a key component of retirement resources for many families because lower housing costs (after the mortgage is paid off) makes it possible to subsist on the lower income associated with retirement.
Housing also is often a key source of wealth for homeowners managing their transitions to assisted living or dealing with other types of health or financial needs. As such, the change in lifecycle homeownership trajectories across generations over the past decade points to a future crisis in retirement preparedness that goes beyond rising wealth inequality.
In this issue brief, we will briefly examine trends in homeownership by income and race before and after the Great Recession through the end of 2019, when the then-11-year economic expansion had only 2 more months of momentum before the onset of the coronavirus recession. We’ll then look at this data across generations from a lifecycle perspective over the same time period to show that trends in U.S. homeownership feature dramatically rising inequality by income and race, largely driven by failure to move from renting to owning over the lifecycle. These findings are important for policymakers to factor in as they confront the coronavirus recession and prepare policies to ensure the eventual economic recovery is more equitable for all homeowners in the United States, not just the wealthiest.
Trends in homeownership
The past quarter-century has seen a rise and fall in U.S. homeownership, with the period just prior to the Great Recession as the peak. According to the Federal Reserve Board’s Survey of Consumer Finances, or SFC, the fraction of adults living in their own homes was 69 percent in 1995, rising to 73 percent in 2004, and subsequently falling back to 68 percent by 2016.
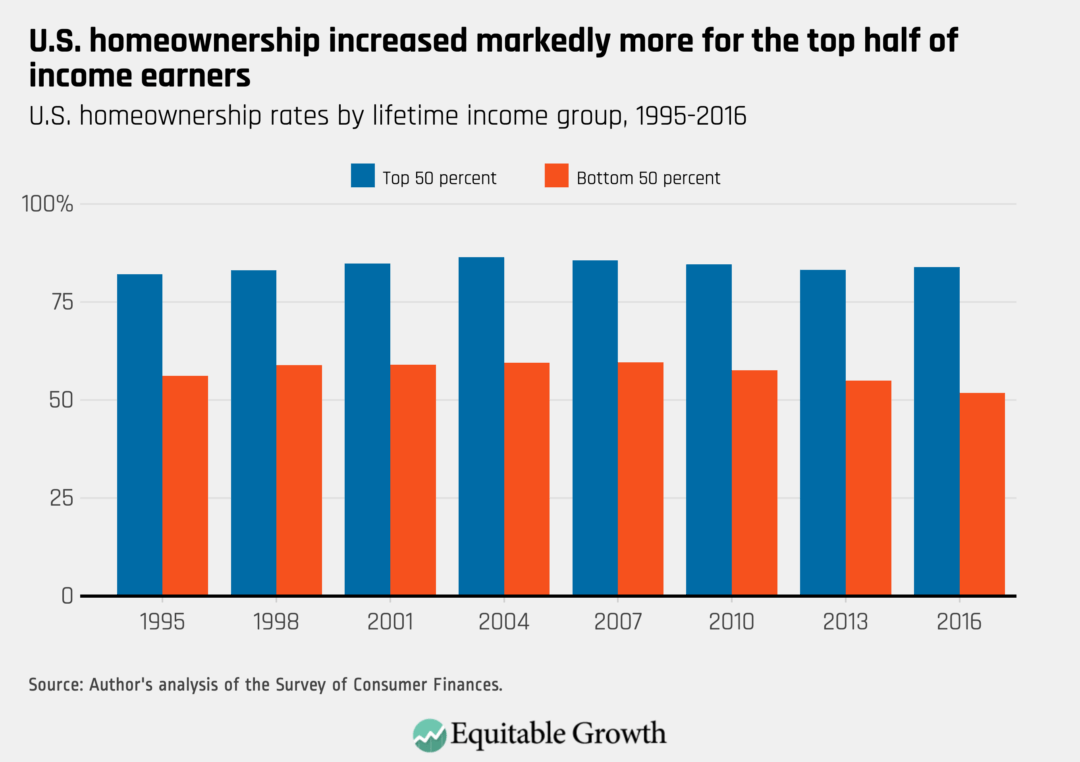
Starting with income, consider the patterns of homeownership for the top and bottom halves of the income distribution. In every year, homeownership is much higher for the top half of the income distribution than it is for the bottom half. The increase in homeownership between 1995 and 2004 is evident for both income groups, but on net, the top half saw an increase in homeownership from 82 percent in 1995 to 84 percent in 2016. The bottom half of the income distribution also saw gains in the early part of that period, but on net, there is a decrease in homeownership from 56 percent in 1995 to 52 percent in 2016. (See Figure 1.)
Figure 1
Both levels and trends in homeownership, however, differ by race, and the divergence in homeownership is dramatic. Again, the rise and fall in homeownership is ubiquitous, with peaks occurring just prior to the Great Recession. The divergence in homeownership by race in every year is, once again, eye-popping, with the homeownership rate for White people on the order of one-and-a-half times that for Black and Hispanic people. (See Figure 2.)
Figure 2
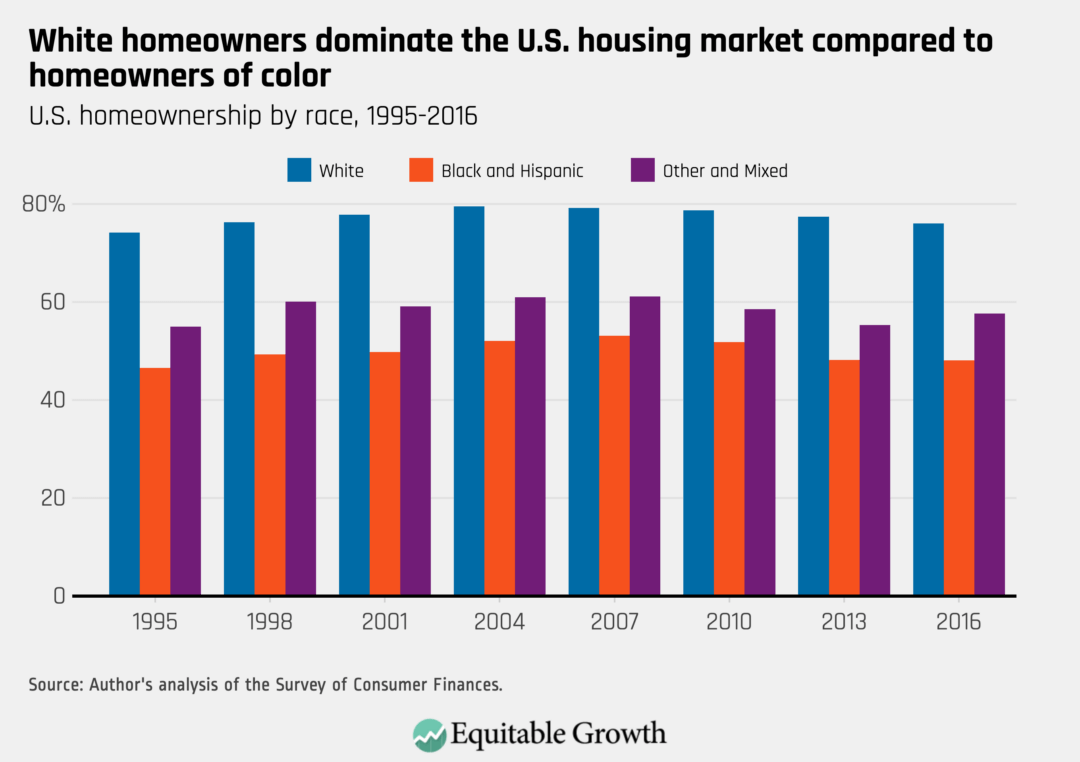
On net, over the period, White homeownership increased from 74 percent in 1995 to 76 percent in 2016, while Black and Hispanic homeownership also increased from 47 percent in 1995 to 48 percent in 2016. Even though the overall rate of homeownership is down slightly for the past 25 years, the rate of homeownership increased, on net, for all race groups. That apparent conundrum is attributable to changing population shares (more Black and Hispanic families) with different levels of homeownership. The differences are more extreme relative to the recent peak, however, with White homeownership down about 3 percentage points while Black and Hispanic homeownership is down about 5 percentage points.
Lifecycle perspective
Group-level statistics such as those above are a useful starting point for thinking about homeownership and housing policy, but a better way to see what has really been happening is to look at the data from a lifecycle perspective. This perspective tracks groups of people by age through a series of survey snapshots. We see a given birth cohort at a certain age in one survey, and then we see the same cohort again at increasingly older ages in the subsequent surveys. The Survey of Consumer Finance is conducted every 3 years, so we see, for example, those born in 1970 at age 25 in the 1995 survey, then again when they are 28 in the 1998 survey, up until they are 46 in the 2016 survey. (See Figure 3.)
Figure 3
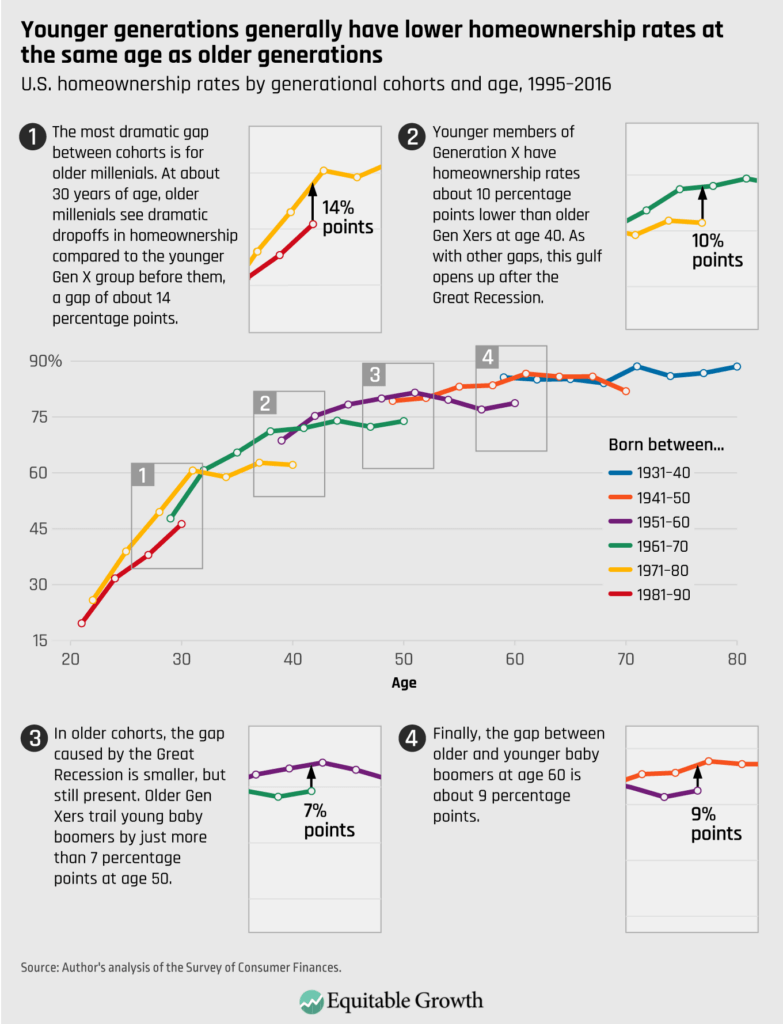
By charting the outcomes for multiple birth cohorts in one picture, we can see the lifecycle pattern for the outcome we are studying—in this case, homeownership. Each connected set of dots along each differently colored line follows a 10-year generational cohort over the part of their lifecycle captured in the 1995–2016 SCF data. Each cohort group shows up in as many as seven survey waves.
The lifecycle pattern of homeownership by age is clear when looking across generational cohorts overlaid on the chart. For all families, homeownership rates increase from about 30 percent for families in their 20s to a peak of around 80 percent in middle and older ages.
But the lifecycle charts also show the decline in homeownership after 2007 from a generational cohort perspective. The last three dots on any given cohort line (in reverse order, 2016, 2013, and 2010) show how much homeownership changed for those cohorts after 2007. For all families taken as a whole, the decline in homeownership can generally be described as failure to move up along the lifecycle trajectory of previous cohorts. The black arrows show how far a given cohort is behind the cohort ahead of them at the same age in terms of homeownership in 2016.
A lifecycle perspective on homeownership by income and race
The differences in homeownership by income and race in the column charts above are also clear in the lifecycle charts. From this perspective, additional insights are evident about how the changes in homeownership are driving overall group outcomes by income and race. We can see this by splitting the overall population data as we did above, first for the top and bottom halves of the income distribution and then by race and ethnicity. (See Figures 4 and 5.)
Figure 4
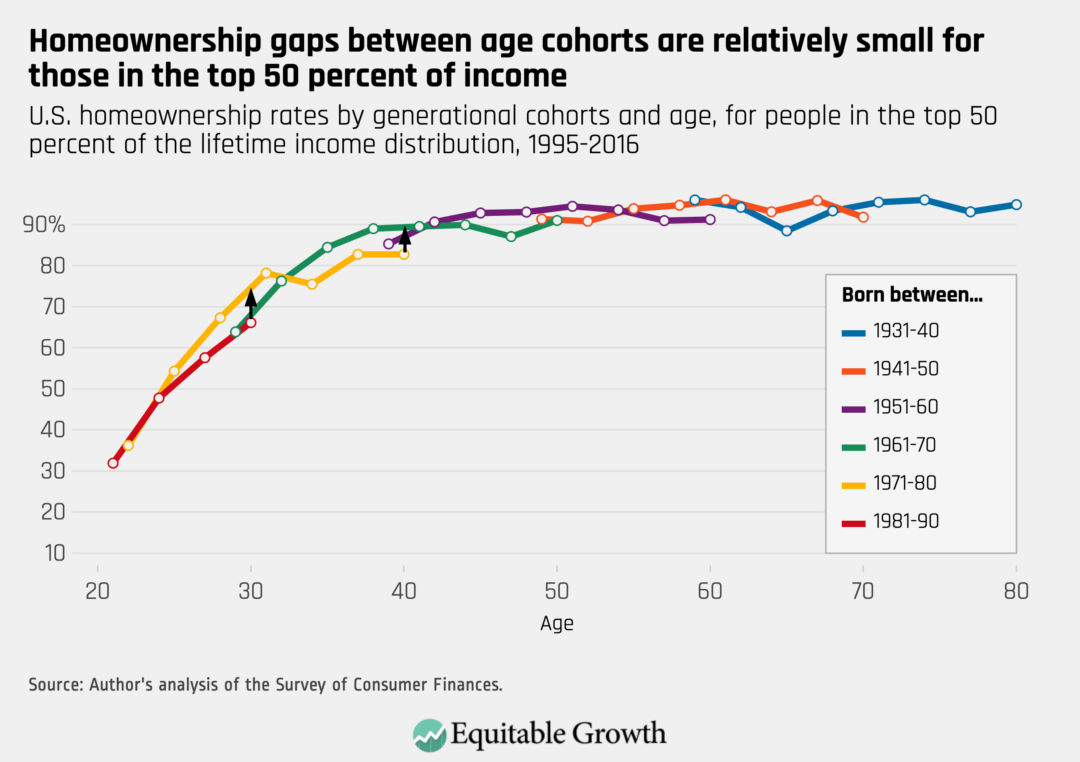
Figure 5
Splitting the population by income shows us two different economic recoveries from the Great Recession. Other than the young, families in the top half of the income distribution maintained their homeowner status. By age 40, about 90 percent of such families are homeowners, and nothing about that changed after 2007. It is true that young, higher-income families born in the 1980s were less likely to be homeowners around age 30 than the cohorts ahead of them, but they still had homeownership rates above 50 percent and near the levels achieved by the 1960s birth cohort.
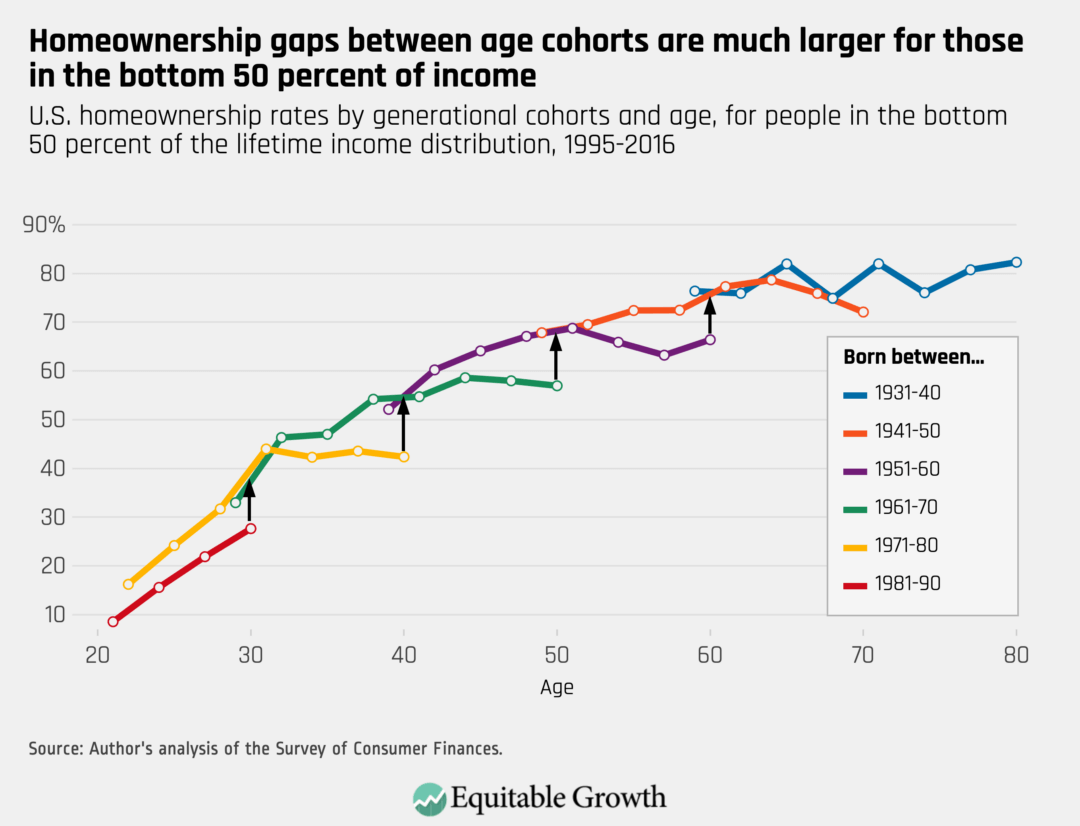
The story for the bottom half of the income distribution is, of course, different. Begin with the data showing that the overall lifecycle pattern is much flatter for lower-income families. Although historically 70 percent to 80 percent of families in the bottom half of the income distribution are homeowners by the time they reach retirement age, it has historically taken longer to get there for many lower-income families.
That slower pace of homeownership for lower-income families was a valid policy concern before 2007, but things got much worse after the Great Recession. The lifecycle chart for the bottom half of the income distribution shows how younger cohorts are increasingly falling behind those born in earlier decades. More than 60 percent of those born in the 1950s, for example, were homeowners when they were around age 50, on the eve of the Great Recession. Ten years later, when the 1960s cohort reached the same age, homeownership was only 50 percent.
To be clear: Within the bottom half of the income distribution of the 1960s cohort, 1 in 6 who would have been homeowners had they followed the preceding cohort’s lifecycle pattern were excluded from homeownership. One can look at the cohort chart and infer that homeownership did not fall for the 1960s birth cohort, on average, because those who were homeowners in 2007, on average, remained as such. But that is not the point. Over this crucial part of the lifecycle, some of the families that had been renting should have entered the ranks of homeownership and started to begin building wealth. They did not. If nothing changes, the historical 70 percent to 80 percent of lower-income families being homeowners on the eve of retirement could be more like 40 percent to 50 percent.
The contrast in cohort homeownership by race is nearly as dramatic as the differences by income, and points to the same sorts of divisions. Among White people, only the young (born in the 1980s) seem to be on a different trajectory after 2007. It is an open question as to whether the younger group will ever catch up to the lifecycle trajectory mapped out by earlier birth cohorts, because there are both demographic factors (marriage and fertility decisions) that are intertwined with economic factors (high student debt, diminished income prospects). These factors are likely just delaying homeownership, but it is, of course, too early to tell for sure.
The stark contrast between high and low income is also evident when we compare the cohort charts for White families with the cohort chart for Black and Hispanic families. Again, and consistent with the overall homeownership by race shown above, homeownership for Black and Hispanic families is well below White families at all ages, though the gaps have historically narrowed as any given cohort moves through the lifecycle. (See Figures 6 and 7.)
Figure 6
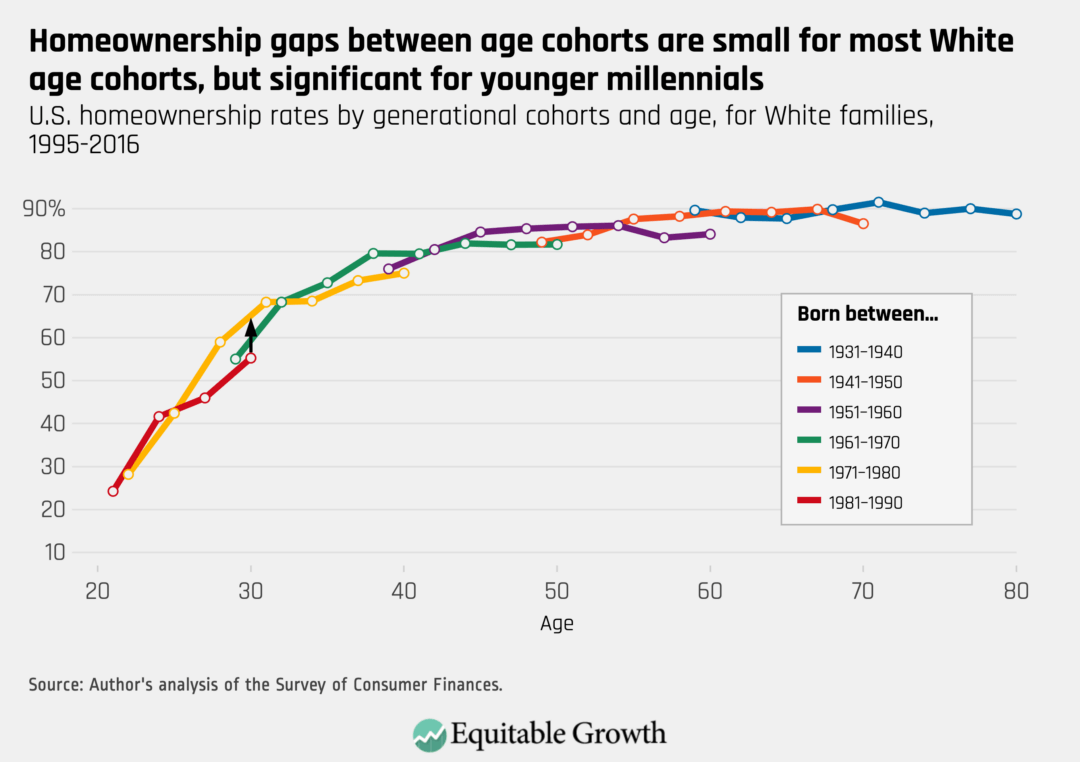
Figure 7
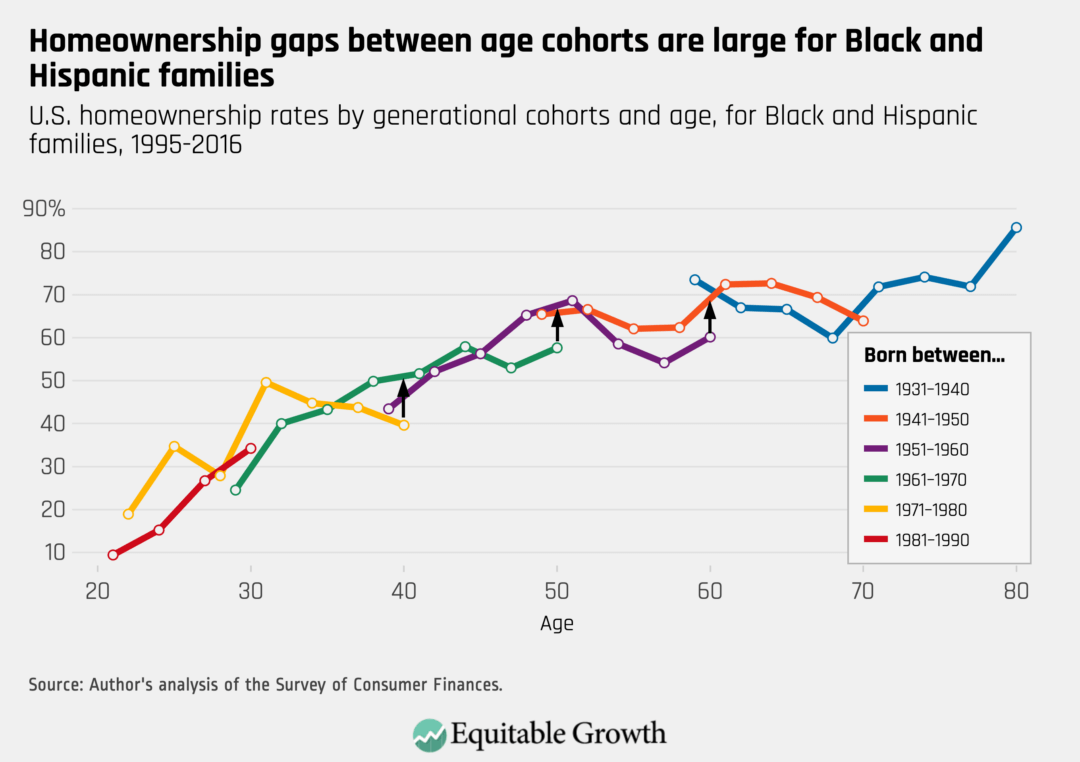
Historically, homeownership has been 60 percent to 70 percent for recent cohorts of Black and Hispanic families by retirement age. That is still unjustifiably below the 90 percent homeownership rate for White families at older ages, but again, the lifecycle charts show how this could get much worse as we look ahead. Younger and middle-age cohorts are not seeing the expected increases in homeownership as they get older, and many more families in those younger generations might be expected to reach retirement without having enjoyed the benefits of homeownership.
Conclusion
The historical divergence in U.S. homeownership between high and low income and between White and Black and Hispanic families is a longstanding policy concern. That divergence is increasing in recent years, and the immediate implication has been that the potential wealth-equalizing benefits of rising aggregate housing wealth have been diminished, or even reversed. U.S. housing wealth increased after 2012, but those gains were disproportionately and increasingly received by higher income and White families.
The generational perspective on homeownership presented here reinforces the takeaways from the traditional group-level disaggregation and adds a time dimension. Lower-income, Black, and Hispanic families appear to be on a different homeownership trajectory in recent years. Unlike the years leading up to the Great Recession, the pattern of rising homeownership with age seems to have stalled, and possibly even reversed.
The decline in homeownership is concentrated among disadvantaged families in younger generations, and as the years pass by, the opportunities to get those families back on track to a lifetime of productive wealth accumulation are diminished. If policymakers do not act soon and aggressively to reverse recent trends, it will be too late for the young and middle-aged generations of disadvantaged families as they approach retirement.