U.S. income inequality is worse and rising faster than policymakers probably realize

Overview
The use of U.S. administrative income tax data for research purposes over the past two decades has led to an ongoing debate about levels and trends in U.S. income inequality. The debate around income measurement is important because how economists and policymakers alike measure income shapes how income inequality is perceived by the broader American public and thus could drive public policy decisions in more equitable directions.1
Download FileU.S. income inequality is worse and rising faster than policymakers probably realize
This debate about U.S. income inequality has swung back and forth. Some early academic uses of administrative income tax data showed dramatically higher and rising income concentration than previously thought.2 Yet some more recent efforts show less income inequality with no upward trend.3 The debate today centers on what types of income are being counted in the inequality measures and what sorts of data are used to measure each type of income.
There is a well-established middle ground in the income inequality debate, based on a regular series of reports from the Congressional Budget Office.4 The nonpartisan CBO measures household incomes in what most observers believe to be a conceptually comprehensive way. It also combines the best available data for every type of household income, merging surveys and administrative tax records. The result is believed by many to be the most accurate picture of U.S. income inequality available.
Even the CBO measures, however, are missing two important drivers of income inequality. The first is the CBO estimates the measurement of noncorporate business income. The second is the CBO counts only the portion of capital gains that is realized and taxable in the current year by any tax filer, instead of a more comprehensive measure of all capital gains associated with income-producing assets earned in the current year.
These two missing drivers of income inequality—uncaptured noncorporate business income and the gap between realized and unrealized capital gains income—means that income inequality is worse and rising faster than policymakers probably realize.
In our research, we use another household dataset, the Survey of Consumer Finances, or SCF, that makes it possible to address those two shortcomings and create a more comprehensive view of income inequality.5 This survey is conducted by the Federal Reserve Board every 3 years and was most recently completed in 2016, measuring incomes of respondents in 2015. The SCF has better measures of noncorporate business income, and SCF wealth measures make it possible to allocate all capital gains across households using values for SCF income-producing assets such as stocks, bonds, mutual funds, and closely held businesses.
This issue brief examines these two missing drivers of U.S. income inequality and concludes by showing that proper accounting for noncorporate business income and unrealized capital gains helps us understand the connection between high and rising U.S. income inequality and the dynamics of income and wealth inequality in the United States.
Noncorporate business income reporting
The first issue we address is noncorporate business income reporting. Most analysis of income inequality—including by the Congressional Budget Office—starts from the measure of noncorporate business income reported on income tax returns. The measure of noncorporate business income on tax returns is only about half of the noncorporate business income estimated in the National Income and Product Accounts, or NIPA, which is the benchmark for all components of U.S. national income.6
The gap between taxable business income and NIPA business income is, to some extent, a mystery. One source of difference is simple noncompliance by noncorporate business taxpayers, meaning deliberate misreporting to the IRS. But there are other possible sources of divergence between taxable and NIPA business incomes as well. NIPA statisticians estimate noncorporate business income as one component of overall national income, and any conceptual differences between NIPA economic concepts and the methods used to compute business sales and costs for tax purposes will lead to differences in estimated incomes. The decision about whether and how to account for the missing noncorporate business income is one of the key factors underlying differences in estimated U.S. income inequality.7
The Survey of Consumer Finances measures business income by simply asking respondents what their businesses earned. The total of SCF noncorporate business income is well above the tax-based income aggregate captured by the Congressional Budget Office and correspondingly, the SCF is much closer to NIPA for noncorporate business incomes. (See Figure 1.)
Figure 1
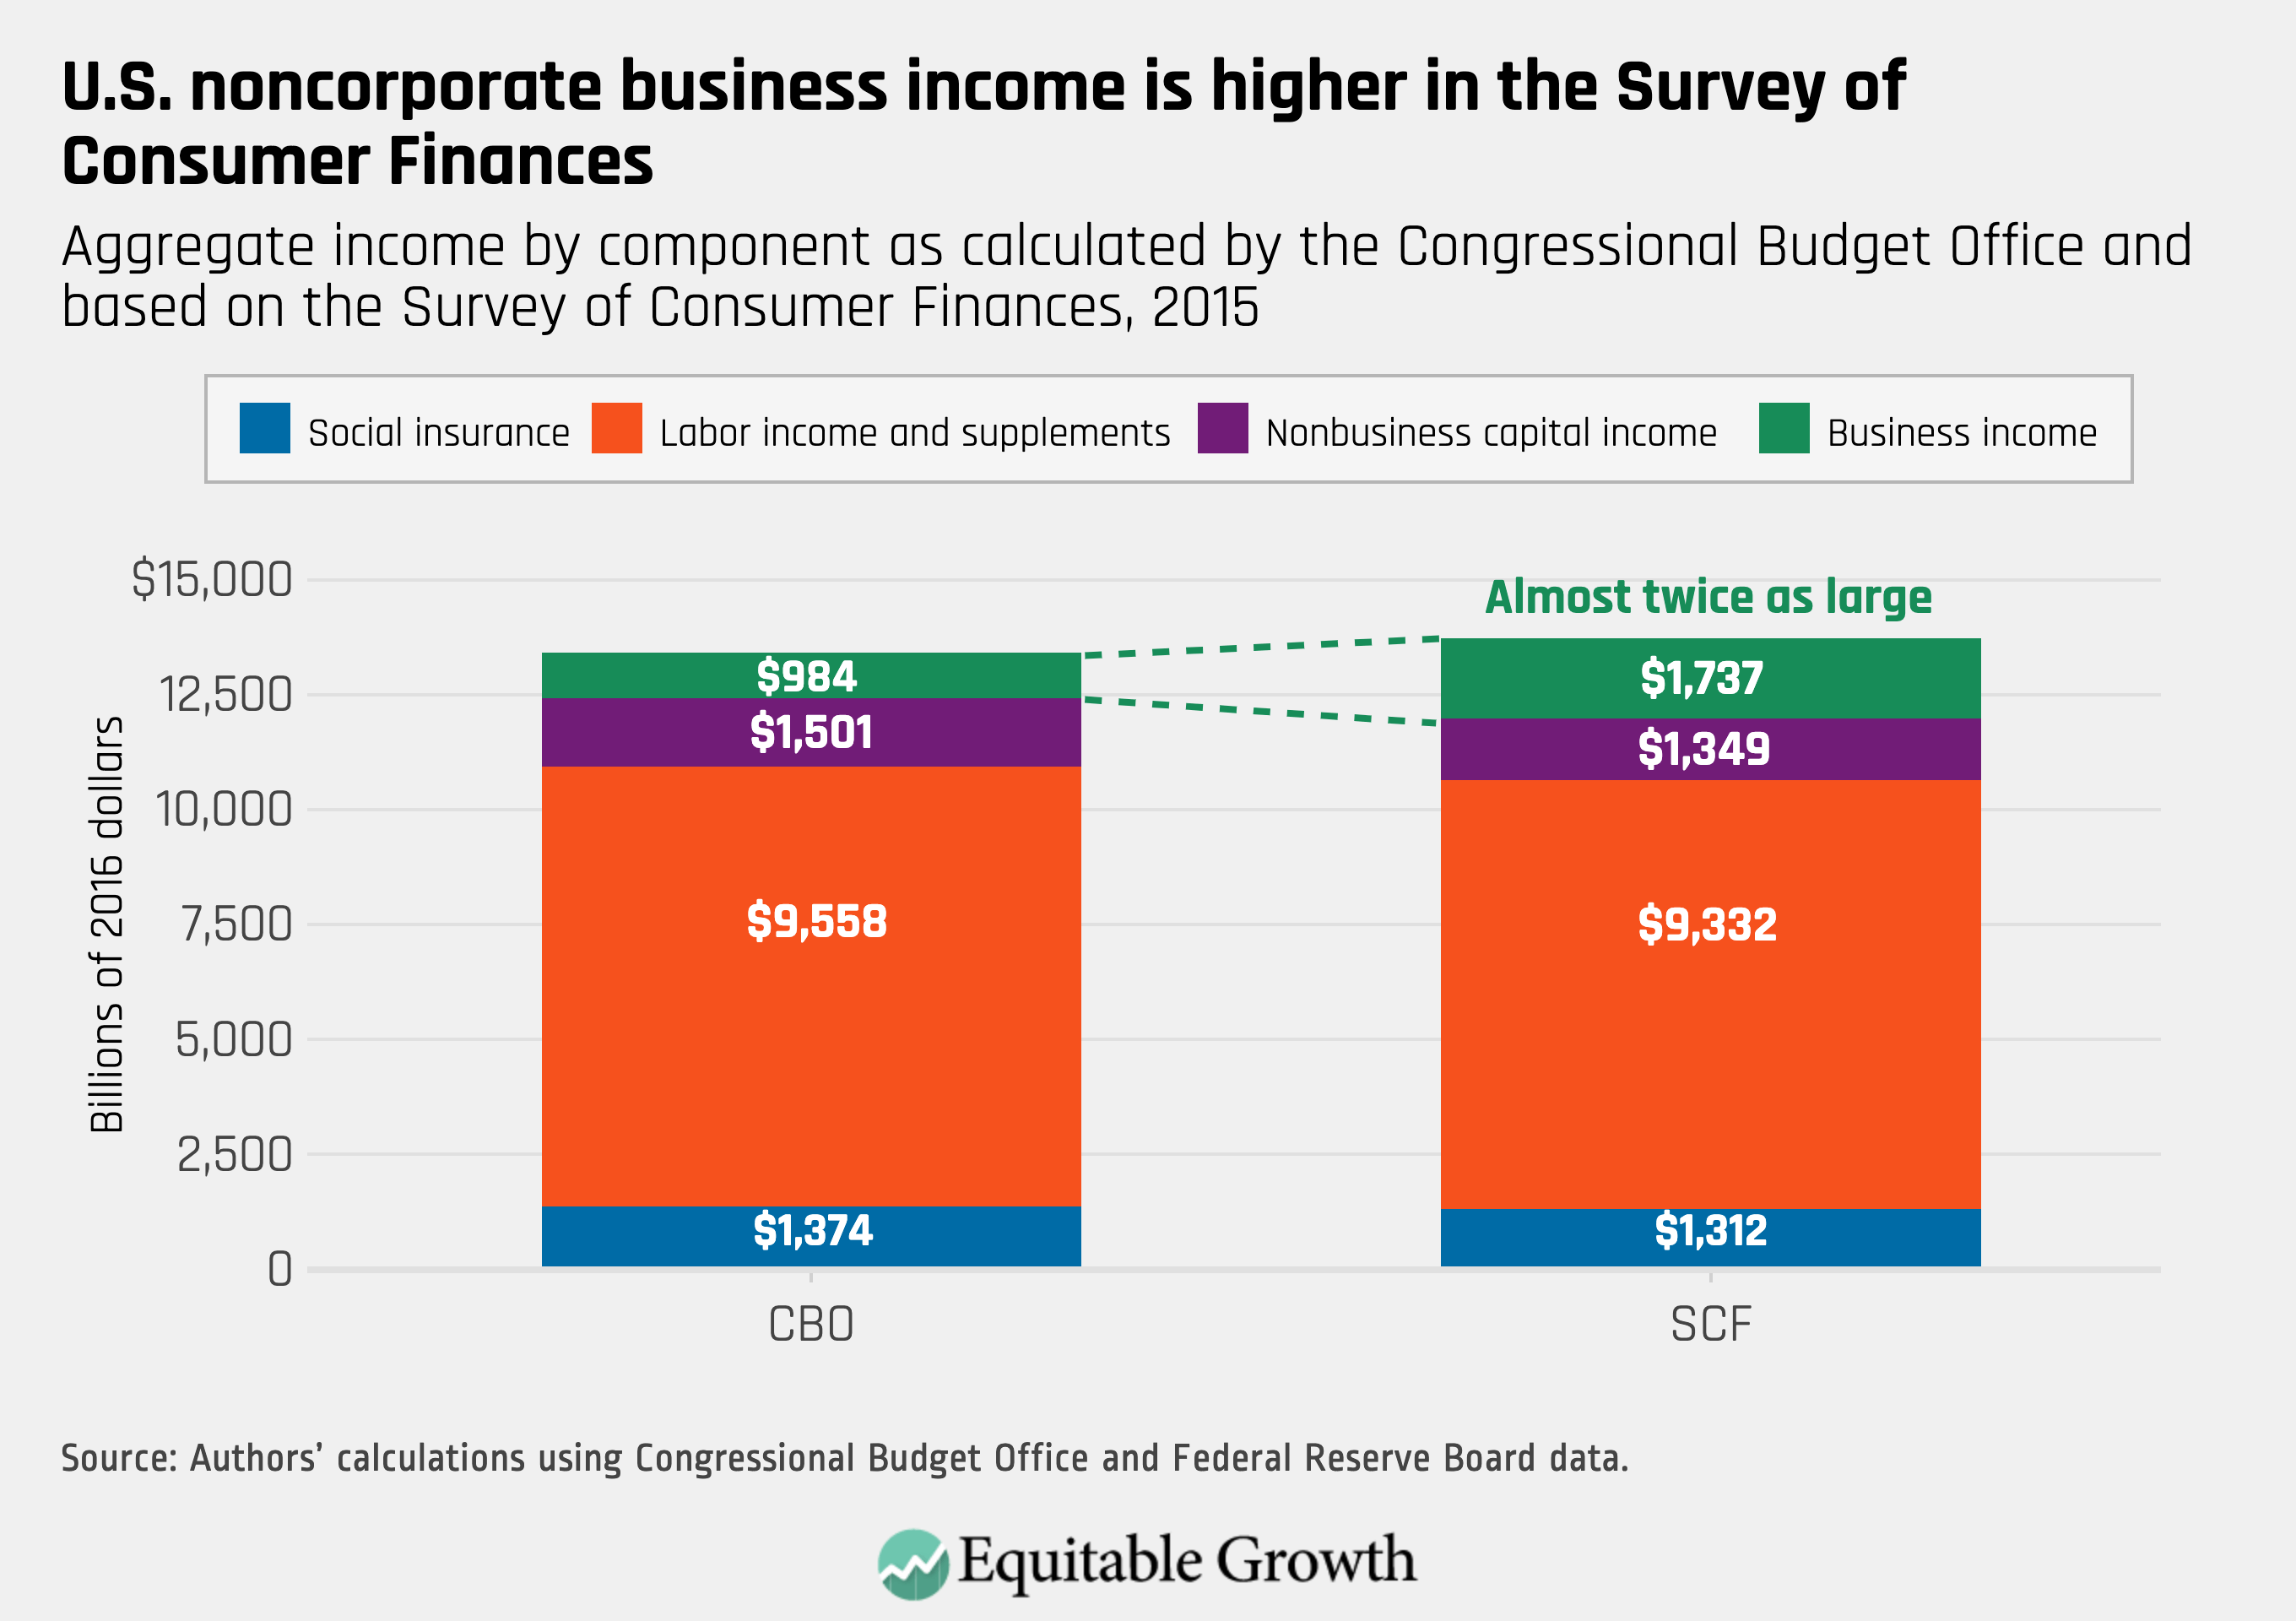
Although the data sources and methods differ, Figure 1 shows that all other SCF income components are relatively close to CBO values, after imputing unmeasured income components such as employee benefits and Medicare onto the SCF using CBO’s methods. The net effect is that total household income in the Survey of Consumer Finances is slightly higher than total household income as reported by the Congressional Budget Office, and that gap is mostly attributable to noncorporate business income.
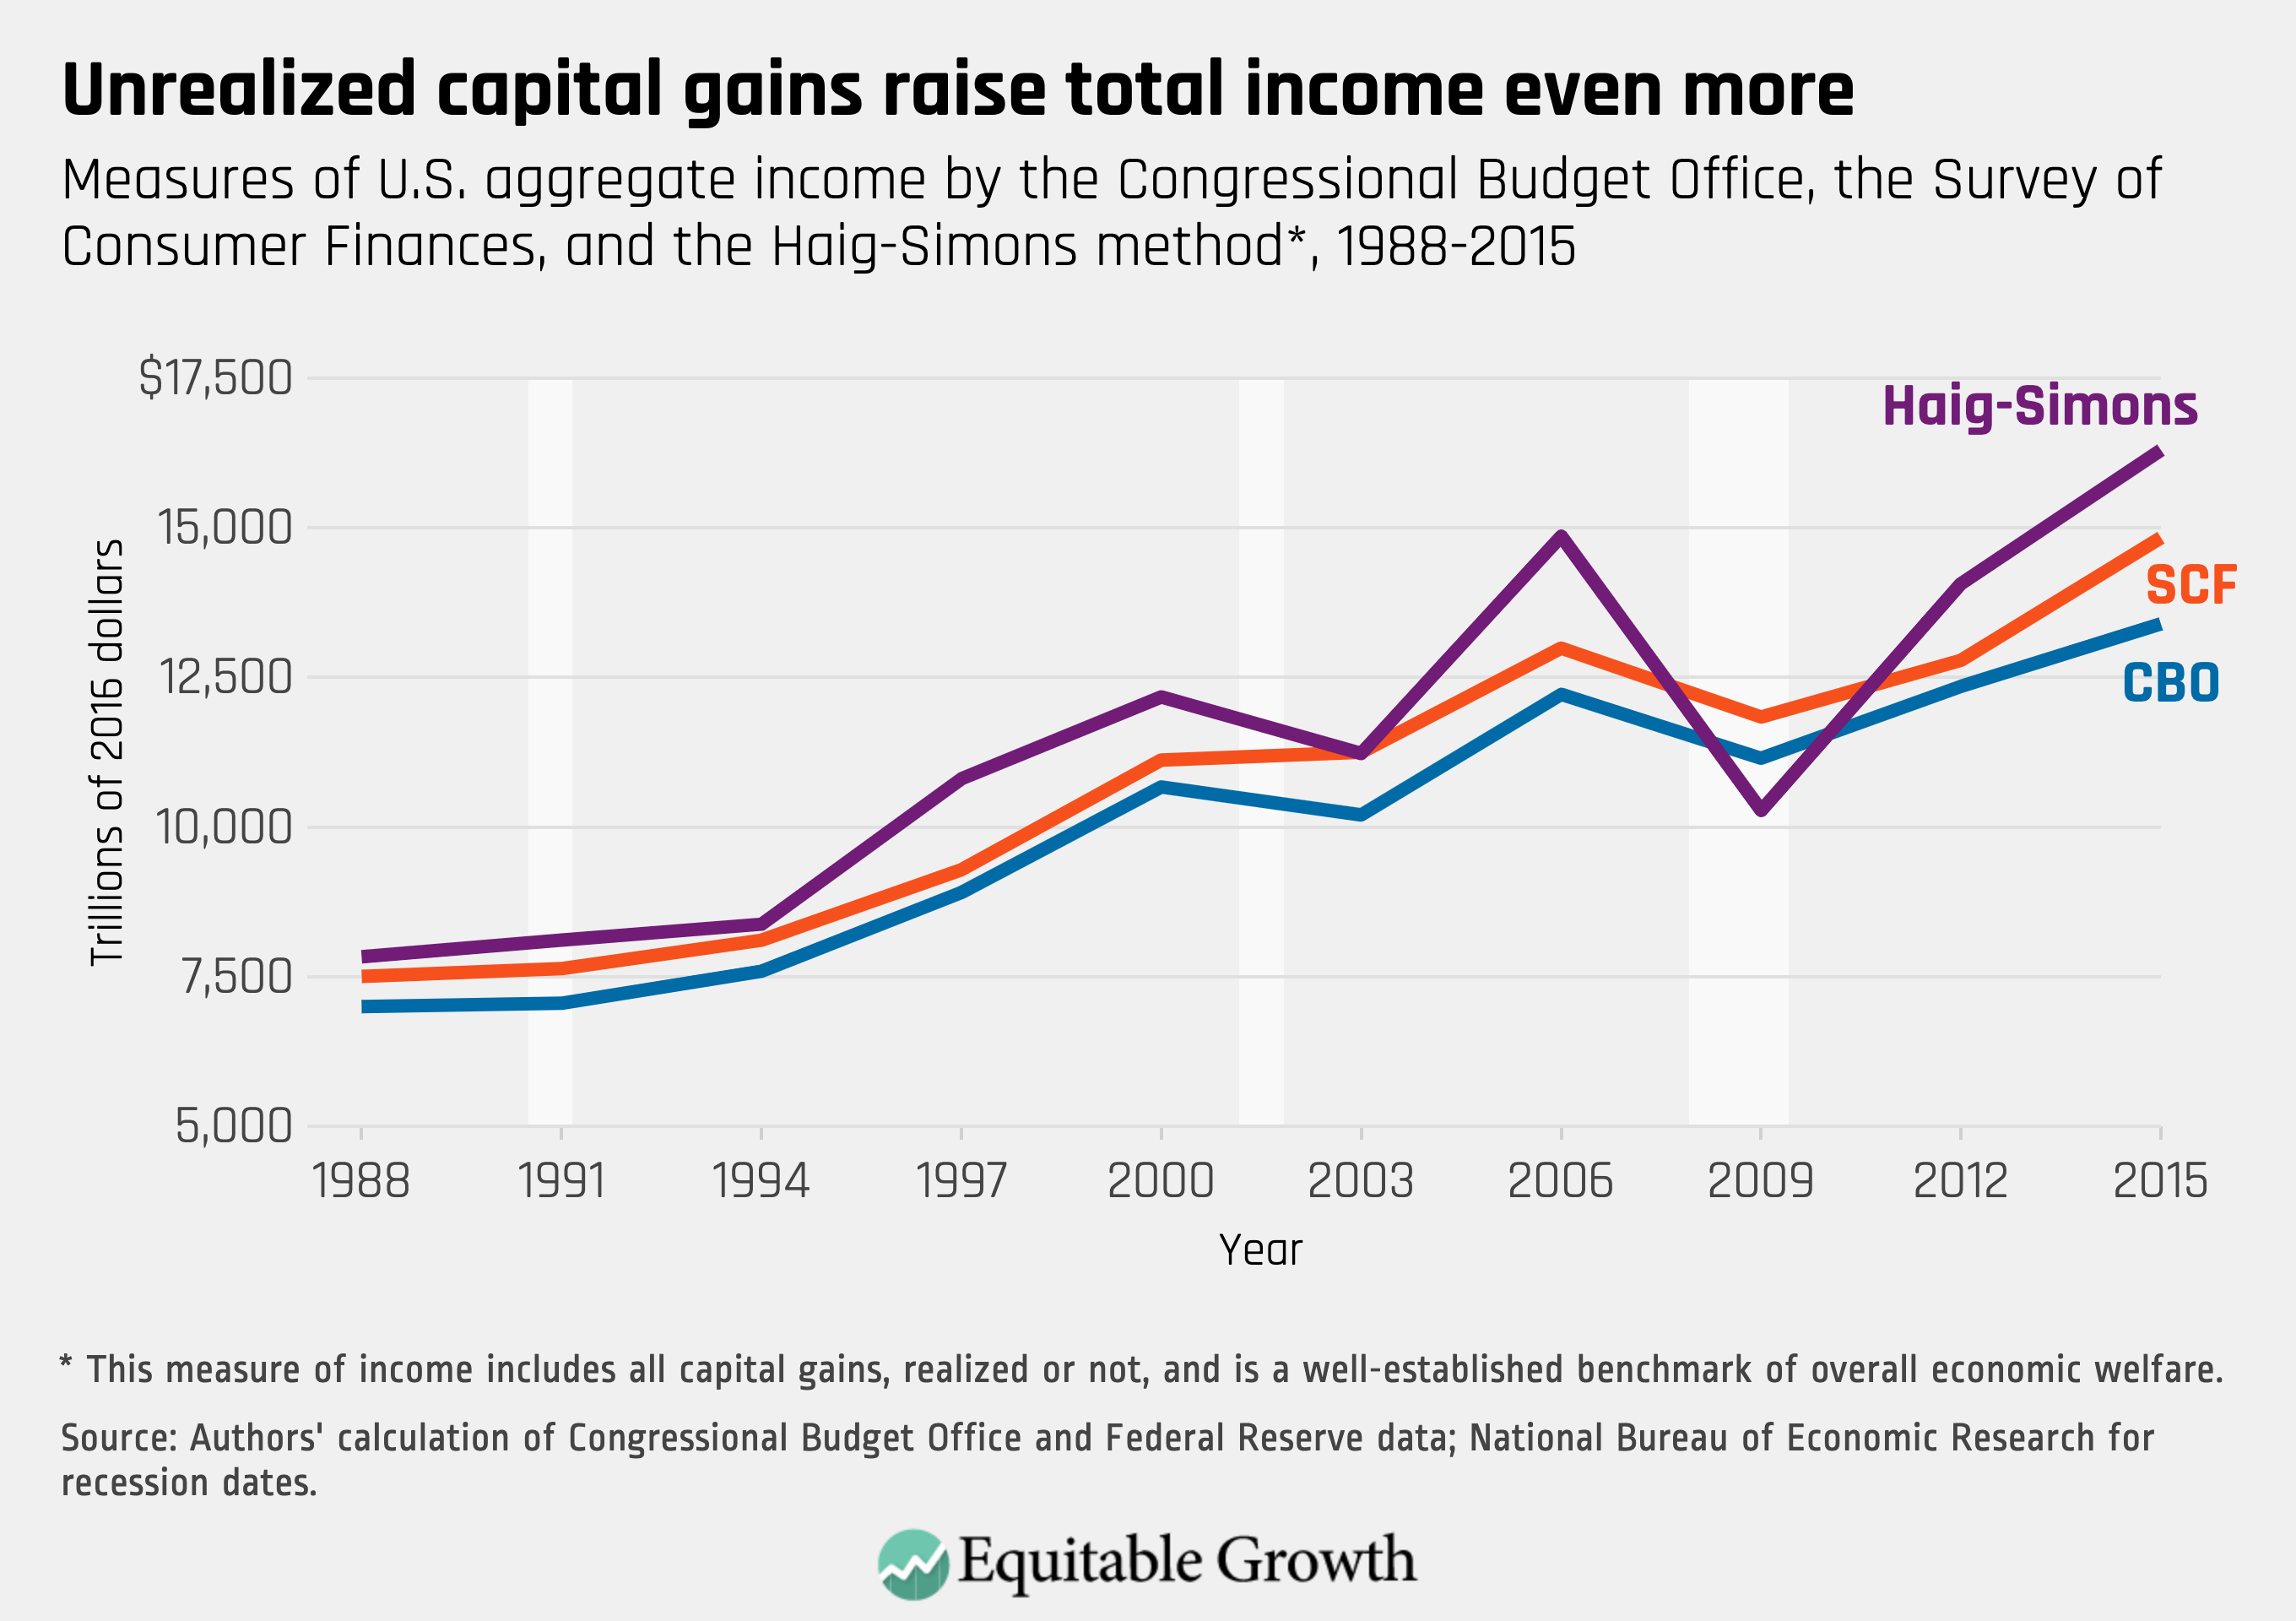
Why does the Survey of Consumer Finances find more business income than tax returns do? Some academic research views the higher levels of business income in the SCF as indicating there must be a problem with the survey.8 There is certainly scope for respondent confusion about different types of capital income, and indeed, SCF-reported nonbusiness capital income such as interest, dividends, and realized capital gains is slightly below the CBO values. On net, the extra noncorporate business income dominates, however, and overall income is noticeably higher in the SCF than reported by CBO in all years. (See Figure 2.)
Figure 2
The most likely explanation for higher business incomes in the Survey of Consumer Finances is that respondents are reporting something closer to what they truly earned in business income, and that survey-reported concept is above the values they (or their accountants) reported on their tax returns. In any case, it is difficult to imagine why SCF respondents would overreport their business incomes, especially given the accuracy of reporting for other income components. So, correcting income inequality estimates for underreported noncorporate business incomes is the first important adjustment made possible by switching from tax data to the SCF.
Capital gains income reporting
The second important adjustment made possible by using the Survey of Consumer Finances is switching from realized to total capital gains. Realized capital gains are the incomes reported for tax purposes when tax filers are required to report profitable asset sales on their tax returns. Total capital gains capture all increases in asset values, regardless of whether tax reporting is triggered. The concept of Haig-Simons income—which includes all capital gains, realized or not—is well established as the key benchmark in analysis of economic welfare. If the value of an income-producing asset goes up—meaning the owner could sell it at a higher price—then the owner has truly earned something by owning the asset, whether they sell the asset or not.
A few recent studies show the importance of capital gains in overall savings and wealth accumulation. One study shows that capital gains account for 8 percent of national income, on average, since 1980.9 Another recent paper shows that capital gains account for about 75 percent of wealth accumulation since 1995.10 Since most gains are not realized for tax purposes when they occur, we are missing a substantial part of true economic income in the tax data.
Take a look again at Figure 2. The third (purple) line shows our estimate of Haig-Simons income, which is, on average, about 6 percent higher than the SCF income measure. How do we construct Haig-Simons income? Aggregate capital gains for each type of income-generating asset in each 3-year period between SCF surveys are computed using the Financial Accounts of the United States.11 We then compute a gains ratio—aggregate gains divided by the aggregate holdings of the respective assets in the SCF—and apply that gains ratio to household assets. Each SCF household then receives the average capital gains of the 3 years prior to the survey, and that replaces their reported realized capital gains.
The consequences of missing noncorporate business income and unrealized capital gains
So, how does accounting for missing noncorporate business income and unrealized capital gains affect estimated U.S. income inequality? The answer is unambiguous because both the missing business income and unrealized capital gains are concentrated at the top of the income distribution. Income inequality is worse than policymakers probably realize. Also, because business income and capital gains are both increasing relative to other income components, income inequality is rising at a faster pace than previously understood.
There are different ways to show how accounting for the missing noncorporate business income and unrealized capital gains affects income distribution in the United States, but the simplest way is to just compare income of households in the middle of the income distribution with incomes of households near the top. (See Figure 3.)
Figure 3
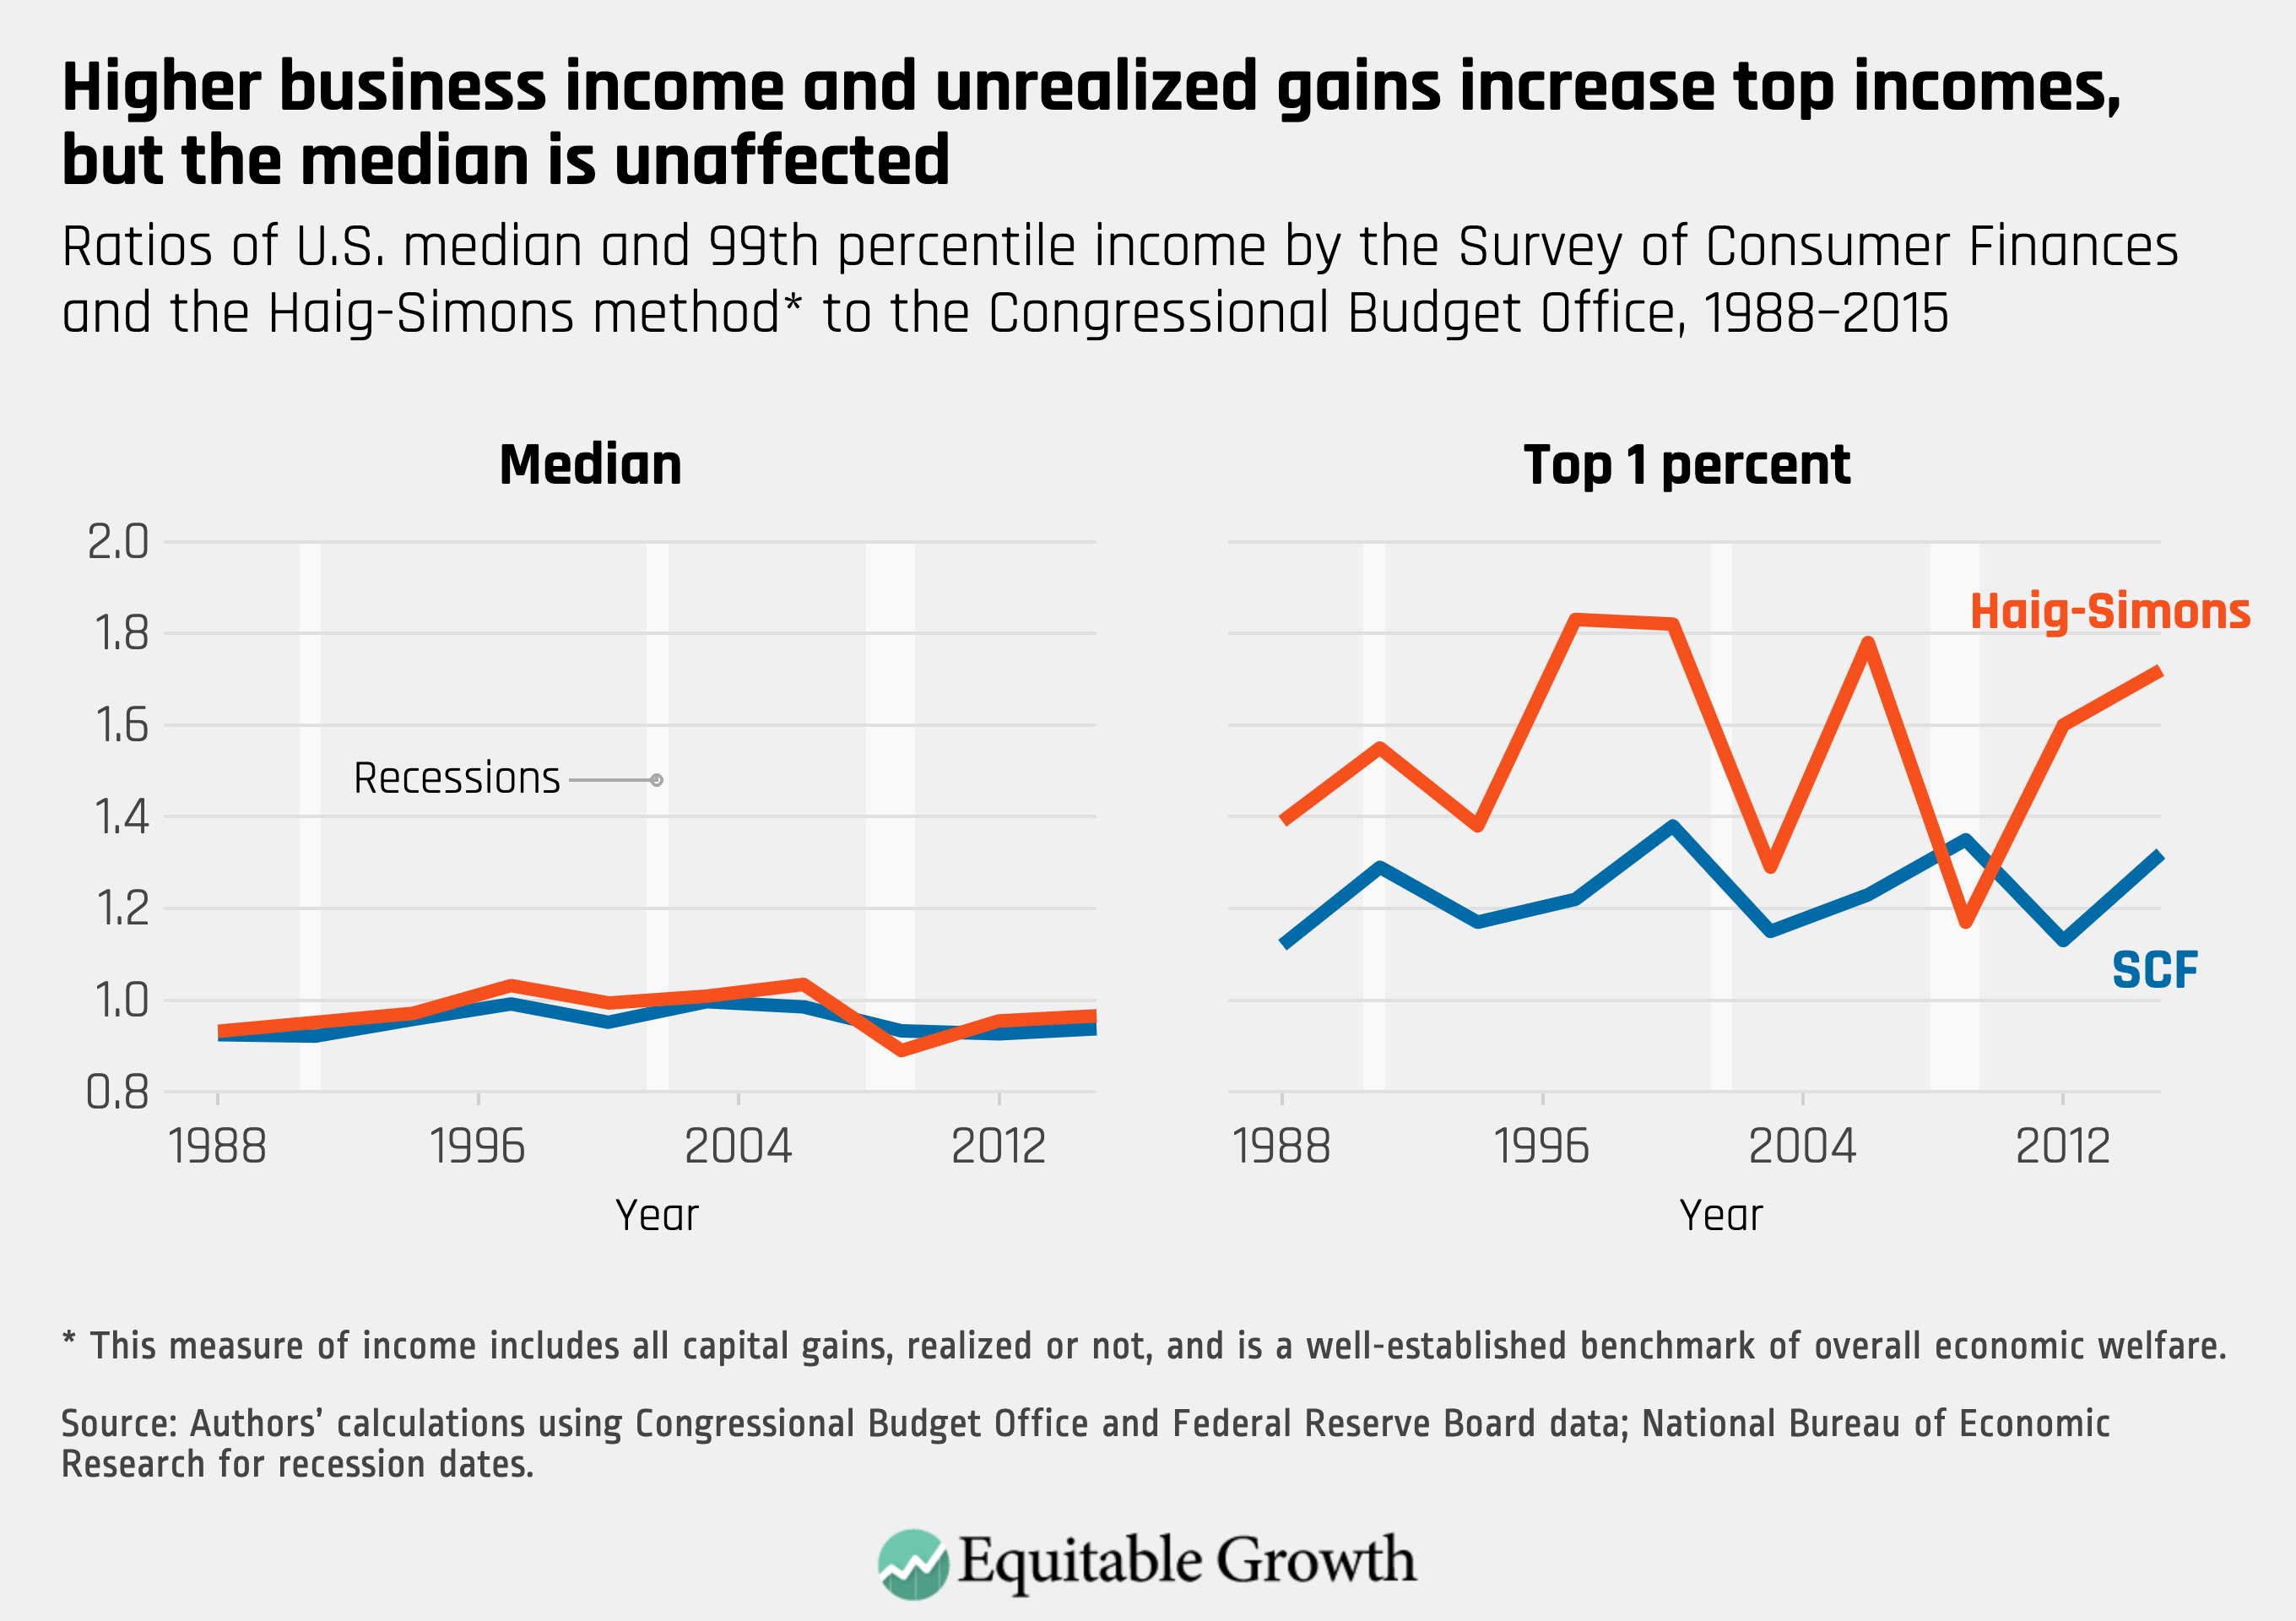
When we compare incomes for the median household, the CBO and SCF measurements look similar. The ratio of median SCF to median CBO income and the ratio of median Haig-Simons to median CBO income consistently hover around 1. Why? The median family is just as well-off using any of the three measures, because the additional business income in the SCF and unrealized capital gains do not accrue in any substantial way to the median household.
In contrast, the story is different at the top of the income distribution. Just switching from CBO to SCF source data, which takes account of the higher business incomes, raises the 99th percentile of the income distribution by about 10 percent in 1988, and the gap (although volatile) is more than 30 percent by 2015. Replacing realized capital gains with unrealized capital gains to move to Haig-Simons income pushes the 99th percentile to 40 percent above the CBO value in 1988, and (although even more volatile) that gap increases to 70 percent by 2015.
The upshot of the more comprehensive measures is that whatever your prior beliefs about the ratio of 99th percentile to median income—the P99-to-P50 ratio—you were probably too low. In the CBO reports, the P99-to-P50 ratio is 6.2 in 1988, rising to 8.3 by 2015. Figure 3 suggests the more appropriate P99-to-P50 ratio, using the Haig-Simons measure, is 9.3 in 1988, rising to 14.9 in 2015.
The capital gains adjustment we apply to the Survey of Consumer Finances comes with a caveat, but it is likely biasing our top income values down, not up. The estimates here assume that the ratio of capital gains to asset value are the same for every owner of a given asset, because we compute and apply one ratio per asset type and time period. In practice, if wealthier owners earn higher gains relative to asset values, then the ratios should increase with wealth, making income even more unequal.
Conclusion
We are not the first to focus on the role of missing noncorporate business incomes in overall U.S. income inequality.12 But we are the first to use the Survey of Consumer Finances in a head-to-head comparison against tax data to pinpoint where in the income distribution that missing income can be found—rather than assume, for example, that it is simply underreported income of otherwise low-income families or proportional to reported taxable income. Also, others have estimated Haig-Simons income distributions, but come to very different conclusions about the impact of levels and trends on inequality.13
Our answer differs because we use the actual joint distribution of income and wealth, then recompute the income distribution with the more comprehensive income measure. Our results push the pendulum in the ongoing U.S. income inequality debate back toward the “high and rising” conclusion.
More importantly, proper accounting for noncorporate business income and unrealized capital gains helps us understand the connection between income and wealth dynamics. It is difficult to explain high and rising U.S. wealth concentration with available income measures because the very wealthy would have to be saving at an unbelievably high rate to accumulate that much wealth. Acknowledging that there is a lot more unmeasured income at the top of the distribution makes that puzzle less challenging.
—John Sabelhaus is a visiting scholar at the Washington Center for Equitable Growth, where he has been since 2019. Prior to that, he was assistant director in the Division of Research and Statistics at the Board of Governors of the Federal Reserve System. Somin Park is the research assistant to the president and CEO at the Washington Center Equitable Growth and will be a student at Harvard Law School starting in the fall of 2020.
End Notes
1. Austin Clemens, “Progress toward Consensus on Measuring U.S. Income Inequality,” Washington Center for Equitable Growth Value Added blog, January 16, 2019, available at https://equitablegrowth.org/progress-toward-consensus-on-measuring-u-s-income-inequality/.
2. Thomas Piketty and Emmanuel Saez, “Income Inequality in the United States, 1913–1998,” The Quarterly Journal of Economics 118 (1) (2003): 1–39.
3. Gerald Auten and David Splinter, “Income Inequality in the United States: Using Tax Data to Measure Long-Term Trends.” Working Paper (2019), available at http://davidsplinter.com/AutenSplinter-Tax_Data_and_Inequality.pdf.
4. Congressional Budget Office, “The Distribution of Household Income, 2016” (2019), available at https://www.cbo.gov/publication/55413.
5. Board of Governors of the Federal Reserve System, “Survey of Consumer Finances (SCF)” (2017), available at https://www.federalreserve.gov/econres/scfindex.htm.
6. U.S. Bureau of Economic Analysis, “National Income and Product Accounts” (n.d.), Table 2.1 Personal Income and Its Disposition, available at https://apps.bea.gov/iTable/iTable.cfm?reqid=19&step=2#reqid=19&step=2&isuri=1&1921=survey.
7. Auten and Splinter, “Income Inequality in the United States: Using Tax Data to Measure Long-Term Trends,” 21.
8. Anmol Bhandari and others, “What Do Survey Data Tell Us about U.S. Businesses?” (Minneapolis, MN: Federal Reserve Bank of Minneapolis, 2020), available at https://doi.org/10.21034/sr.568.
9. Jacob A. Robbins, “Capital Gains and the Distribution of Income in the United States.” Working Paper (2018), available at https://www.jacobarobbins.com/jr_inequ_jmp.pdf.
10. Laura Feiveson and John Sabelhaus, “Lifecycle Patterns of Saving and Wealth Accumulation.” Finance and Economics Discussion Series 2019–010 (Board of Governors of the Federal Reserve System, 2019), available at https://doi.org/10.17016/FEDS.2019.010r1.
11. Board of Governors of the Federal Reserve System, “Financial Accounts of the United States – Z.1” (n.d.), available at https://www.federalreserve.gov/releases/z1/.
12. Auten and Splinter, “Income Inequality in the United States: Using Tax Data to Measure Long-Term Trends.”
13. Philip Armour, Richard V. Burkhauser, and Jeff Larrimore, “Levels and Trends in U.S. Income and Its Distribution: A Crosswalk from Market Income towards a Comprehensive Haig-Simons Income Approach,” Southern Economic Journal 81 (2) (2014): 271–93, available at https://doi.org/10.4284/0038-4038-2013.175.