Progress toward consensus on measuring U.S. income inequality
A panel discussion at the annual meeting of the American Economic Association earlier this month in Atlanta highlighted recent research on the measurement of income and inequality in the United States. Research that is purely about measurement is relatively uncommon in academic circles, but income measurement has attracted widespread interest for good reason: Rising inequality means that the existing tools we have to track incomes in the economy are not as accurate as they once were.
The panel discussion featured four research teams and their respective data series. Although in some respects the research teams found broadly similar trends in the U.S. economy, there are some significant differences. This diversity of opinion may be confusing to the noneconomist but can be boiled down to two accounting choices. The first is choosing an income concept. And the second is making assumptions about how to distribute income where it is not directly evident in the data.
Why estimates of income inequality differ
Choosing an income concept simply means choosing what will be included in the measurement of income. This may seem simple, but consider your own income. You may have a salary, or wages, but these may not be inclusive of all the money you earn. If you are thinking of your salary, consider that your employer may be making contributions to your 401(k) that are not reflected in your base salary. Likewise, if you have health care, your employer is probably paying for some portion of it, but this also is not generally thought of as salary. But there are other sources of income that most workers never have to consider such as the retained earnings held by corporations.
Representatives on the panel from the Organisation for Economic Co-operation and Development presented the OECD’s own data series, which targets disposable income, while the team from the U.S. Bureau of Economic Analysis presented their data series targeting the bureau’s own measure of personal income. The other two research teams are targeting the same income concept—National Income—which is an aggregate measure of economic output similar to Gross Domestic Product (National Income is GDP plus net income from abroad less depreciation).
This method of decomposing National Income is the approach taken by Gerald Auten at the U.S. Treasury Department’s Office of Tax Analysis and David Splinter at the congressional Joint Committee on Taxation, whose data series shows virtually no increase in inequality in the United States since 1960. This also is the approach taken by Thomas Piketty at the Paris School of Economics and Emmanuel Saez and Gabriel Zucman at the University of California, Berkeley, which, in contrast, finds that the increase in income inequality over that period was significant.
(See Figure 1, which shows the series produced by each of these two teams and includes the after-tax-and-transfer series—transfers being government programs such as Supplemental Nutrition Assistance and the Earned Income Tax Credit—produced by the Congressional Budget Office for comparison from the 2015 supplementary tables for after tax-and-transfer income, ranked by income after taxes and transfers.)
Figure 1
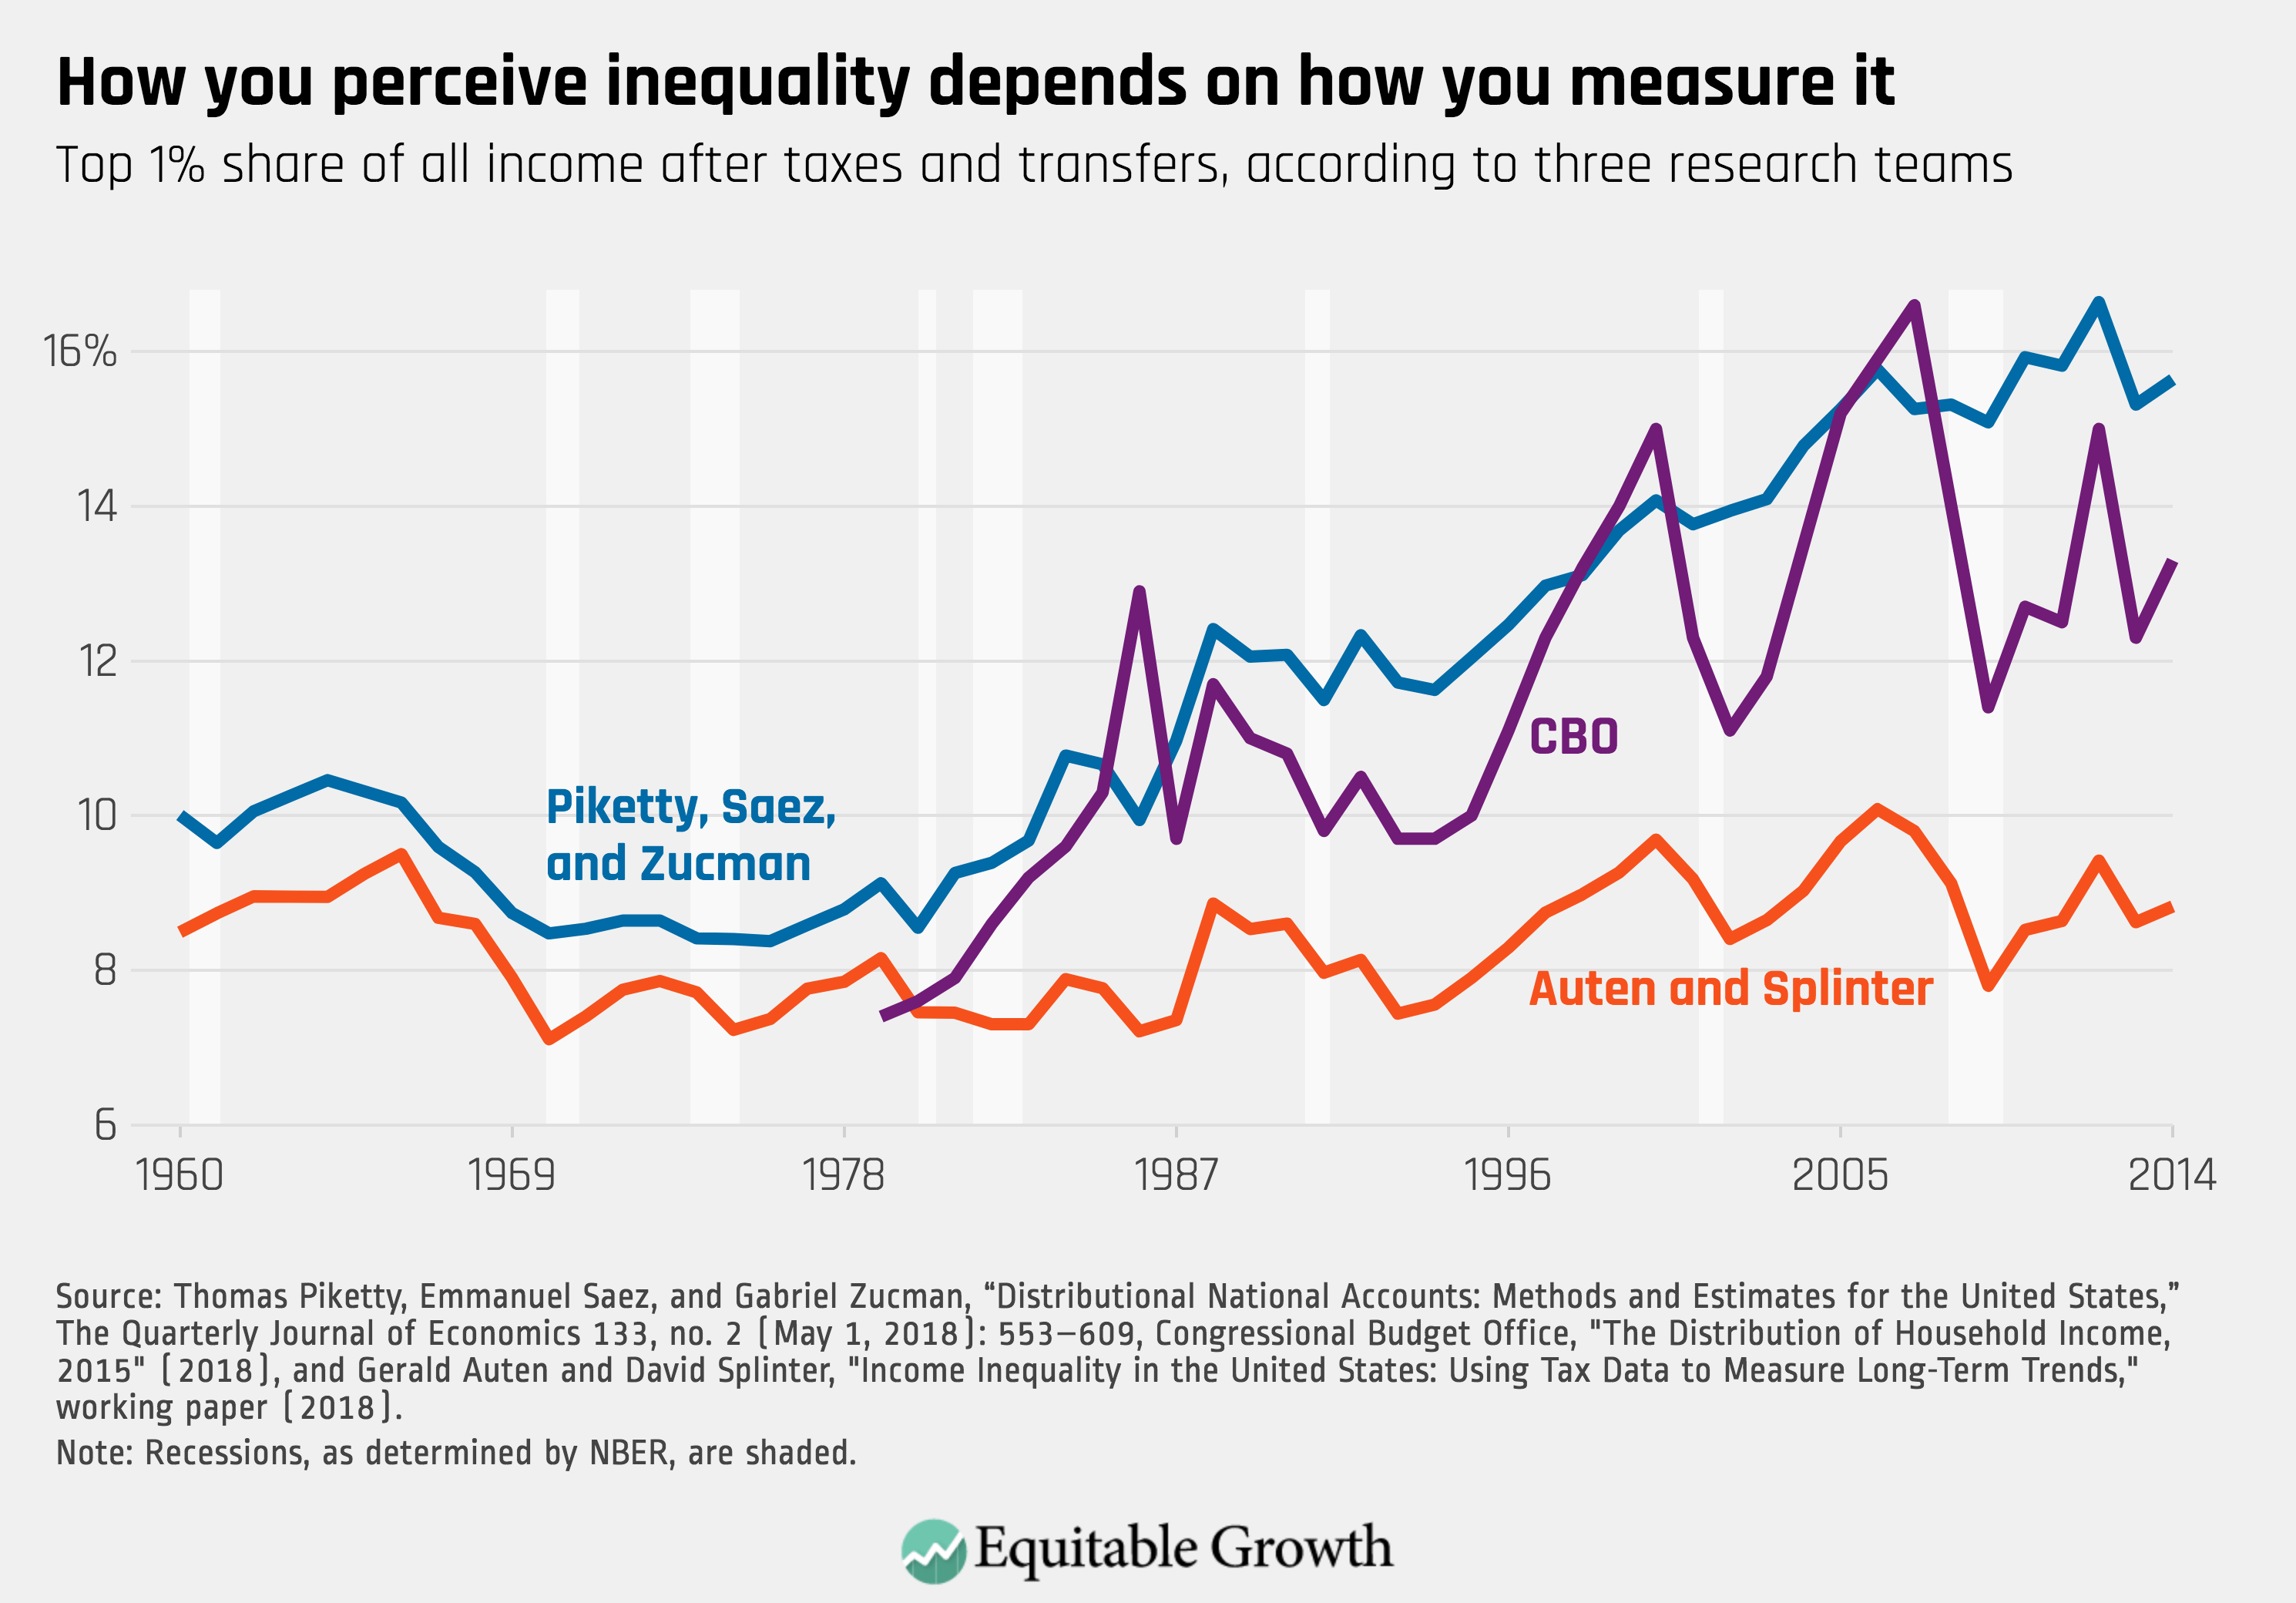
All of the data series in Figure 1 attempt to quantify changes in income inequality after taxes and transfers are applied. CBO’s income concept excludes some income that the other two include, but the two research teams targeting National Income arrive at very different conclusions about inequality despite targeting the same pots of income.
The reason they diverge is that a number of assumptions must be made about income in the economy that we do not observe directly. One of the largest discrepancies between the two series is the way the researchers treat income that is underreported by taxpayers due to tax evasion. Assumptions have to be made about how to distribute that income among Americans, and those decisions can have significant effects on the resulting data. A clear implication from the panel discussion is that there are still differences of opinion about both the appropriate income concept for measuring income inequality and in establishing distributional assumptions about untaxed income.
But there are significant areas of agreement as well. As Figure 1 shows, both CBO and the research team of Piketty, Saez, and Zucman find very similar trends in the rise of inequality. The Bureau of Economic Analysis has only made calculations for 2 years (so the data was not included in Figure 1), but the BEA estimates that in 2012, the top 1 percent of households held 13.1 percent of all U.S. income—relatively close to the CBO’s estimate of 15 percent and Piketty, Saez, and Zucman’s estimate of 16 percent. The OECD has yet to release its own data series.
In contrast, Auten and Splinter’s data series shows that after accounting for taxes and transfers, incomes fluctuated, but the distribution of that income has been largely consistent since 1960. Their findings are an outlier. Still, it is encouraging that even though many decisions go into the calculation of these data series, most teams show largely consistent trends in income inequality. The levels of inequality, though less consistent, are also relatively close in magnitude. That so many different teams are working on this measurement issue is a testament to the urgency of understanding economic inequality and an encouraging sign of academic interest in resolving some of the outstanding measurement differences.
Short versions of all four papers presented earlier this month in Atlanta will be included in ASSA’s May issue of Papers and Presentations. For a primer on the importance of understanding the distribution of income in the United States, see our project page “Disaggregating Growth,” where you will find a selection of materials to understand how the economy is performing for Americans of different income levels, different regions of the country, and more.