In an age of inequality, aggregate and mean economic statistics don’t tell us enough

The U.S. Census Bureau today released its report on “Income and Poverty in the United States for the year 2017.” This is one of the most important economic data releases of the year because it goes way beyond the usual summary statistics released by federal government agencies every month (think: unemployment, inflation, Gross Domestic Product growth) and provides statistics that are more meaningful to the average person and statistics that are disaggregated by age, gender, income, race, geographic region, and more.
One of the most important data points we get from this report is median income growth for U.S. households. This is a key indicator of how the economy is performing for a broad swatch of families. A lot of pundits and policymakers tend to focus on GDP growth as an indicator of economic progress, but GDP growth is best understood as measuring mean progress for the economy. As income inequality grows, the mean is being pulled up by high-income people and is no longer representative of the fortunes of most Americans. In contrast, a median measure makes much more sense in an economy with high inequality. (See Figure 1.)
Figure 1
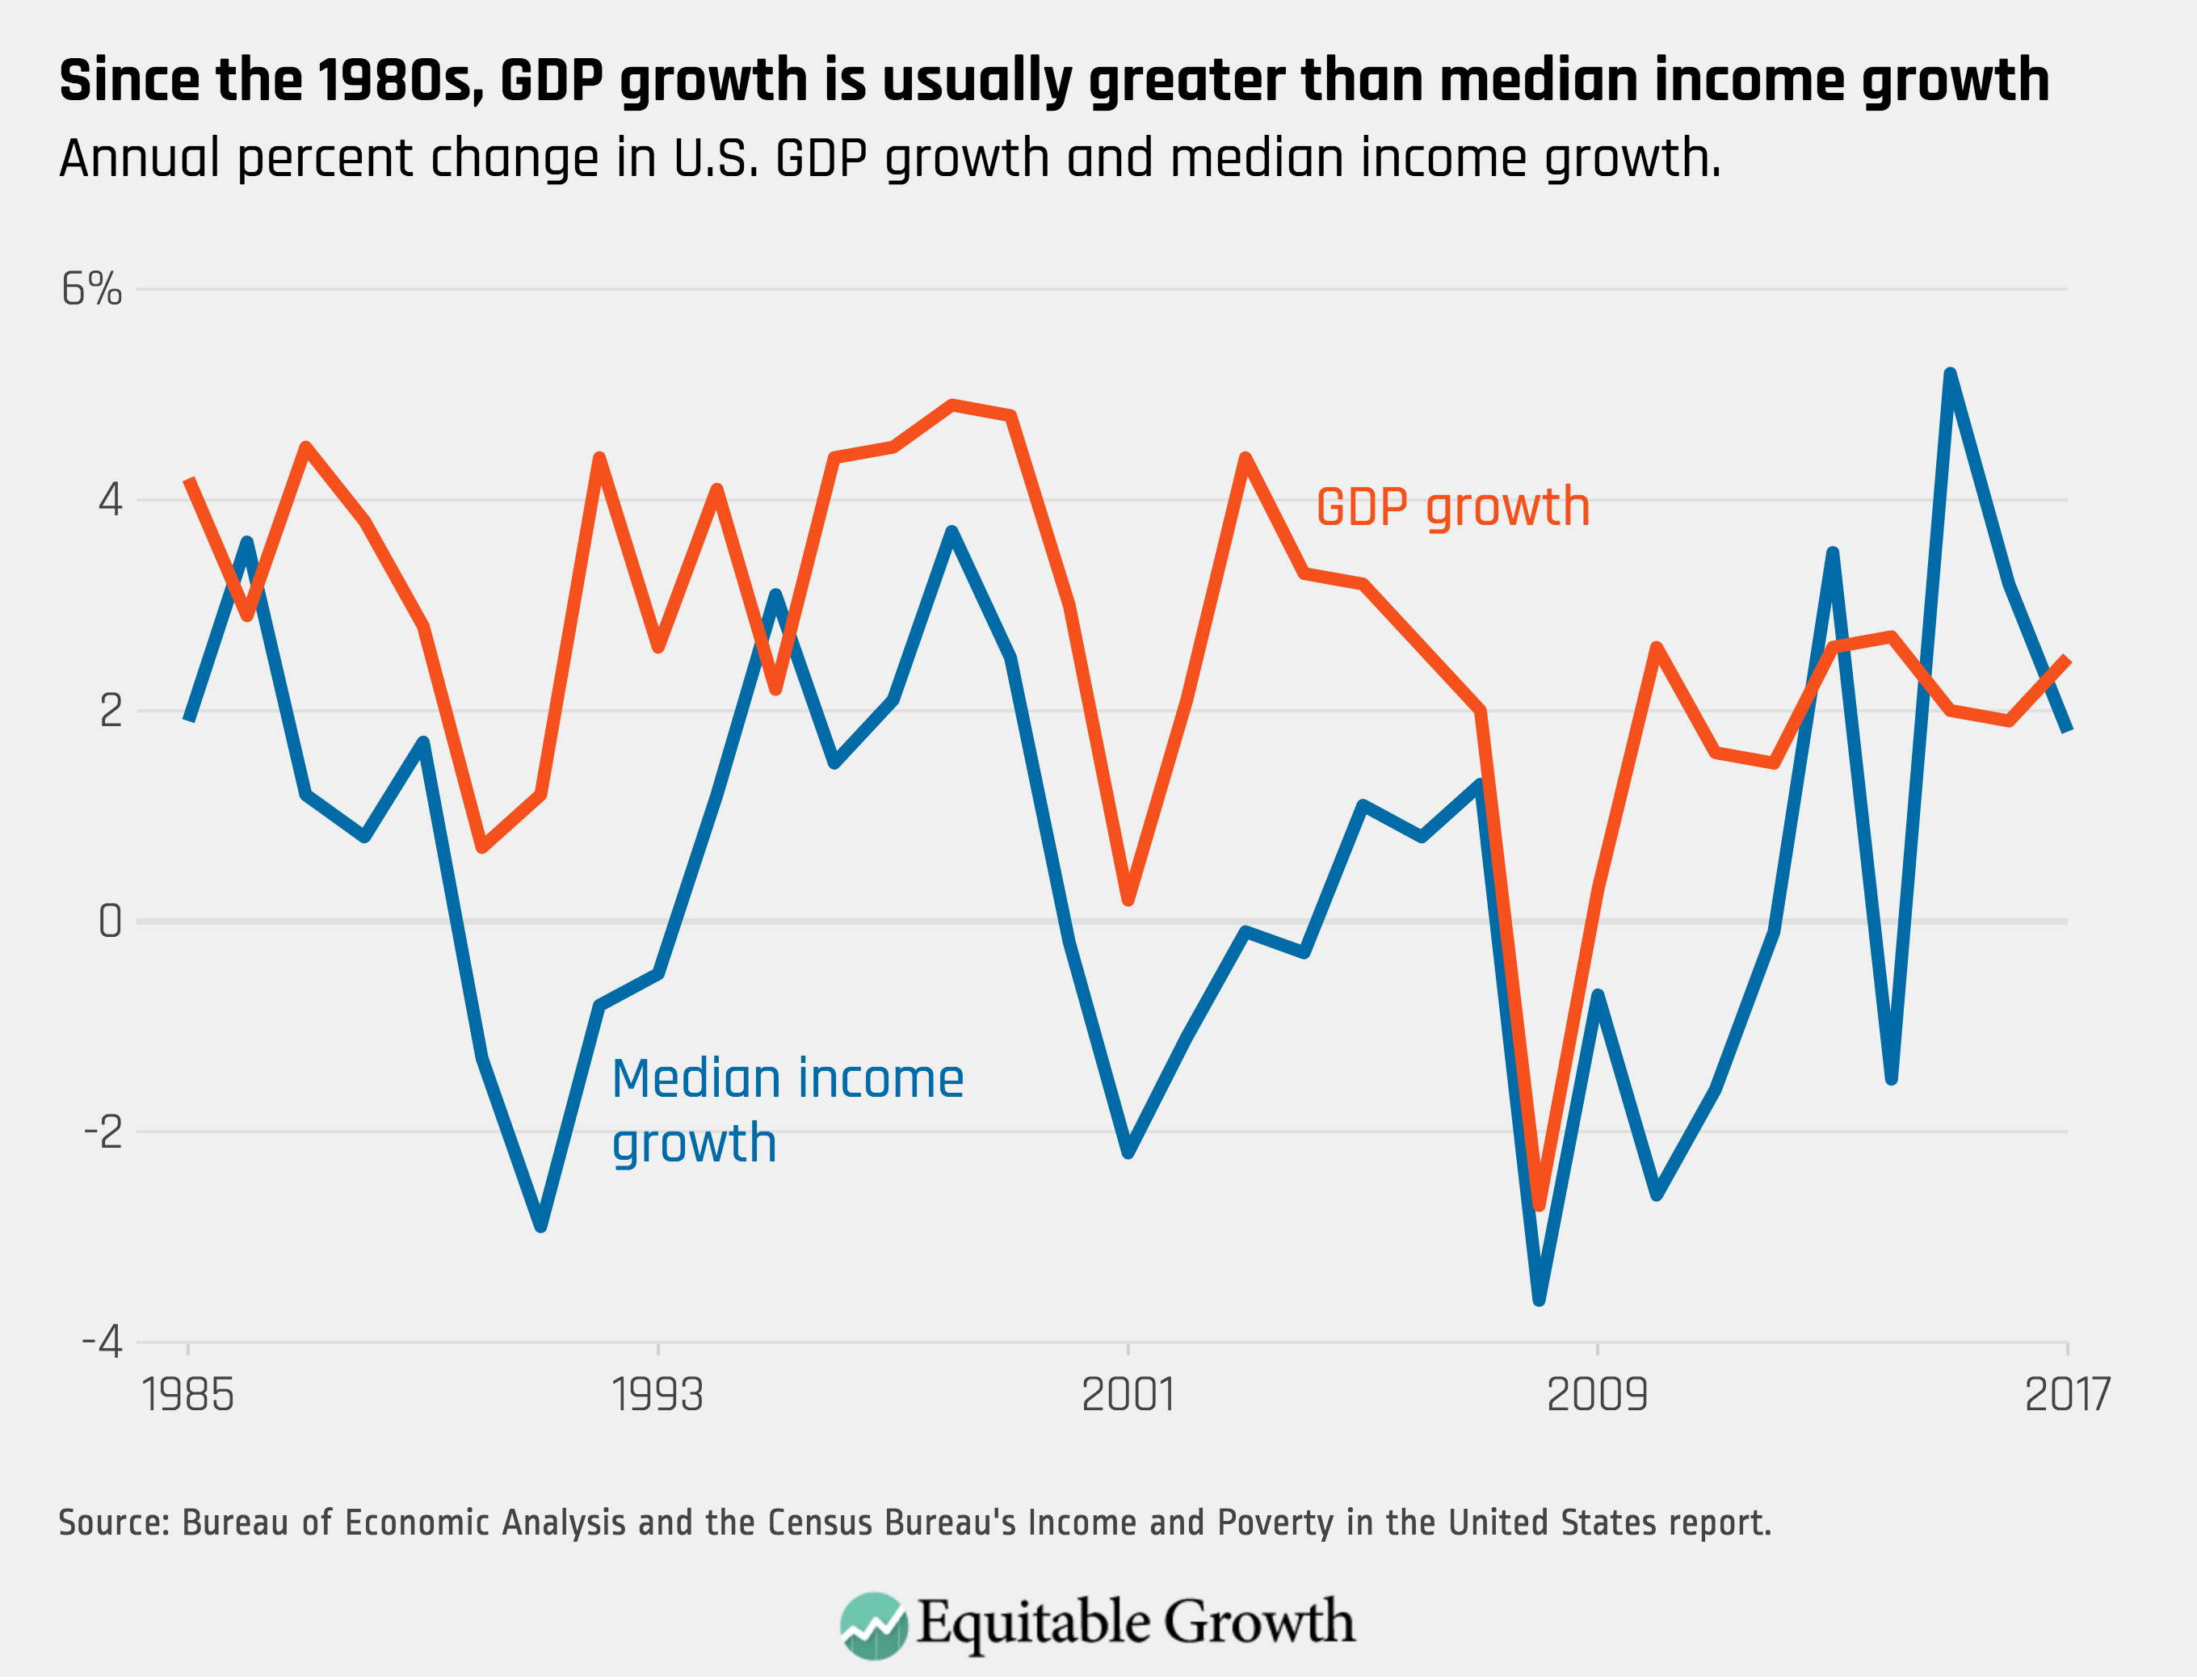
Figure 1 plots annual GDP growth against annual median income growth. This comparison isn’t apples to apples because GDP measures total economic output, which is a different concept from income, but the chart shows how using GDP growth as a one-number summary of economic progress overstates the gains to an average person in the economy. After two years where median income growth outpaced GDP growth, it dipped under GDP growth this year, indicating that the economy may be tilting back towards favoring those with high-income. In 2015 the Census reported that income growth at the median outpaced income growth at the 95th percentile of income, but they were roughly even in 2016 and this report indicates significantly higher growth of 3.2 percent at the 95th percentile against just 1.8 percent for the median.
Income inequality is also the reason that disaggregated statistics matter. In addition to the median income for all households, today’s report from the U.S. Census Bureau documents, for example, median incomes for Hispanic households, households with occupants 65 years and older, households in the Midwest, and households outside of metropolitan areas. All of these are useful ways to think about how our economy is performing not just for the average person but for specific populations that policymakers and academics alike need to get a bead on to better understand how economic inequality affects economic growth. I have argued that we should disaggregate the reporting of GDP growth so we can understand who prospers when the economy grows.
But we don’t need to stop there. As income inequality increases and we increasingly see two Americas—one for the rich and one for everyone else—it is more important than ever to see more granular breakdowns of our important economic statistics.
Case in point: Thanks to reports such as this one and from disaggregated unemployment statistics from the Bureau of Labor Statistics, the data show that African Americans face a very different economy than white Americans. And Equitable Growth grantee Xavier Jaravel found that even inflation varies significantly according to whether you are rich or poor, with low-income consumers experiencing inflation that is 0.65 percent higher than those with high income. (See Figure 2.)
Figure 2
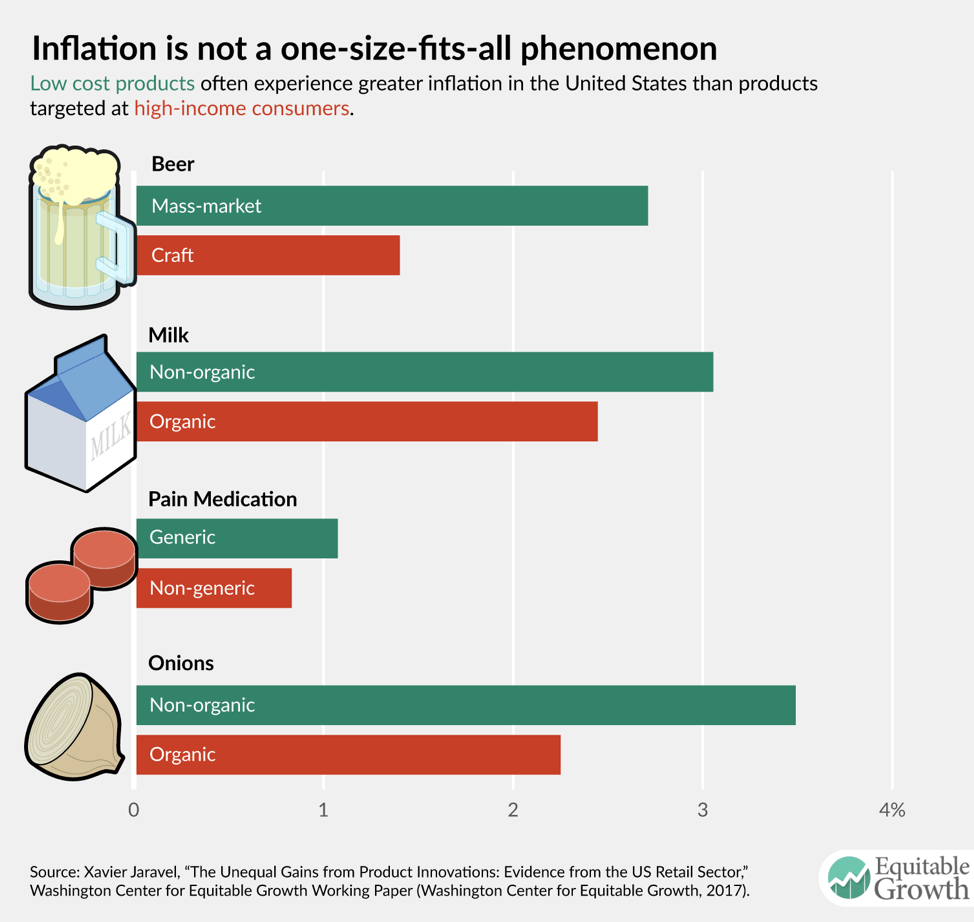
Having disaggregated measures of inflation growth are arguably critical to policy: Inflation is used to index supplemental nutrition assistance benefits, for example, and Jaravel’s results indicate that these adjustments may be too small.
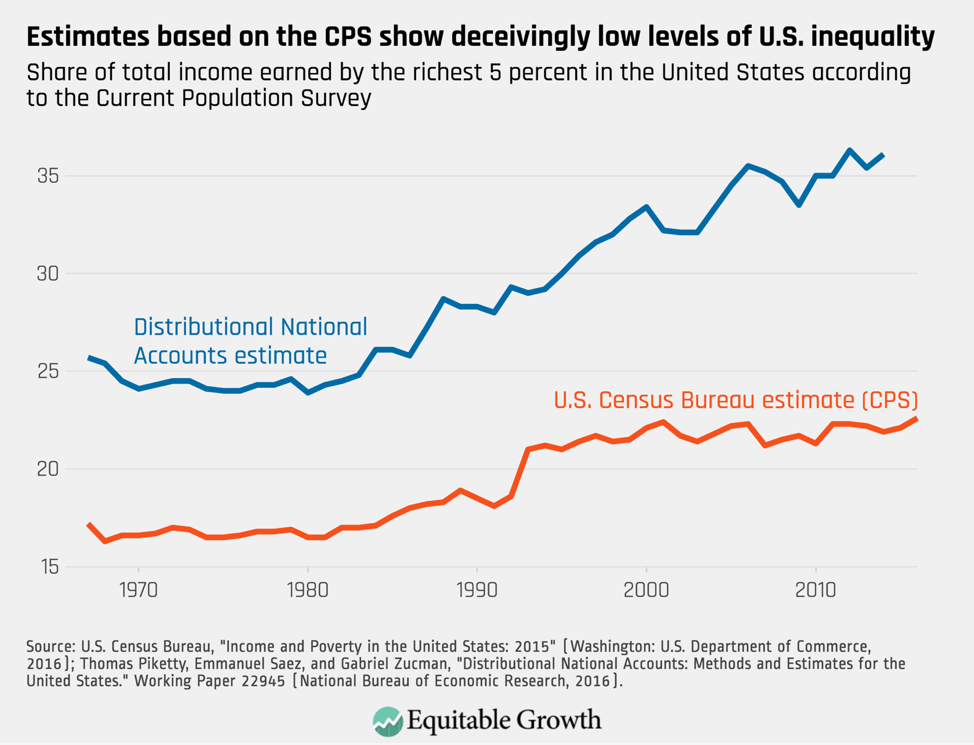
The surveys that are used in today’s Census Bureau report—the Current Population Survey and the American Community Survey—are enormously important because they make it possible for our statistical agencies to produce reports such as this one and because they democratize economic analysis by providing raw survey data publicly. Unfortunately, survey rates are declining, and the surveys are ill-suited to certain aspects of our modern economy. As I have explained before, the estimates of income inequality made in today’s report are not particularly reliable because the survey does not contact high-income households. (See Figure 3.)
Figure 3
Moving forward, agencies such as the Census Bureau, the Bureau of Labor Statistics at the U.S. Department of Labor, and the Bureau of Economic Analysis at the U.S. Department of Commerce will have to make broader use of administrative data from the Internal Revenue Service and elsewhere. But today’s report is an example of the kind of official statistical reporting about the economy that policymakers should aspire to produce more frequently. In an era of high income inequality, disaggregating U.S. economic statistics is the right way to understand who exactly the U.S. economy serves best and who it serves least.