Latest official estimates underreport extent of inequality in the U.S.

The release today of the U.S. Census Bureau’s annual report on income and poverty underscores why better official measures of economic inequality are sorely needed. Official measures released by the Census Bureau and based on the Current Population Survey underreport the level and trend of inequality. The federal government should follow the lead of academic economists who are taking a more rigorous approach to measuring income—an approach that has allowed them to detect rapid increases in the income of very high earners that the federal government’s statistics have missed.
To be sure, the Census Bureau’s annual report for 2016 is one of the most high-profile official products of the federal government that attempts to quantify economic inequality. These estimates are calculated using the Annual Social and Economic Supplement of the Census’ Current Population Survey. The CPS is one of the best sources of economic data available on the earnings of U.S. workers, but it has limitations and cannot be relied on to estimate incomes at the very top of the income distribution.
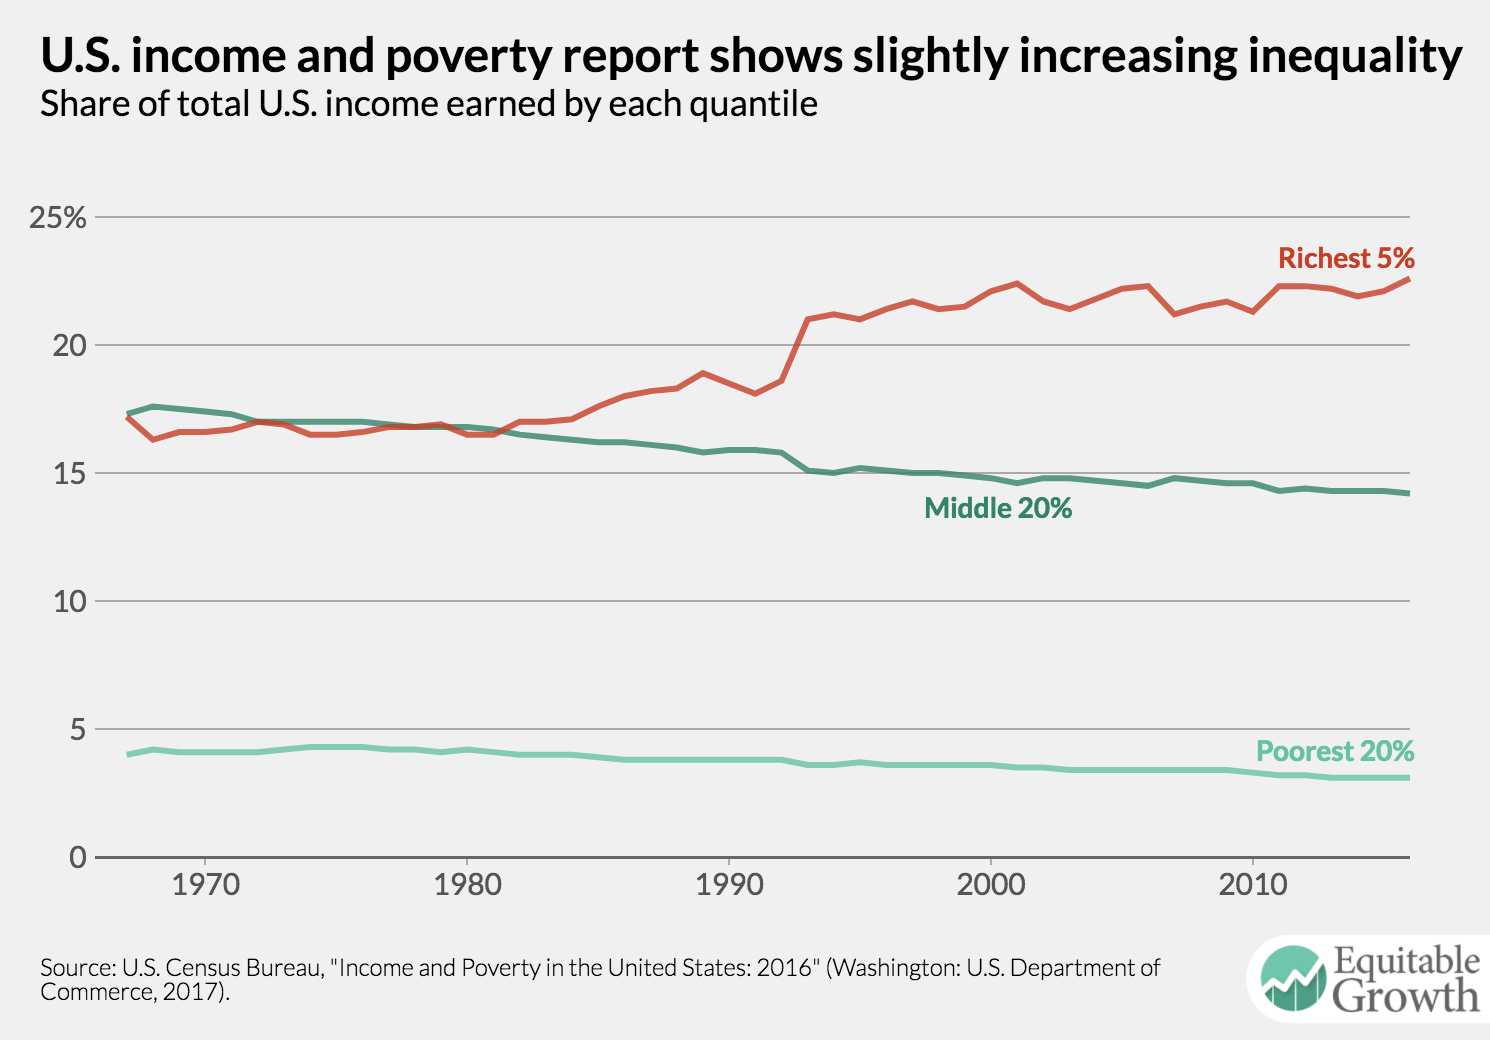
According to today’s data, the share of income earned by the poorest 20 percent of Americans declined from about 4 percent of the total in 1967 to 3.1 percent in 2016. The middle 20 percent clearly lost ground over the same period of time. And there was a relatively modest rise in the share of income taken by the richest 5 percent of the population: from 17.2 percent in 1967 to 22.6 percent in 2016 (see Figure 1).
Figure 1
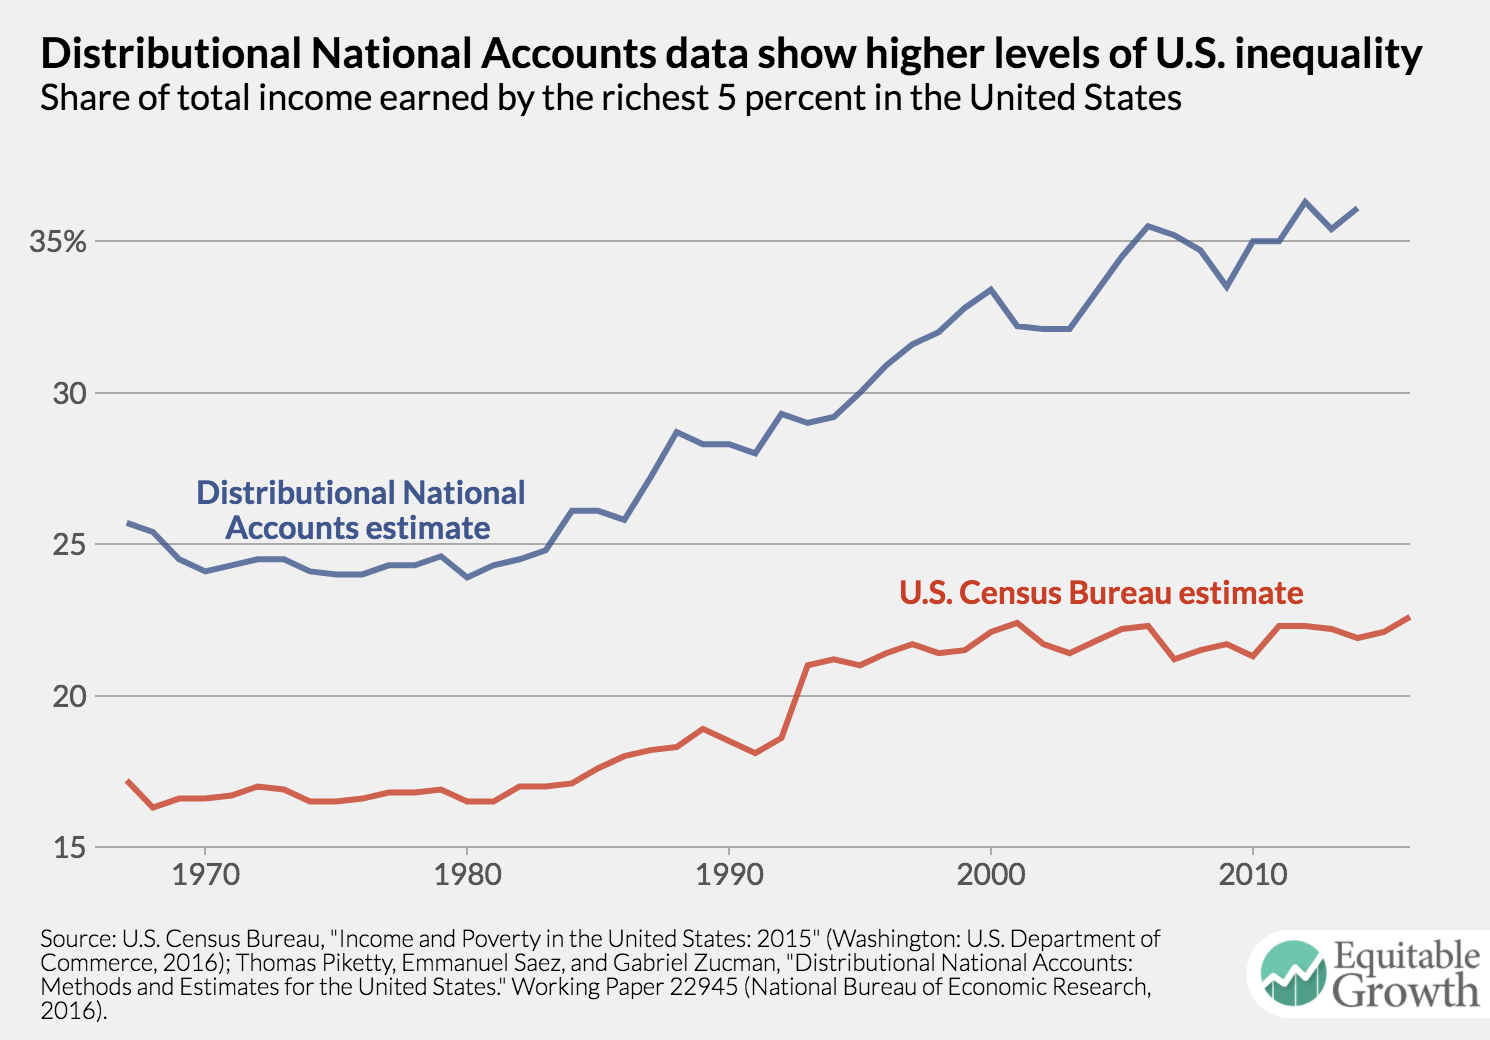
But these estimates of inequality by the Census Bureau do not tell the full story. Another dataset compiled by the academic team of economists Thomas Piketty at the Paris School of Economics and Emmanuel Saez and Gabriel Zucman at the University of California, Berkeley finds that the share of income garnered by the top 5 percent was much higher to begin with, 25.7 percent in 1967, and climbed more sharply to 36.1 percent of all income by 2014. Their estimates are based on a dataset they created called Distributional National Accounts. (See Figure 2.)
Figure 2
The Distributional National Accounts data suggest a much more unequal United States and a far steeper rise in inequality over the past four decades. Unfortunately, these data are closer to the truth than the Census estimates because they incorporate higher-quality administrative data and include more sources of income. It is especially unfortunate because the Census Bureau’s report is one of the few official data sources for tracking inequality, but for methodological reasons—most of which are outside the agency’s control—this official indicator is missing important trends.
Official U.S. economic measurement must improve
Without accurate measurement, policymakers cannot determine whether the laws and regulations they enact result in more broad-based economic prosperity. The three economists who developed the Distributional National Accounts prototype measurement point the way forward. Although there are many differences between their estimates and official estimates from the Census Bureau, two factors explain most of the discrepancy. First, the academic team uses administrative data to supplement the CPS survey data. Second, the Distributional National Accounts measurement uses a more complete definition of income. Here’s why both factors are so important to improving the measurement of the U.S. economy.
Survey data versus administrative data
The Census Bureau’s inequality estimates are based on data from the Current Population Survey. The Annual Social and Economic Supplement to the survey, conducted every March, provides economic data that is widely used by researchers, policymakers, and pundits. The CPS is a high-quality survey that goes out to more than 75,000 households, but even with such a relatively large sample size, it is difficult to capture the incomes of the truly rich, as they represent a tiny slice of the population and may be less likely than others to respond to a survey. As a result, measures of income in the CPS become less reliable as you look at higher and higher income slices of the U.S. population.
The academic team behind Distributional National Accounts addresses this weakness in the CPS by incorporating administrative tax data from the U.S. Internal Revenue Service. This gives them access to actual income reported to the IRS for every filer in the country. They can therefore construct more accurate estimates of income for top earners, all the way into the top 0.001 percent. This turns out to be extremely important because the fortunes of the merely rich and the truly rich have diverged considerably.
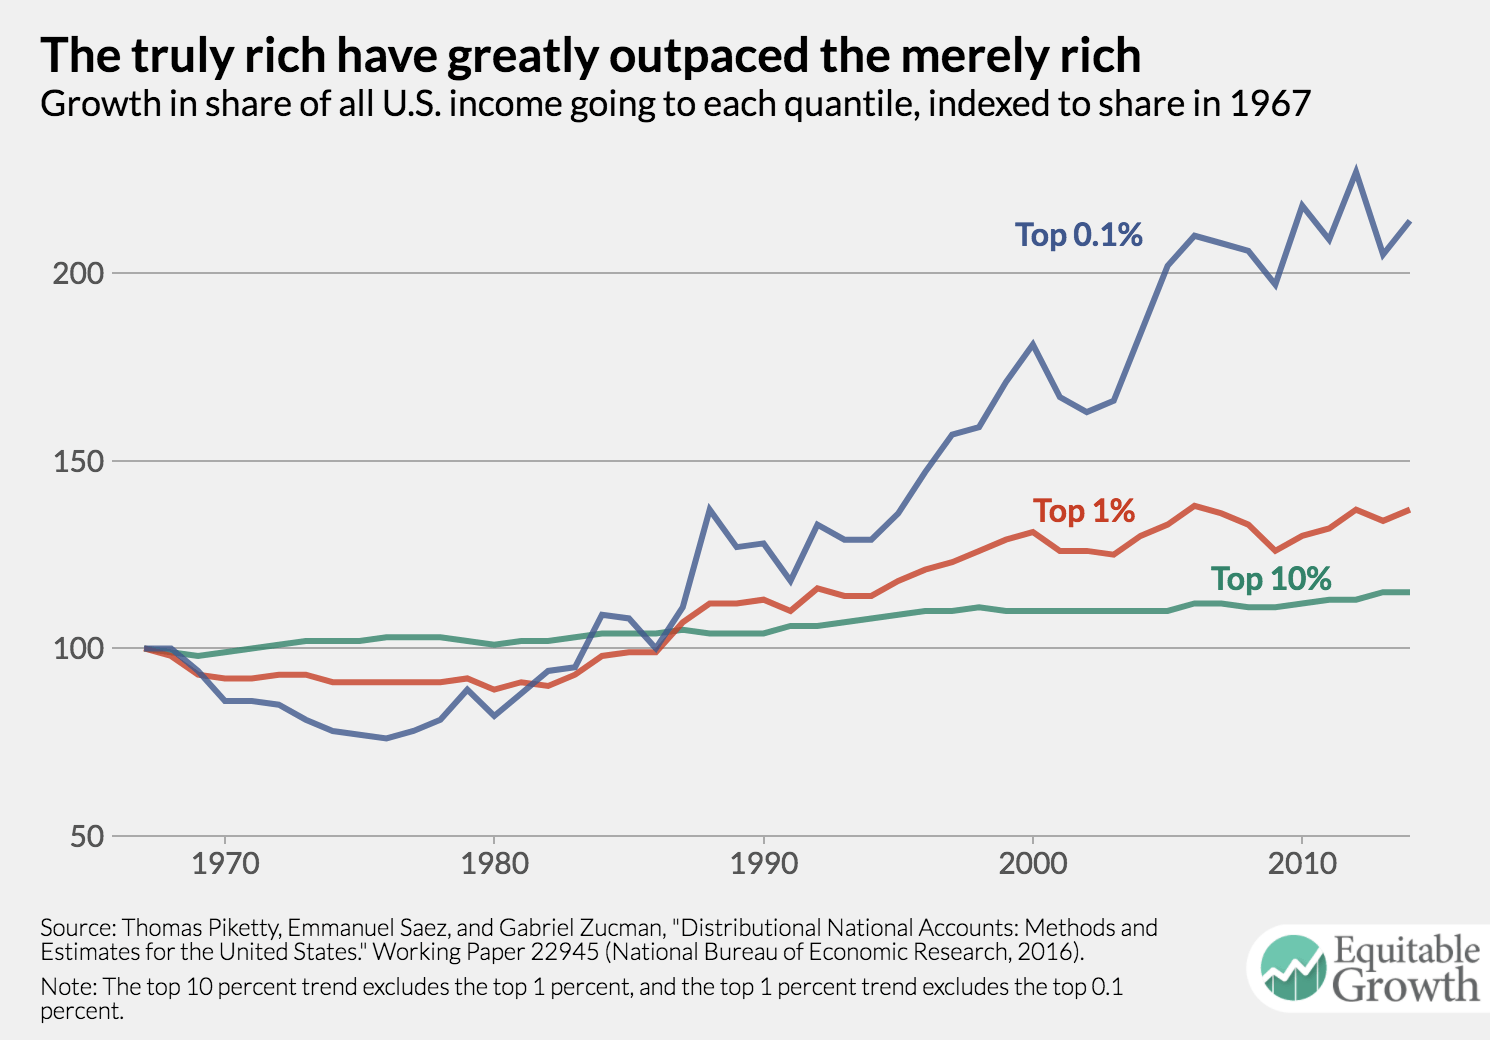
How much has the share of national income changed for the top 10 percent, the top 1 percent, and the top 0.1 percent of earners between 1967 and the end of 2016? The top 10 percent experienced an increase of a mere 15 percent in their share of total economic income, while the top 1 percent gained 37 percent and the richest 0.1 percent of earners more than doubled their share of total income, from 4.4 percent to 9.3 percent—a staggering 114 percent increase. (See Figure 3.)
Figure 3
The Census Bureau, relying on considerably less comprehensive data from the CPS, is only able to document the top 5 percent of income earners, and we know from the tax data that the CPS considerably underestimates income in that segment. Without incorporating administrative data, a full accounting of inequality in the United States is impossible. Importantly, this is not the Census Bureau’s fault. They do not have access to the full tax data that Piketty, Saez, and Zucman do, though they do have access to a more limited extract with less income detail. Nor is the IRS arbitrarily withholding data: U.S. law puts strict limits on how tax return data can be shared. If the federal government is ever to produce strong inequality statistics, these limits may have to be revisited in ways that preserve confidentiality while allowing improved measures of economic outcomes.
Measures of income
A second way in which the Census Bureau estimates miss the mark is in their chosen definition of income. The agency tracks money income, a measure that includes most sources of raw income that an earner might accrue before taxes are levied. It doesn’t include nonmonetary compensation such as the value of employer-provided health care. Finally, the agency takes a mixed approach to government transfers. Some are included as income such as Social Security income, while noncash benefits are excluded such as supplemental nutrition assistance.
Once again, the approach taken by Piketty, Saez, and Zucman is instructive. There are two significant distinctions in how Distributional National Accounts measure income. First, they peg their estimates to the National Income and Product Accounts. These accounts, produced by the U.S. Bureau of Economic Analysis, track the total economic output of goods and services in the United States to produce Gross Domestic Product. Add the income of every individual in the Distributional National Accounts dataset together, and it matches income concepts in the National Income and Product Accounts.
This matching requires the academic team to make some decisions that may seem odd at first glance. The three economists take all government spending on public education, for example, and allot it to individuals in the dataset. The average person may not think about this money as being part of their income, but it is a government benefit that subsidizes the income of those with children; for those without children, it helps to create a more educated and hopefully better society. Pegging the dataset to the National Income and Product Accounts ensures that all income is accounted for and gives a more complete picture of how government policy impacts inequality.
Second, Piketty, Saez, and Zucman provide measures for income before and after government taxes and transfers. Measuring inequality before and after government taxes and investments in social welfare programs is an important part of understanding how policy affects inequality. Among the wealthiest economies in the world, the United States is not very notable for its pre-tax and transfer level of inequality. France and Germany, for example, have similar levels of inequality, but the United States does much less redistribution with its tax code and social welfare programs. The upshot: The French and German economies are much less unequal after government programs are accounted for than the U.S. economy.
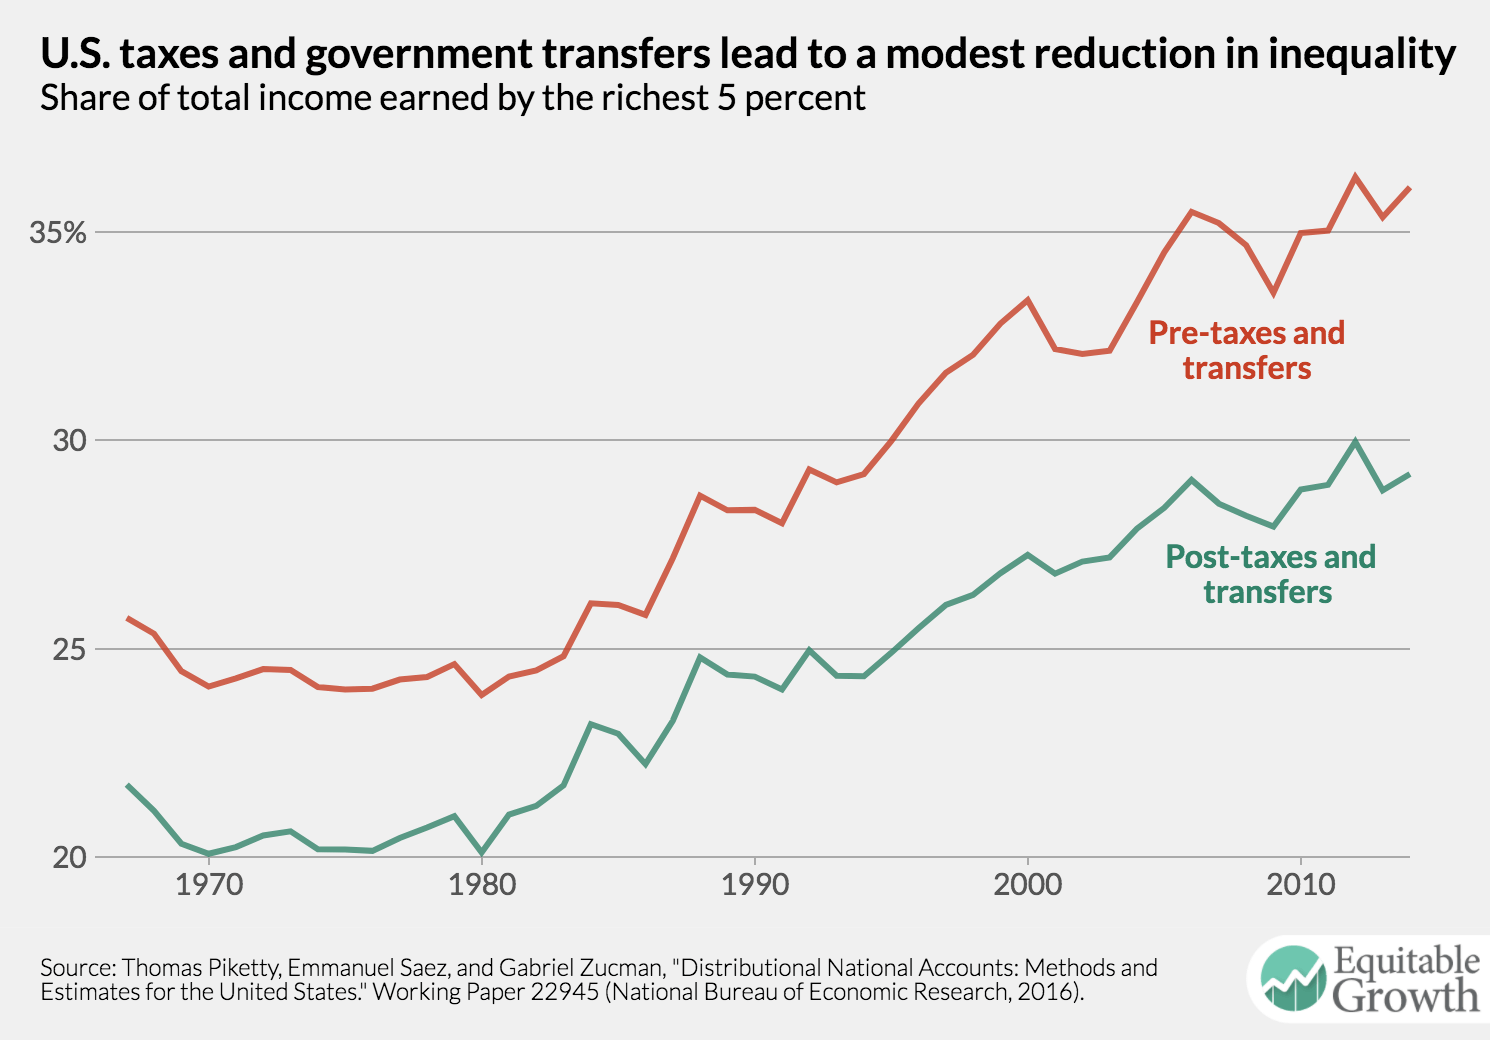
How do government taxes and transfers affect the share of income held by, say, the top 5 percent in the United States? The gap between pre-tax and post-taxes and transfers income has been widening since the early 1990s, and currently this gap accounts for about a 7 percentage point difference for this income group. (See Figure 4.)
Figure 4
This before-and-after information is absolutely necessary if policymakers are to understand how their policies affect economic inequality. If there is only one measure of inequality, it may be difficult to deduce whether fluctuations are caused by policy or some exogenous factor.
Today’s data release by the U.S. Census Bureau is an important product because it represents one of the nation’s few official measures of inequality. But it is insufficient if we are to truly understand how inequality has changed and how it affects today’s economy. Legislators and employees of statistical agencies alike should pursue ways of improving our data infrastructure for tracking inequality.