Disaggregated data on Asian Americans, Native Hawaiians, and Pacific Islanders is crucial amid the coronavirus pandemic

Overview
The novel coronavirus pandemic and the recession it caused lay bare the clear links between racial and ethnic economic inequities, structural racism, and the outsized harm of these crises on communities of color in the United States. But the impact on Asian Americans, Native Hawaiians, and Pacific Islanders is less evident because the data on these specific communities are not disaggregated to show the full impact of the coronavirus recession among subgroups of AANHPI communities.
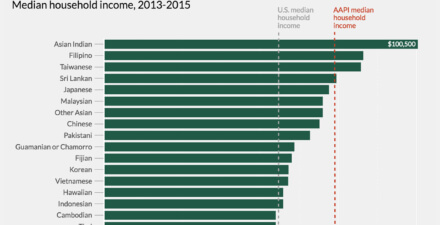
The data that are disaggregated, for income levels and educational attainment, demonstrate that aggregated data for all Asian Americans, Native Hawaiians, and Pacific Islanders mask serious socioeconomic inequities within and among the many subgroups in this catch-all category. To address both the public health and economic crises, disaggregating U.S. administrative data by detailed race and ethnicity is a critical element of a broader policy agenda to protect the most vulnerable workers and to address pervasive issues of systemic racism.
“Disaggregating data in the current crisis reveals that anti-Asian bias and hate speech are not the only ways in which Asian American communities experience racism,” says Janelle Wong, a professor of American studies and Asian American studies at the University of Maryland, in an interview with the authors. “Within our community, it is clear that many of those Asian American groups that were already the most economically vulnerable are now hit hardest by doing the unappreciated and underpaid work of essential and front-line workers. This story cannot be told without disaggregated data.”
The sooner policymakers start to disaggregate data by multiple dimensions, the sooner we can target the unique barriers to emergency support in response to this crisis, including healthcare, workplace protections, and other critical services and resources at the local, state, and federal levels. This issue brief details why the U.S. Department of Commerce’s Bureau of Economic Analysis, the U.S. Department of Labor’s Bureau of Labor Statistics, the Federal Reserve Board and statistical agencies at the U.S. Department of Health and Human Services and state and territorial healthcare agencies need to act soon, and what they should do.
What the data reveal about the Asian American, Native Hawaiian, and Pacific Islander workers in front-line occupations
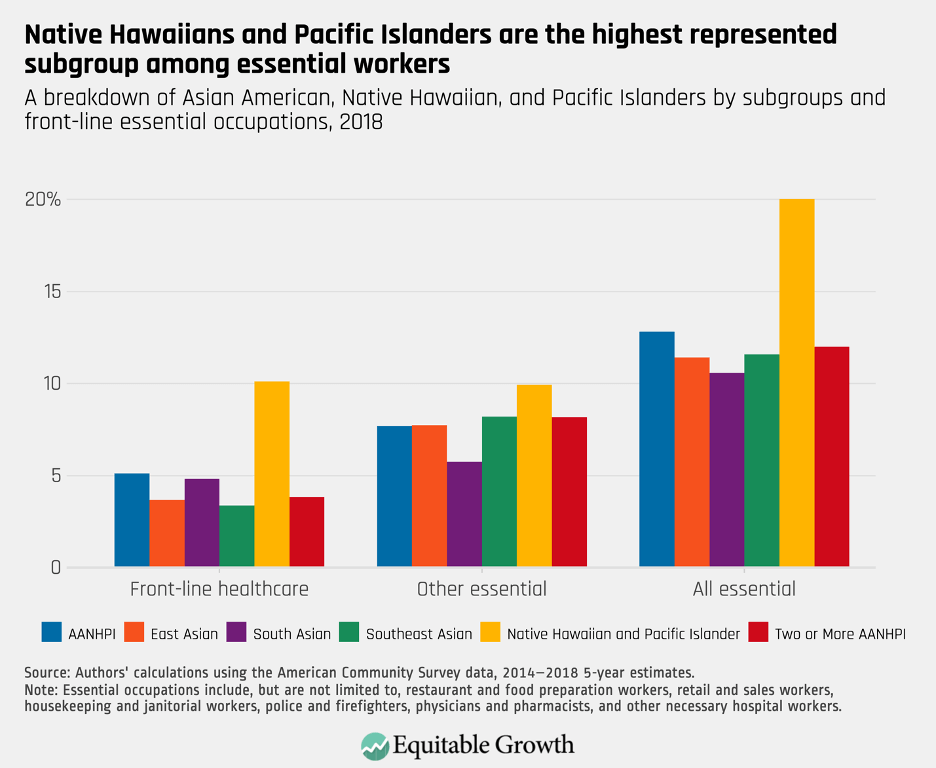
An important factor of this crisis’s disparate toll on people of color is their overrepresentation in lower-paying jobs with fewer benefits, such as paid sick leave, or jobs considered “essential” within the context of the current pandemic, including healthcare workers, cleaning staff, and fast food service workers, among others. According to the 2018 American Community Survey 5-year sample, front-line essential workers comprised 12.8 percent of the AANHPI workforce. (See Figure 1.)1
Figure 1
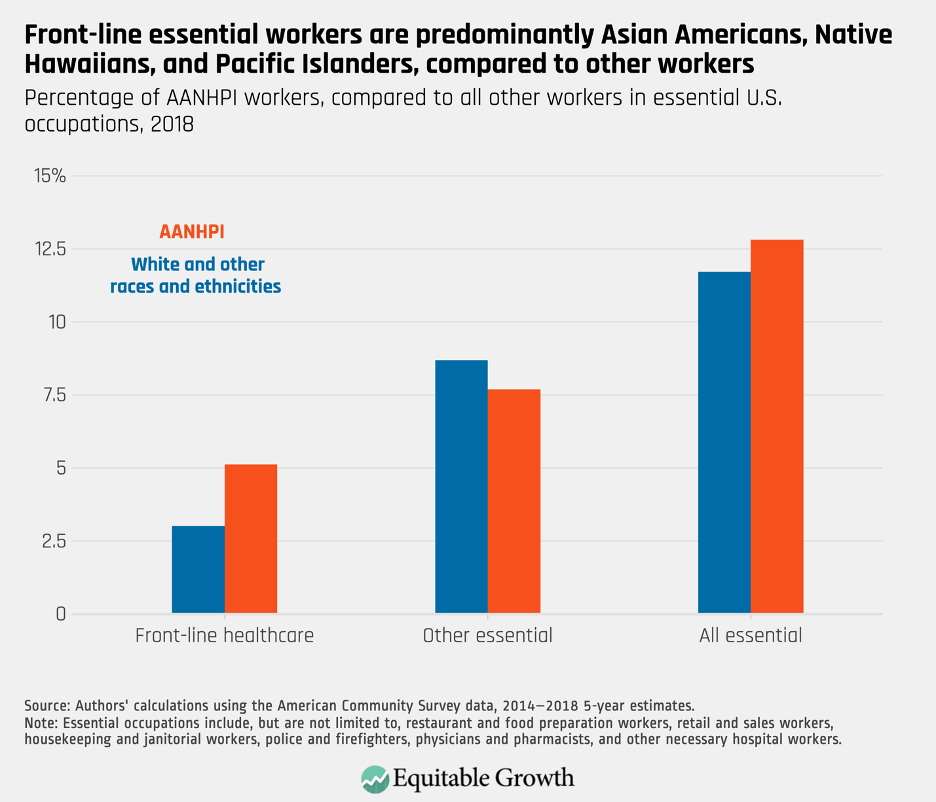
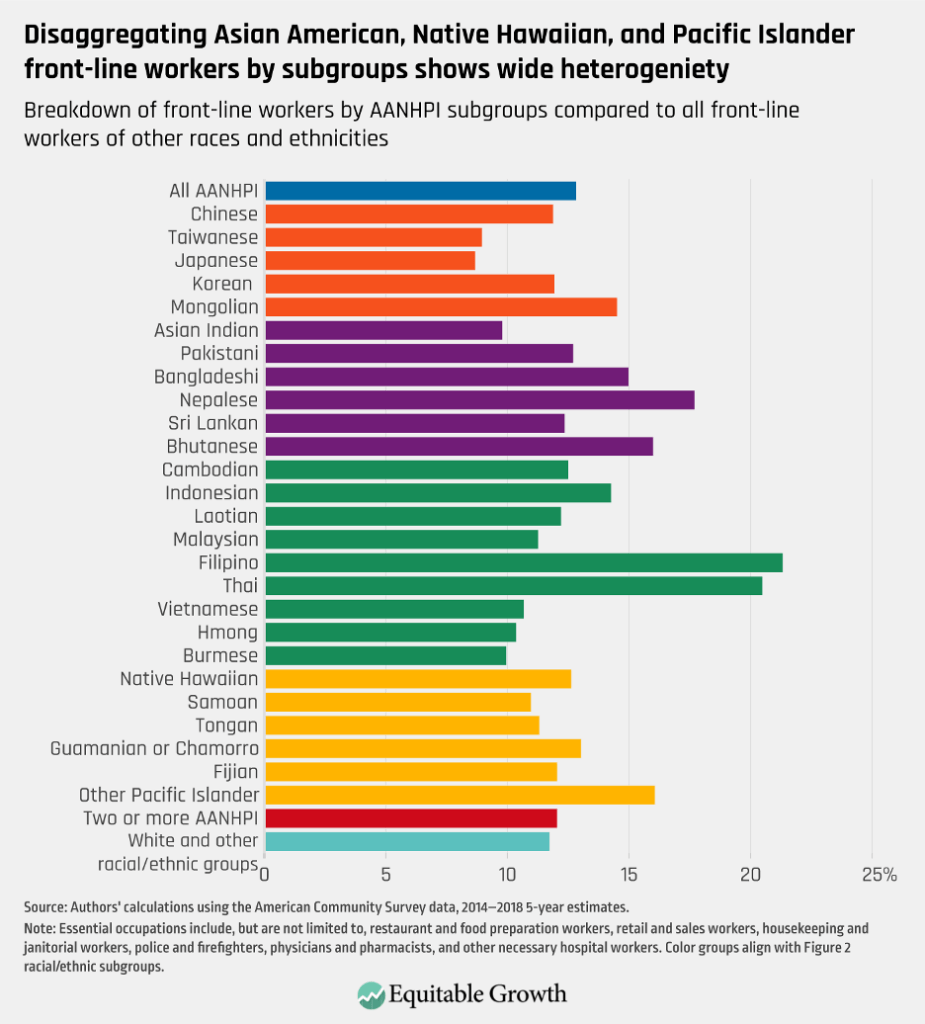
A deeper look at the data shows notable heterogeneity for subgroups across occupations. Among essential healthcare workers (20 percent of all those on the front lines), 9.2 percent are Asian Americans, Native Hawaiians, and Pacific Islanders, which is higher relative to their 5.6 percent representation within the U.S. total population, according to our calculations.2 Disaggregated data of AANHPI subgroups, such as East Asian and Southeast Asian Americans, compared to White and other racial and ethnic groups, show notable heterogeneity. (See Figure 2.)
Figure 2
But these data still mask important differences between specific racial and ethnic groups within Asian American, Native Hawaiian, and Pacific Islander front-line workers. A deeper look at the American Community Survey data shows notable heterogeneity for subgroups across occupations, relative to the proportion of the total AANHPI population in the front-line workforce. A high proportion of the Filipino (11.5 percent) and Fijian (10.1 percent) subgroup populations are healthcare workers, relative to the rates of the largest AANHPI subgroup populations—Chinese (3.7 percent) and Asian Indians (5 percent), and to all other workers (3 percent).
This is also true in other front-line, essential occupations, which include food services, cleaning, retail, and public service employees such as police and firefighters. The workforces of certain subgroup populations are highly represented in these industries, such as Hawaiians (10.3 percent), Nepalese (13.6 percent), and Thais (16.3 percent), compared to other large subgroups such as Koreans (7.8 percent) and Vietnamese (7.2 percent), and to all other racial/ethnic groups (8.7 percent). (See Figure 3.)
Figure 3
Asian American, Native Hawaiian, and Pacific Islander health disparities amid the coronavirus pandemic
The role of front-line workers from Asian American, Native Hawaiian, and Pacific Islander communities compounds the dangers of these workers and their families and communities to the coronavirus and COVID-19, the disease caused by the virus. The nature of pandemics, of course, means that the success of public health initiatives to contain a deadly virus or bacteria depends on the protection and treatment of populations most at risk. And structural and economic inequalities play major roles in healthcare outcomes across all racial groups. While incomplete, the existing data on the race and ethnicity of cases of coronavirus and COVID-19 reveal deep inequities.3
The latest data on cases by state and race/ethnicity show that 4 of the 10 states with the highest number of cases are also among the top 10 states in the continental United States with largest number of Asian Americans, Native Hawaiians, and Pacific Islanders per capita.4 “As we have seen in other diseases, such as cardiovascular disease, diabetes, and cancer, aggregating these diverse race and ethnic groups leads to missing important high-risk groups,” says Latha Palaniappan, professor of medicine at Stanford University School of Medicine, in an interview with the authors of this issue brief. She adds that because of the unique health needs of AANHPI communities, “it is also important not to study just one group, say Chinese, and extrapolate to other AANHPI groups, say Filipino.”
Important factors affecting health outcomes, including insurance coverage, language and cultural barriers to medical care, and risk of certain health conditions, vary widely among Asian Americans, Native Hawaiians, and Pacific Islanders. Research from Stanford University shows that diabetes, heart disease, and strokes are common causes of death in AANHPI communities. When looking at health insurance rates, a study from 2018 found that while uninsurance rates among Americans in these communities of color shrank after the enactment of the Affordable Care Act in 2010 (from 18.8 percent to 9 percent), they are still slightly higher than White uninsurance rates today (8.8 percent).
So, even as data reporting on the health impact of the coronavirus and COVID-19 by race and ethnicity improve, states and communities empowered to provide accessible health resources will have difficulty doing so equitably and efficiently using aggregate data alone. As Figure 3 demonstrates, the wide heterogeneity of front-line workers among subgroups of Asian Americans, Native Hawaiians, and Pacific Islanders means that knowing more about those subgroups’ health disparities would help public health officials deal with the pandemic based upon deeper evidence-based data.
Why disaggregated data for Asian Americans, Native Hawaiians, and Pacific Islanders matter
Significant occupational differences are not the only motivation to understanding the heterogeneity within the Asian American, Native Hawaiian, and Pacific Islander communities. AANHPI subgroups (as is true for all racial and ethnic groups) are distinct in terms of their language diversity and English proficiency, caregiving preferences, naturalization rates and immigration histories, and generational cohort sizes. Altogether, these have important implications for policy interventions and government support targeted to these subgroups within the AANHPI population in the United States. Disaggregated data can be critical for state and local jurisdictions with diverse AANHPI populations, for example, so that policymakers can take the proper and effective steps to protect these workers, their families, and their communities, and contain the virus.
It can also empower policymakers at all governing levels to adopt more robust and holistic approaches to address issues that may well be exacerbating the crisis for these communities. A breakdown of the data into AANHPI subgroups by unemployment, healthcare and family care provisions, food and income insecurity, unstable or inadequate housing, and workplace hazards or discrimination would deepen our understanding of these communities.
Or consider language accessibility.5 This is crucial for inclusive public health emergency advisories on testing information, transportation service disruption announcements, workplace protection notices (from adequate break time for workers to access to personal protective equipment), and targeted program uptake (including supports for small businesses during the crisis, as well as families with complex household care needs).6
Then, there’s the travesty faced by all of these subcommunities of Asian Americans, Native Hawaiians, and Pacific Islanders—the compounded amounts of potential harm due to the notable rise of anti-Asian harassment and assault since the onset of this pandemic, as well as massive drops in traffic to AANHPI-owned restaurants and businesses compared to other companies. According to a study published by Pew Research Center, approximately 31 percent of AANHPI adults have been victims of racial slurs, jokes, or attacks, and around 39 percent have said people have acted uncomfortable around them since the coronavirus outbreak began in the United States. Continuing inflammatory rhetoric by some of our nation’s public officials only encourages this racism.
Investing in our public economic infrastructure and strengthening collective bargaining laws are two ways to more broadly help these and other communities of color and our nation at large.7 So, too, would immigration reform—and all of which would help to expedite relief during the current recession, bolster worker power, and provide legal recognition and protections for at-risk workers.8 And the long-term trauma of the coronavirus pandemic and resulting recession will require more public investment in our public mental healthcare infrastructure. This needs to be culturally competent and inclusive to meet the needs of the very diverse subcommunities of Asian Americans, Native Hawaiians, and Pacific Islanders.
Conclusion
Asian Americans, Native Hawaiians, and Pacific Islanders are the fastest growing part of an increasingly diverse U.S. population. The U.S. Census Bureau and other federal agencies, as well as some state and local agencies and universities, now collect data on 23 distinct Asian American and 21 distinct Native Hawaiian and Pacific Islander ethnic groups.9 But persistent problems remain in the collection, standardization, and dissemination of these disaggregated data.
Currently, only the American Community Survey and the U.S. Census Bureau produce disaggregated administrative datasets on subgroups within AANHPI subcommunities. But the Census Bureau’s Annual Social and Economic Supplement of its Current Population Survey does not, as is also the case for the Bureau of Labor Statistics data and the Federal Reserve’s Survey of Consumer Finances.
One assumption as to why federal agencies are against collecting disaggregated data is that collecting specific ethnic and racial data for all groups under the AANHPI umbrella is tedious and can minimize sample sizes to the point that any analysis may not be statistically significant. At the state level, too, some groups have pushed back against efforts to disaggregate data. “One of the biggest contemporary challenges to collecting these data is that some members of our own communities have been opposing the collection of high-quality detailed data,” said University of Maryland’s Wong, who also is a research fellow for AAPI Data, a publisher of demographic data and policy research on Asian Americans and Pacific Islanders.
“For example, in Minnesota, Massachusetts, and Connecticut, some Chinese Americans have lobbied against the efforts of Asian American advocacy organizations to collect detailed data on Asian American populations,” notes Wong. “The unfounded fear of these groups is that identifying disparities within our communities will somehow have a negative effect on the most economically advantaged subgroups.”10
It’s vital that policymakers have a clearer understanding of the intersection of racial health disparities, socioeconomic precarity, and participation in essential occupations to effectively address the coronavirus pandemic and the continuing recession. The White House Initiative on Asian Americans and Pacific Islanders, a federal interagency working group under the U.S. Department of Commerce, should recommit to improving data collection, access, and dissemination on all AANHPI communities and encouraging researchers and policymakers to leverage these datasets for new analysis and smarter planning, which had formerly a been top priority of this initiative in the previous Obama administration.
Federal policymakers should also enact the policies proposed in Equitable Growth’s GDP 2.0 project, which calls for producing headline economic statistics that represent the well-being of all Americans at the top, middle, and bottom of the income distribution. While disaggregating administrative data by race, ethnicity, and gender has proven to positively impact economic and public health initiatives across the country, the combination of this data with disaggregated income data would paint a clearer picture of the state of inequality across all groups and income levels. The extent of cultural heterogeneity revealed would have significant implications not just for the lived experiences of different members of the many Asian Americans, Native Hawaiians, and Pacific Islanders, but also for how policymakers can fully grasp and identify structural weaknesses in the U.S. economy affecting all workers and families during this crisis and the long recovery to follow.
End Notes
1. In order to address data about front-line essential workers, the authors used the American Community Survey, or ACS, Occupation Codes and Department of Homeland Security Guidelines to identify a selection of occupations that are unable to be done at home and are essential to the operations of a city. These occupations include, but are not limited to, restaurant and food preparation workers, retail and sales workers, housekeeping and janitorial workers, police and firefighters, physicians and pharmacists, and other necessary hospital workers.
2. Ibid. While the American Community Survey collects detailed racial and ethnic data, we only presented calculations on 26 AANHPI subgroups in order to have statistical accuracy. There are more than 26 AANHPI subgroups represented in the U.S. population.
3. Preliminary numbers show that 1 in 1,250 Black Americans, 1 in 2,200 Latinx Americans, and 1 in 3,000 Asian Americans have died as a result of COVID-19. See AMP Research Staff Lab, “The Color of Coronavirus: Covid-19 Deaths by Race and Ethnicity in the U.S.” (2020), available at https://www.apmresearchlab.org/.
4. According to Centers for Disease Control and Prevention data on COVID-19 cases in the United States, the 10 states with the highest number of reported cases are, in order of total cases: California, Florida, Texas, New York, Georgia, Illinois, Arizona, New Jersey, North Carolina, and Louisiana. According to 2010 Census data, the top 10 states with the largest AANHPI populations are, in order: California, New York, Texas, New Jersey, Hawaii, Illinois, Washington, Florida, Virginia, and Pennsylvania. The top 10 states in the continental United States with the largest percentage of AANHPI of the total populations are, in order: California, New Jersey, Washington, New York, Nevada, Massachusetts, Virginia, Maryland, Alaska, and Illinois. While Hawaii has the highest AANHPI population per capita, it is not considered part of the continental United States. See Centers for Disease Control and Prevention,“Cases in the U.S.,” available at https://www.cdc.gov/coronavirus/2019-ncov/cases-updates/cases-in-us.html (last accessed August 18, 2020).
5. According to the Center for Economic and Policy Research’s 2011 AAPI Workers Report, linguistic isolation among AAPI workers in the aggregate (16.7 percent) is not as high as it is among Latinx workers (22.8 percent), but several ethnic AAPI groups have higher rates of linguistic isolation than Latinx workers do: Vietnamese (33.4 percent), Chinese (26.6 percent), Korean (25.6 percent), and Bangladeshi (23.1 percent). See H. Rho and others, “Diversity and Change: Asian American And Pacific Islander Workers” (Washington: Center for Economic and Policy Research, 2011), available at https://cepr.net/documents/publications/aapi-2011-07.pdf. An example of a federal initiative to meet this need is the Vulnerable Workers Project, launched in 2014 as a collaboration of the White House Initiative on Asian Americans and Pacific Islanders, which includes the U.S. Departments of Justice and Labor, the Equal Employment Opportunity Commission, and the National Labor Relations Board. The project sought to strengthen employment and labor protections for AANHPI workers in high-risk and low-wage industries. It strengthened the “No Wrong Door” belief, where any worker who contacts any federal agency should be provided with culturally appropriate services.
6. According to a Pew Research Center study, between 26 percent and 29 percent of AANHPI people live in intergenerational households. See D’Vera Cohn and Jeffrey S. Passel, “A record 64 million Americans live in multigenerational households” (Washington: Pew Research Center, 2018), available at https://www.pewresearch.org/fact-tank/2018/04/05/a-record-64-million-americans-live-in-multigenerational-households/.
7. In 2010, 8.8 percent of union workers were AANHPI. More than twice as many AANHPI workers are in unions than are self-employed. See U.S. Bureau of Labor Statistics, “Union Membership Annual News Release,” Press release, January 22, 2020, available at https://www.bls.gov/news.release/union2.htm.
8. In 2009, three-fourths (74.7 percent) of all AANHPI workers were born outside of the United States. Despite the high immigration rate, 71.4 percent of AANHPI workers are U.S. citizens. See U.S. Bureau of Labor Statistics, “Foreign-Born Workers: Labor Force Characteristics – 2019,” Press release, May 15, 2020, available at https://www.bls.gov/news.release/pdf/forbrn.pdf.
9. The U.S. Census Bureau collects demographic data on the following Asian American ethnic groups, in alphabetical order: Asian Indian, Bangladeshi, Bhutanese, Burmese, Cambodian, Chinese (except Taiwanese), Filipino, Hmong, Indonesian, Iwo Jiman, Japanese, Korean, Laotian, Malaysian, Maldivian, Mongolian, Nepalese, Pakistani, Sri Lankan, Okinawan, Singaporean, Taiwanese, Thai, and Vietnamese. Data are also collected on the following NHPI ethnic groups, in alphabetical order: Carolinian, Chuukese, Fijian, Guamanian or Chamarro, I–Kiribati, Kosraean, Mariana Islander, Marshallese, Ni–Vanuatu, Native Hawaiian, Niueans, Palauan, Papua New Guinean, Pohnpeian, Saipanese, Samoan, Solomon Islander, Tahitian, Tokelauans, Tongan, and Yapese. See Elizabeth M. Hoeffel and others, “The Asian Population: 2010” (Suitland, MD: U.S. Department of Commerce, U.S. Census Bureau, 2012), available at https://www.census.gov/prod/cen2010/briefs/c2010br-11.pdf; Lindsay Hixson and others,“The Native Hawaiian and Other Pacific Islander Population: 2010” (Suitland, MD: U.S. Department of Commerce, U.S. Census Bureau, 2012), available at https://www.census.gov/prod/cen2010/briefs/c2010br-12.pdf.
10. For reference, resistance to data disaggregation efforts from within the AANHPI community has been covered by NPR. See Hansi Lo Wang, “’Racist Bill’? Chinese Immigrants Protest Effort To Collect More Asian-American Data,” National Public Radio,August 5, 2017, available at https://www.npr.org/2017/08/05/541844705/protests-against-the-push-to-disaggragate-asian-american-data.