New distributional snapshot of U.S. personal income is a landmark federal statistical product

The U.S. Department of Commerce’s Bureau of Economic Analysis recently released new estimates of how growth in personal income has been divided among high- and low-income earners between 2007 and 2016. This first release establishes the methods that BEA will use to report this data annually, starting as early as later this year. This is a landmark new statistical product that should make us rethink how U.S. economic growth is experienced by individuals and families.
A chart from the agency’s release shows how total personal income growth in each year has been divided by people in each quintile of income. (See Figure 1.)
Figure 1
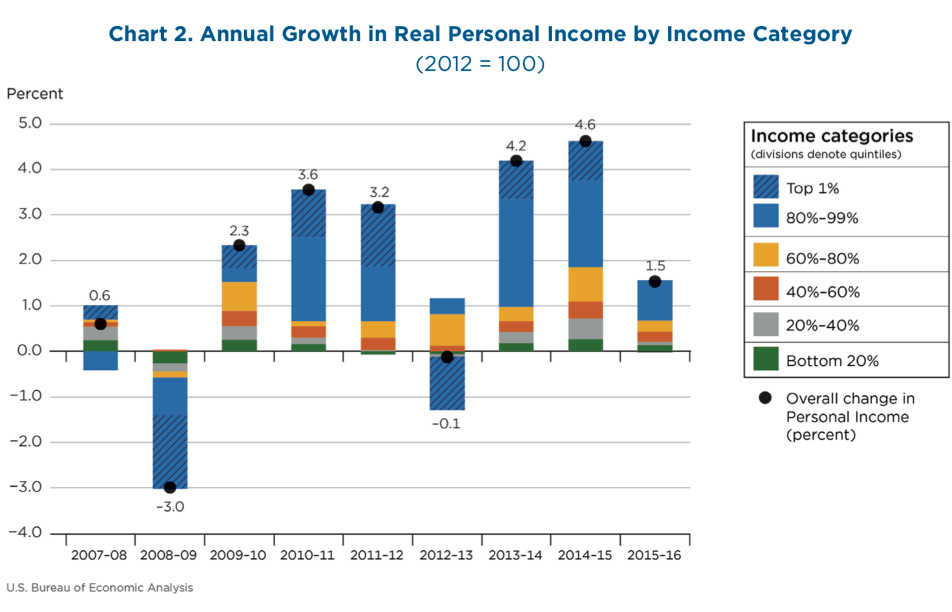
This graph shows year by year how income inequality is changing in the United States. The blue areas are the portion of overall growth that is accruing to the top 20 percent of income earners. So, 2009–2010 was a year in which growth was relatively equitably divided and income inequality fell, whereas in 2013–2014, the top 20 percent of earners captured a huge share of overall income growth.
Although income inequality could be measured in different ways using the released data, most measures tend to show that inequality has increased only slightly since 2007. That said, the next few years of data will be especially important, particularly as our economy enters a potential recession with the threat of the coronavirus. Current data show that inequality is trending up after falling somewhat during and immediately after the Great Recession, as measured by the share of personal income that accrued to the top 10 percent of income earners. (See Figure 2.)
Figure 2
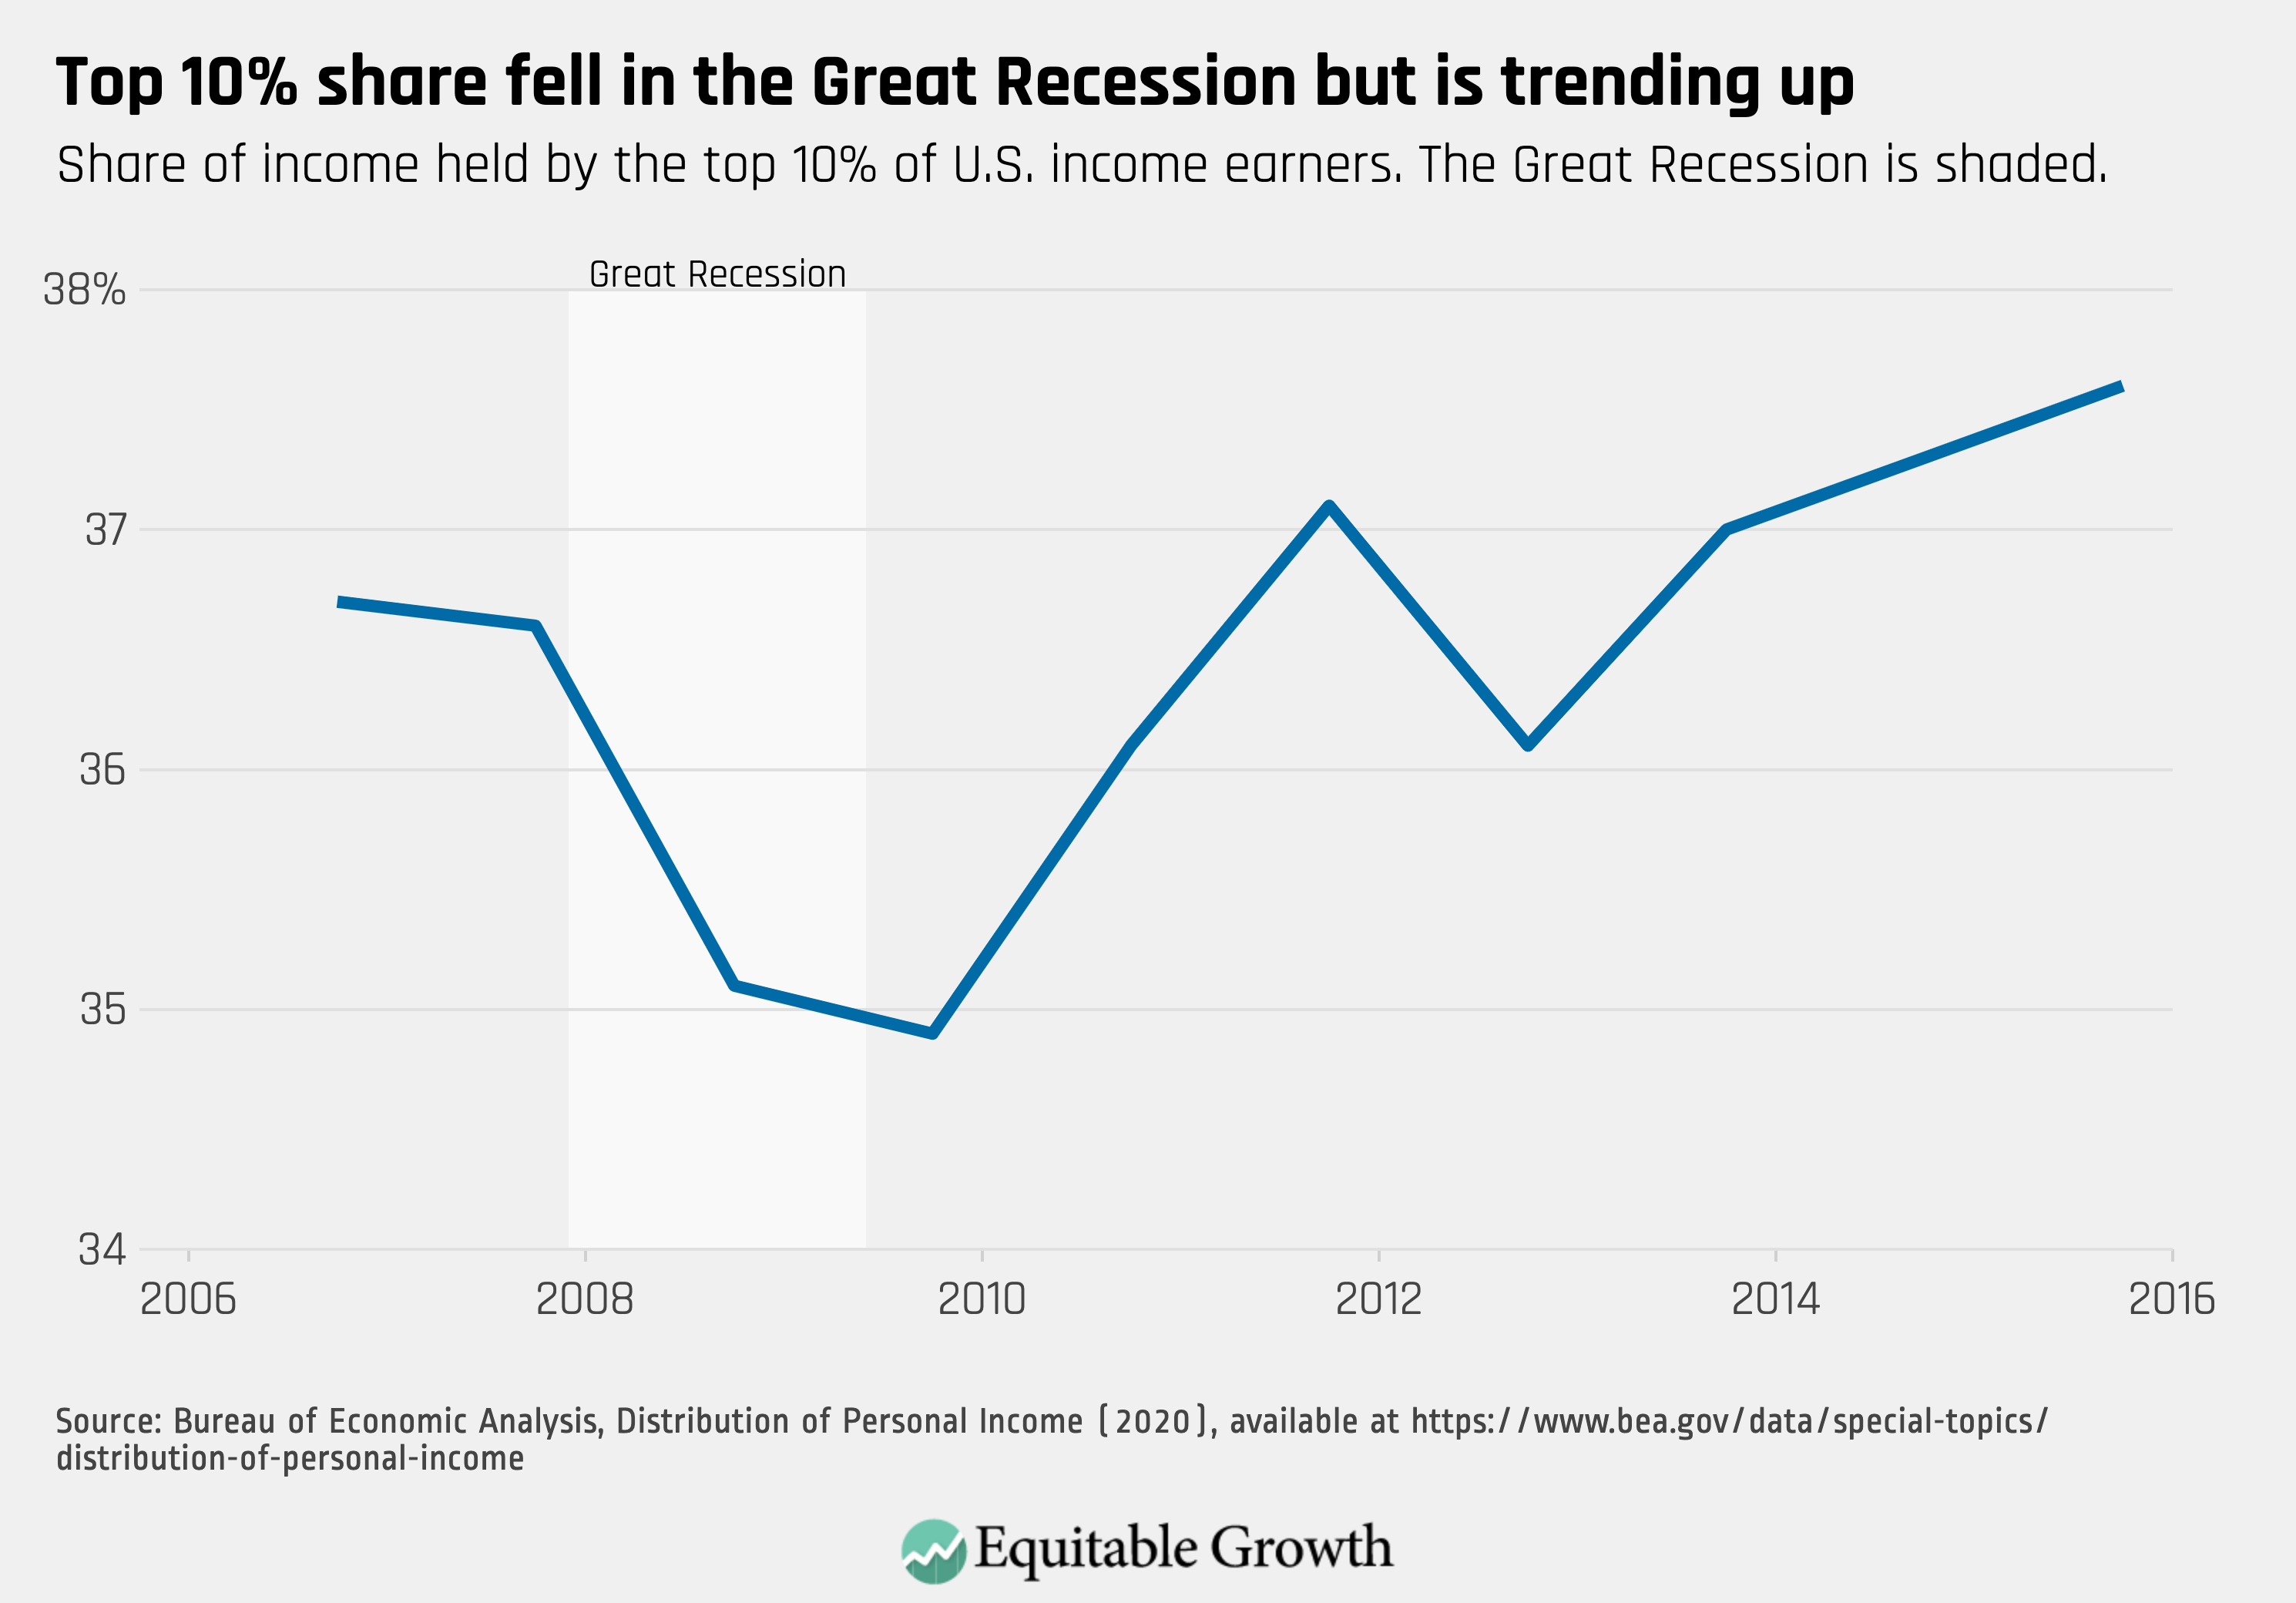
The share of income received by the top 10 percent dropped by about 2 percentage points during the Great Recession but has since added nearly 3 percentage points, suggesting that the previous expansion might be favoring those at the high end of the income ladder. This data may shed light on how the economy might respond to a potential coronavirus-induced recession.
In the remainder of this column, I discuss a few of the choices BEA made when compiling this data series and how to think about this release in the broader context of existing data series tracking income inequality.
How to think about the distribution of economic growth
It’s helpful to drill down a bit more on Figure 1, which provides a helpful snapshot of who growth benefitted in each year that BEA analyzes. The last bar, for 2015–2016, shows that the top 20 percent of income earners received a bit more than 50 percent of income growth in the economy, which means that in that year, income inequality increased but maybe not by as much as one would think based on this bar.
For inequality to stay the same, and for every income group to experience income growth equal to average income growth, each group must receive a share of growth equal to their current share of income in the U.S. economy. The graphic below shows what the division of growth would look like if every income group was experiencing the headline level of growth. (See Figure 3.)
Figure 3
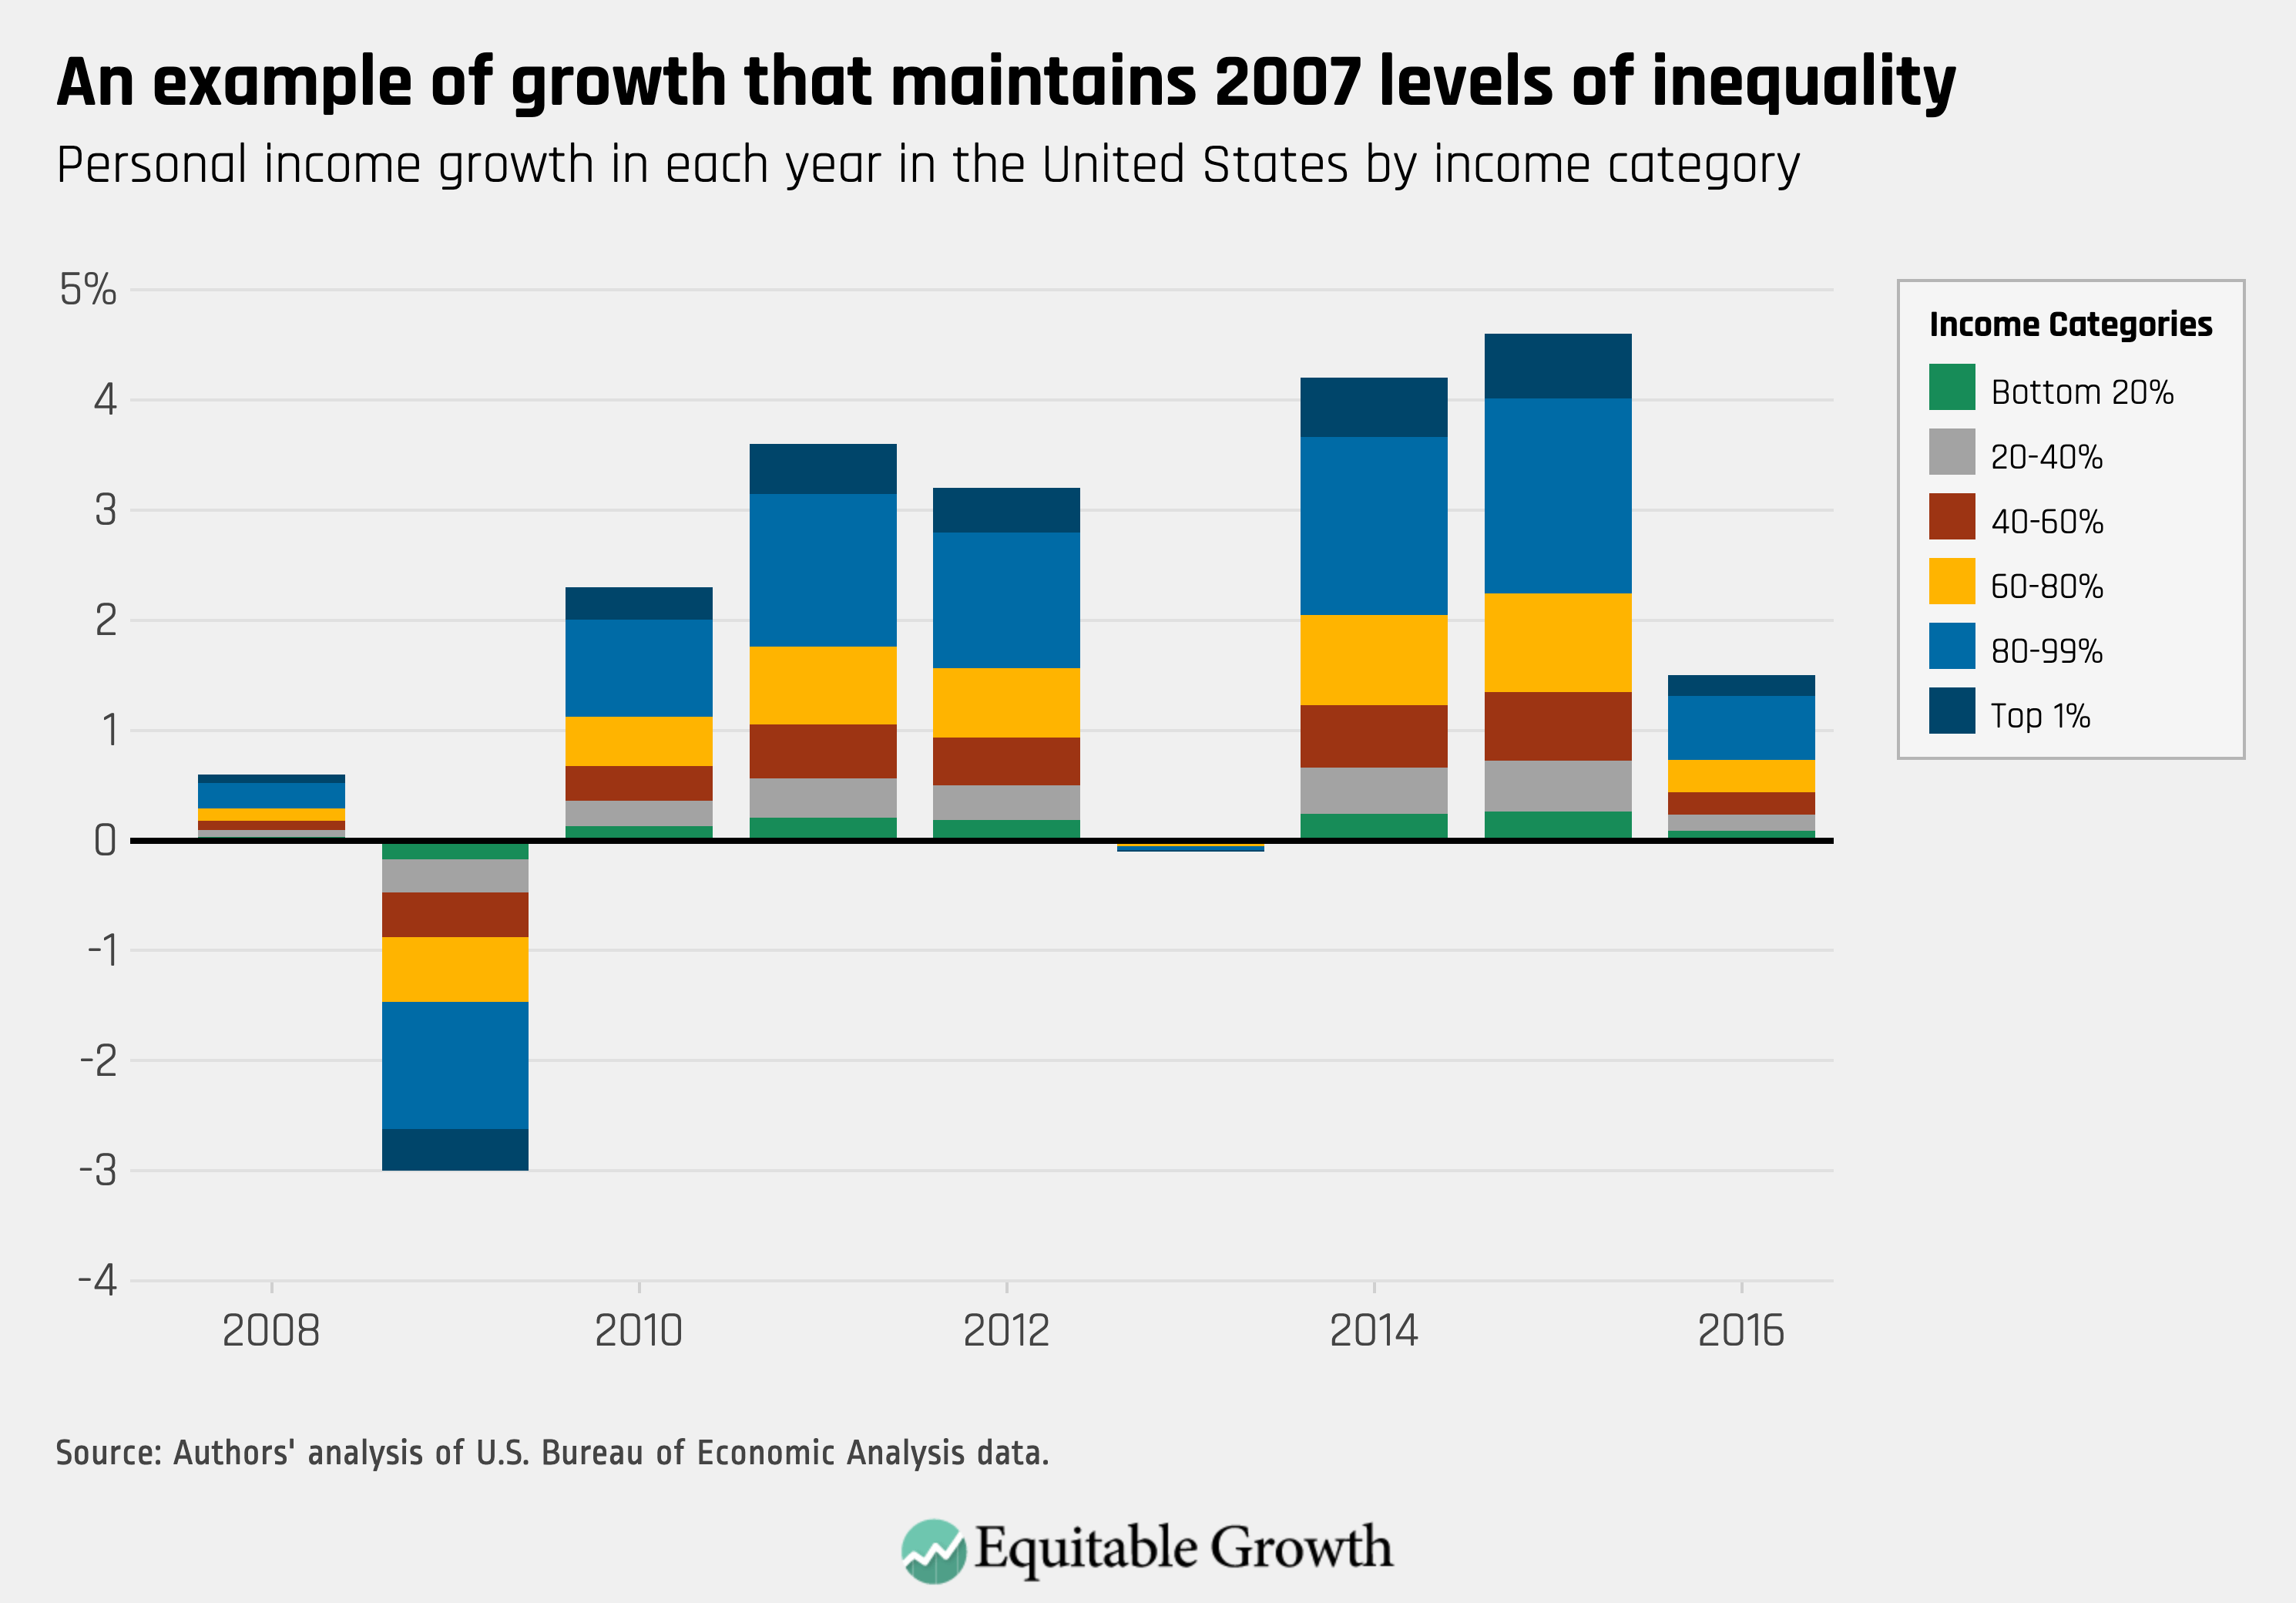
The division of the 2016 bar indicates that average personal income growth was 1.5 percent and that every quintile of income likewise experienced 1.5 percent growth. In other words, this graph shows an economy with a stable level of inequality. A graph where each quintile earned 20 percent of economic growth would actually lead to falling inequality. Comparing Figures 2 and 3 shows that in most years after the Great Recession, income inequality rose.
To actually reverse the now-four-decade-long rise in income inequality, growth would have to consistently be distributed more equitably than it is in Figure 3.
Why personal income?
The Bureau of Economic Analysis chose to map out in its datasets the distribution of personal income because it is one of its commonly reported indicators in the National Income and Product Accounts. The agency’s table 4 from the release compares personal income to some of the other income concepts that other significant analyses of income use. (See Figure 4.)
Figure 4
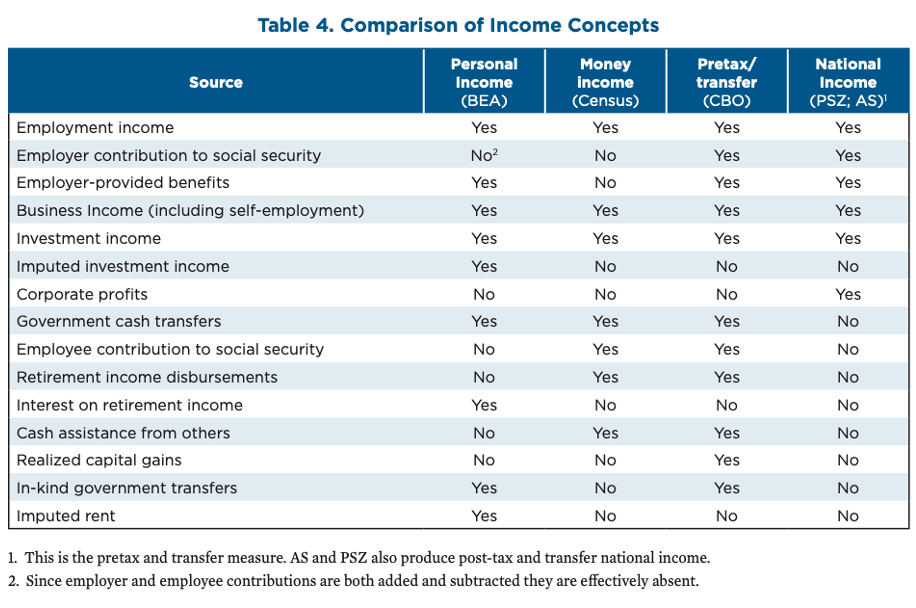
The U.S. Census Bureau’s annual income and poverty report, for example, uses money income. The most significant academic dataset that distributes aggregate income is the one developed by economists Thomas Piketty at the Paris School of Economics and Emmanuel Saez and Gabriel Zucman at the University of California, Berkeley. Their Distributional National Accounts target national income. Gerry Auten at the Office of Tax Analysis in the U.S. Department of the Treasury and David Splinter at the U.S. congressional Joint Committee on Taxation also target national income in their data series, which makes adjustments to the dataset developed by Piketty, Saez, and Zucman.
National income includes some components where the distribution of income is not well known, primarily corporate profits. Piketty, Saez, and Zucman make assumptions about how this money is distributed, but these assumptions may be contentious, so distributing personal income is more straightforward and less subject to debate over how income that isn’t directly observed is distributed among the population. No researchers have tried to distribute Gross Domestic Product itself, due to the inclusion in GDP of capital depreciation, for example, where it is even less obvious how the concept should be distributed.
Levels and trends compared to other data series
The new data series released by BEA is arriving into a crowded field. Two sets of researchers have created their own competing distributions of national income, and inequality in incomes is also tracked by the Congressional Budget Office in its distribution of household income report. In the released report, BEA makes comparisons to these datasets. While these are helpful for thinking about how these new data fit into the existing literature, two cautionary notes are useful.
First, it is difficult to compare the levels of income inequality seen in the BEA dataset to existing datasets because the income concept used by BEA is different. It is not obvious whether moving from personal income to after-tax national income as measured by Piketty, Saez, and Zucman or Auten and Splinter should increase or decrease inequality. On the one hand, both of those datasets have post-tax data series that apply government transfers and take out taxes. These additions should be generally progressive, reducing inequality. But the Piketty, Saez, and Zucman and Auten and Splinter datasets also include corporate profits, which we would expect to be a regressive addition, increasing inequality.
Generally, the levels of income inequality for the top 1 percent reported by BEA are low relative to other datasets, at just 12.6 percent of all income in 2016. But the share of economic growth accruing to the top 10 percent of income earners in the BEA data—37.6 percent of income—is more in the middle of the various datasets. This compression at the top of the income distribution could be due to the income concept used, or it could reflect differences in the datasets used to create BEA’s estimates. So, there is some ambiguity about how the levels of income inequality BEA reports compare to others.
The trends that BEA reports for 2007–2016 are similar to trends reported by Piketty, Saez, and Zucman, Auten and Splinter, and the CBO. But because BEA does not extend its estimates into the past prior to 2007, it is again difficult to say how BEA compares to these other datasets. Piketty, Saez, and Zucman and the CBO both report dramatic increases in inequality from 1980 forward, with the pace slowing in the 2000s and 2010s. Auten and Splinter report small increases in inequality in their pre-tax national income series and virtually no increase in inequality in their post-tax series over the same period. BEA has chosen to focus on recent history, so it can’t help us adjudicate these competing claims.
Takeaways
Policymakers and analysts should pay close attention to future releases of BEA’s distribution of personal income. Trends in the share of income held by top earners will indicate whether the benefits of the strong post-Great Recession economy have accrued to Americans broadly or to upper-income Americans more narrowly. Going forward, this new tool should give pause to those who target growth as a catch-all metric to indicate economic success. Too often, growth has been tilted in favor of those who are already doing well.