New data reveal how U.S. economic growth is divided

New estimates of U.S. economic growth released this morning by Gabriel Zucman and Emmanuel Saez at the University of California, Berkeley tell us, for the first time, how growth was distributed between rich and lower-income Americans in 2015 and 2016. Notably, 2016 was an especially poor year for working-class Americans in the bottom 20 percent of income, who saw their incomes decline by more than 3 percent as a group.
These new estimates are now available. The research team’s Distributional National Accounts dataset is a new contribution to the economic debate that decomposes aggregate economic output so growth can be reported not just for the economy as a whole but also for Americans up and down the income spectrum.
Per capita Gross Domestic Product growth in 2016 was weak: just 0.85 percent. National Income growth per adult (National Income is another way of measuring total economic output equal to GDP minus depreciation plus net income from abroad) was even worse, at -0.5 percent.1 But that burden was not borne equally. Poor Americans, already the least able to buffer against economic decline, saw the worst of it. Those with the highest incomes also experienced declines, while the middle class saw only modest gains. (See Figure 1.)
Figure 1
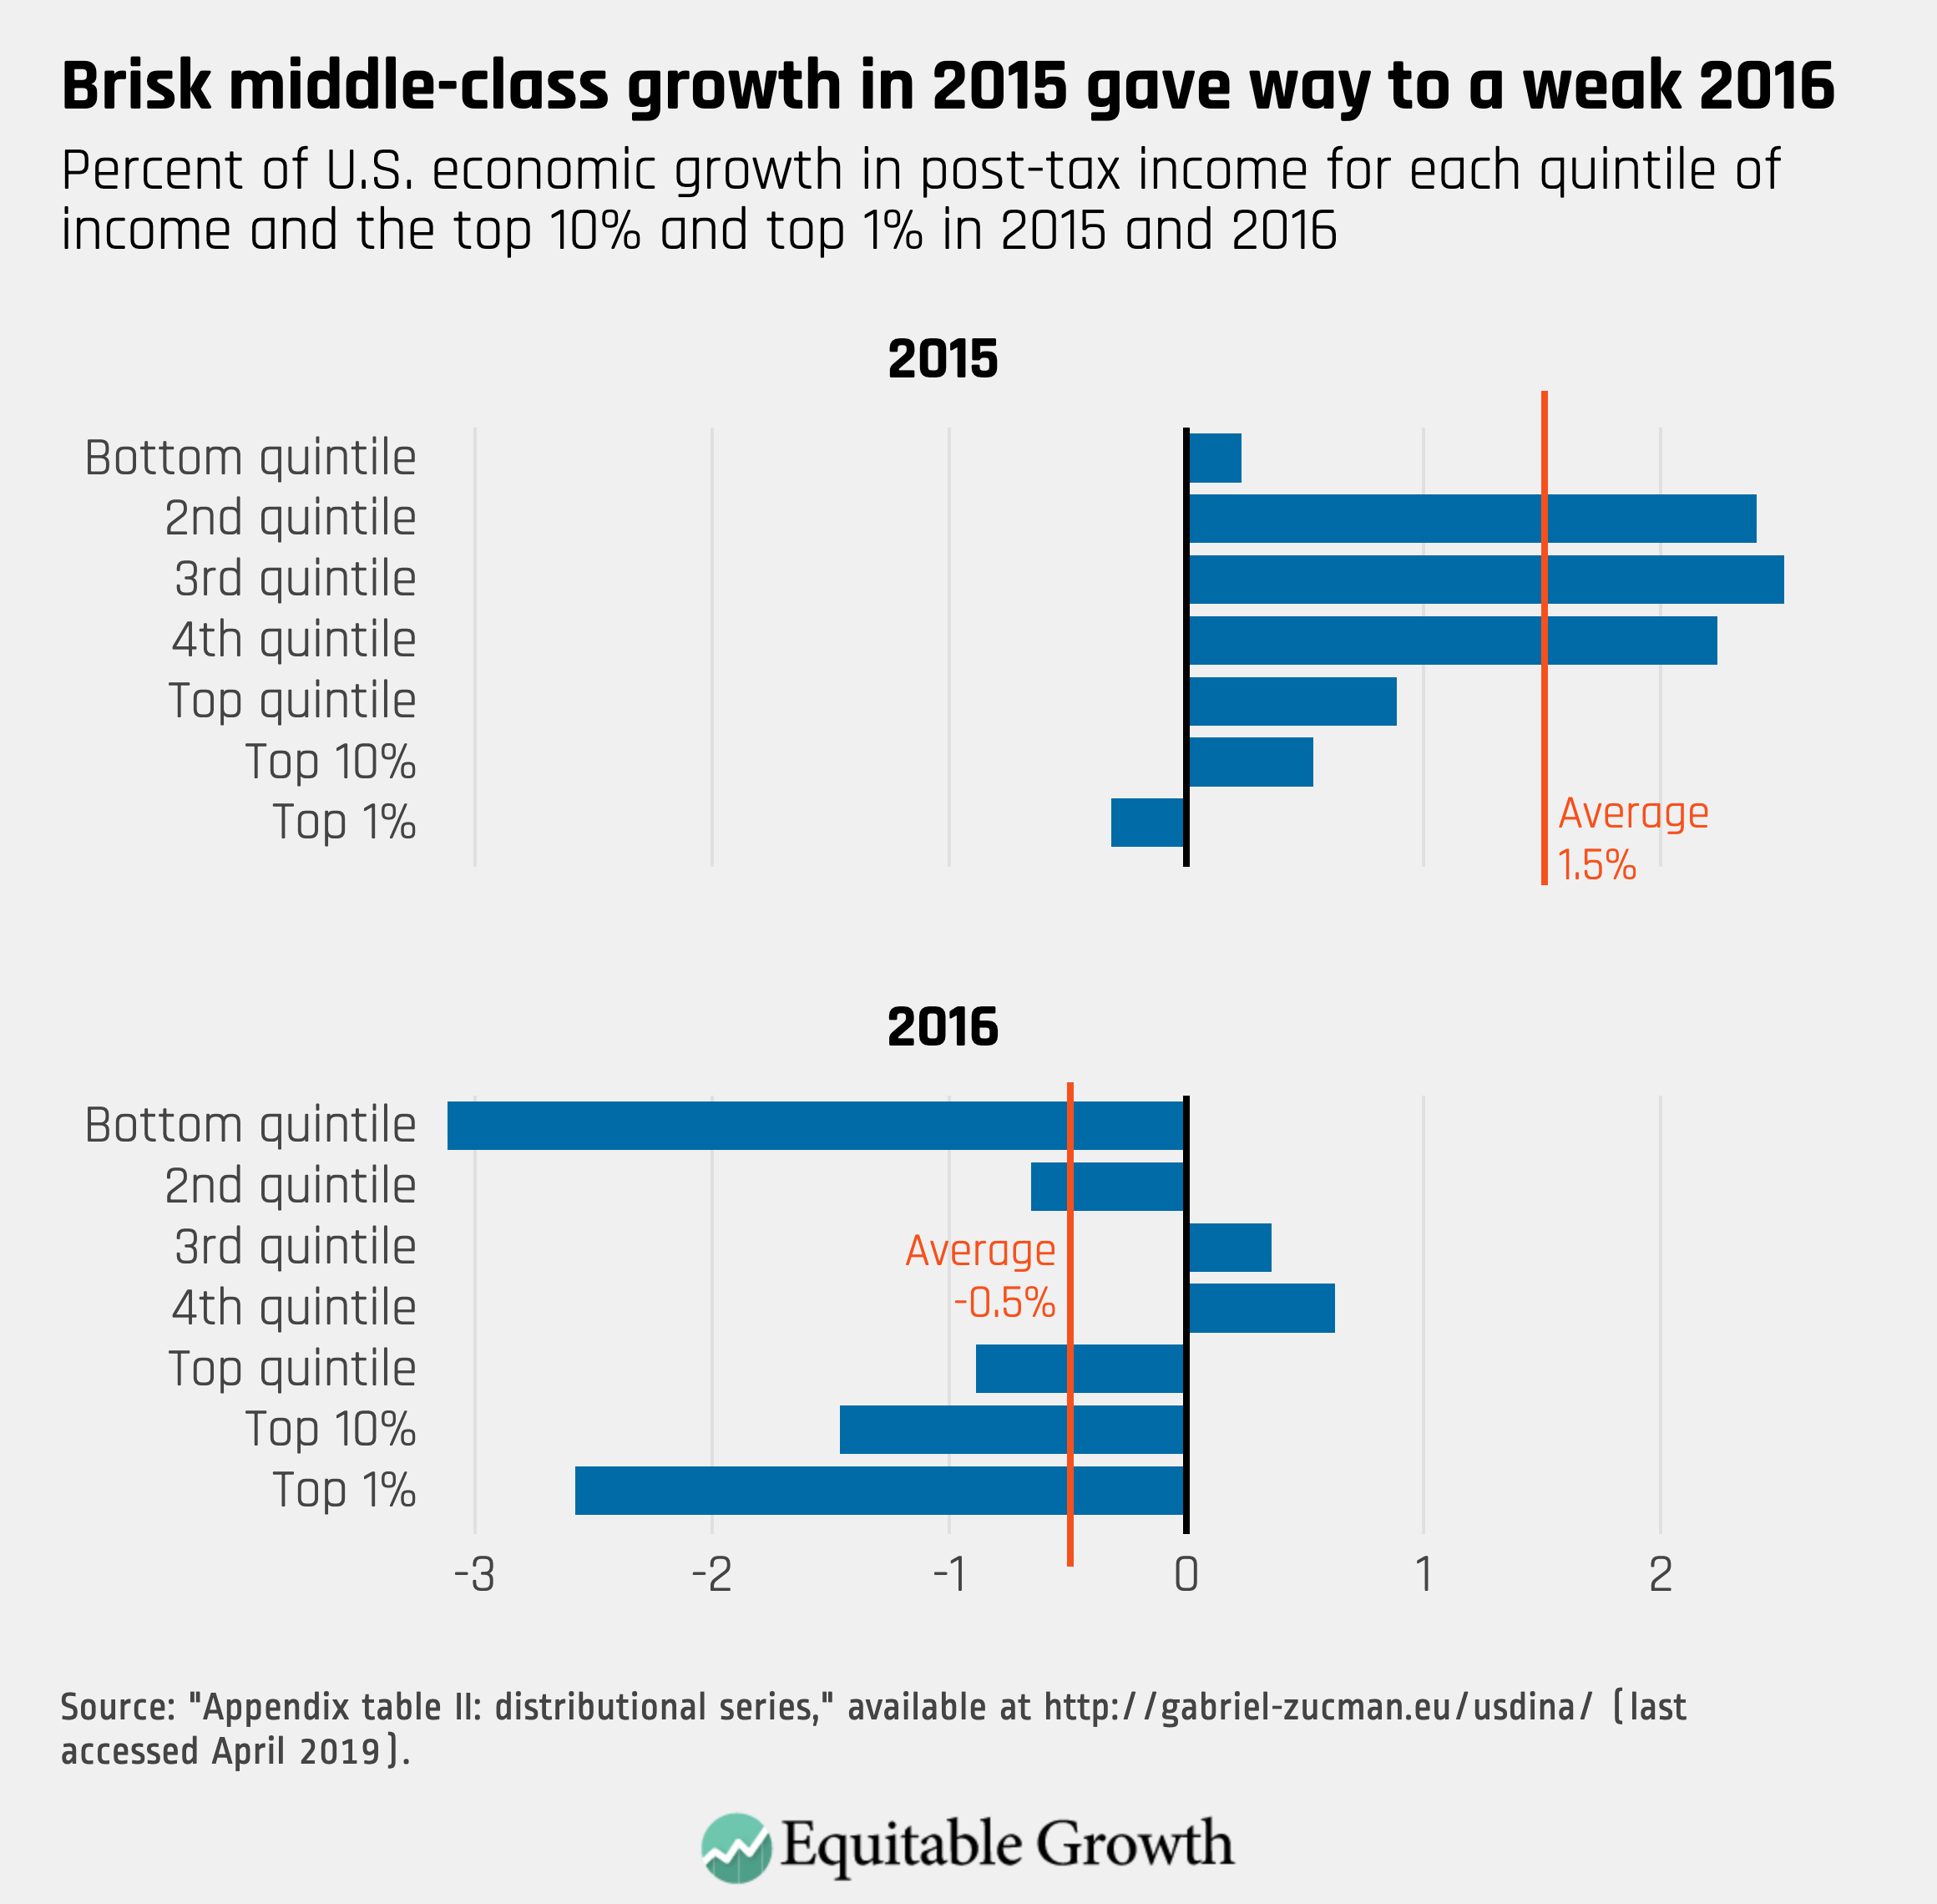
This slow growth in 2016 follows a relatively robust 2015, where average growth in National Income was 1.5 percent and the average middle-class worker saw income growth topping 2.5 percent. Strong growth in the middle class also meant that 2015 bucked a decades-long trend of growth primarily benefitting those with the highest incomes. Incomes at the very top were up only modestly, compared to others, and were down slightly for the top 1 percent of earners. Since the early 1980s, broad-based growth such as this has been rare.
These new results underscore that the picture of the economy painted by the quarterly GDP growth report is increasingly misleading in an age of rising economic inequality. GDP growth is a one-number summary that was designed to represent the raw production power of the U.S. economy, but it is often understood as a measure of the well-being of the American worker, despite its inability to tell us about the lived experience of Americans at different levels of income. Addressing this problem requires a new approach to measuring and reporting national output. To measure who prospers when the economy grows, the United States should adopt a new version of GDP—call it GDP 2.0.
Members of Congress in both chambers have introduced legislation that would require the U.S. Bureau of Economic Analysis to report how growth is distributed among workers at different levels of income. The Measuring Real Income Growth Act is sponsored by Sens. Chuck Schumer (D-NY) and Martin Heinrich (D-NM) in the Senate and Rep. Carolyn Maloney (D-NY) in the House of Representatives.
Measuring who prospers when the economy grows and reporting on the fortunes of different income groups, as the researchers behind these new numbers do, yields important insights about the U.S. economy and suggests that more rigorous policy interventions are needed to bolster working-class incomes and fight income inequality. Figure 2 shows how National Income growth has been distributed in each year since 1963, with the poor and middle class represented by cool colors and the richest 10 percent of the population represented by warm colors.
Figure 2
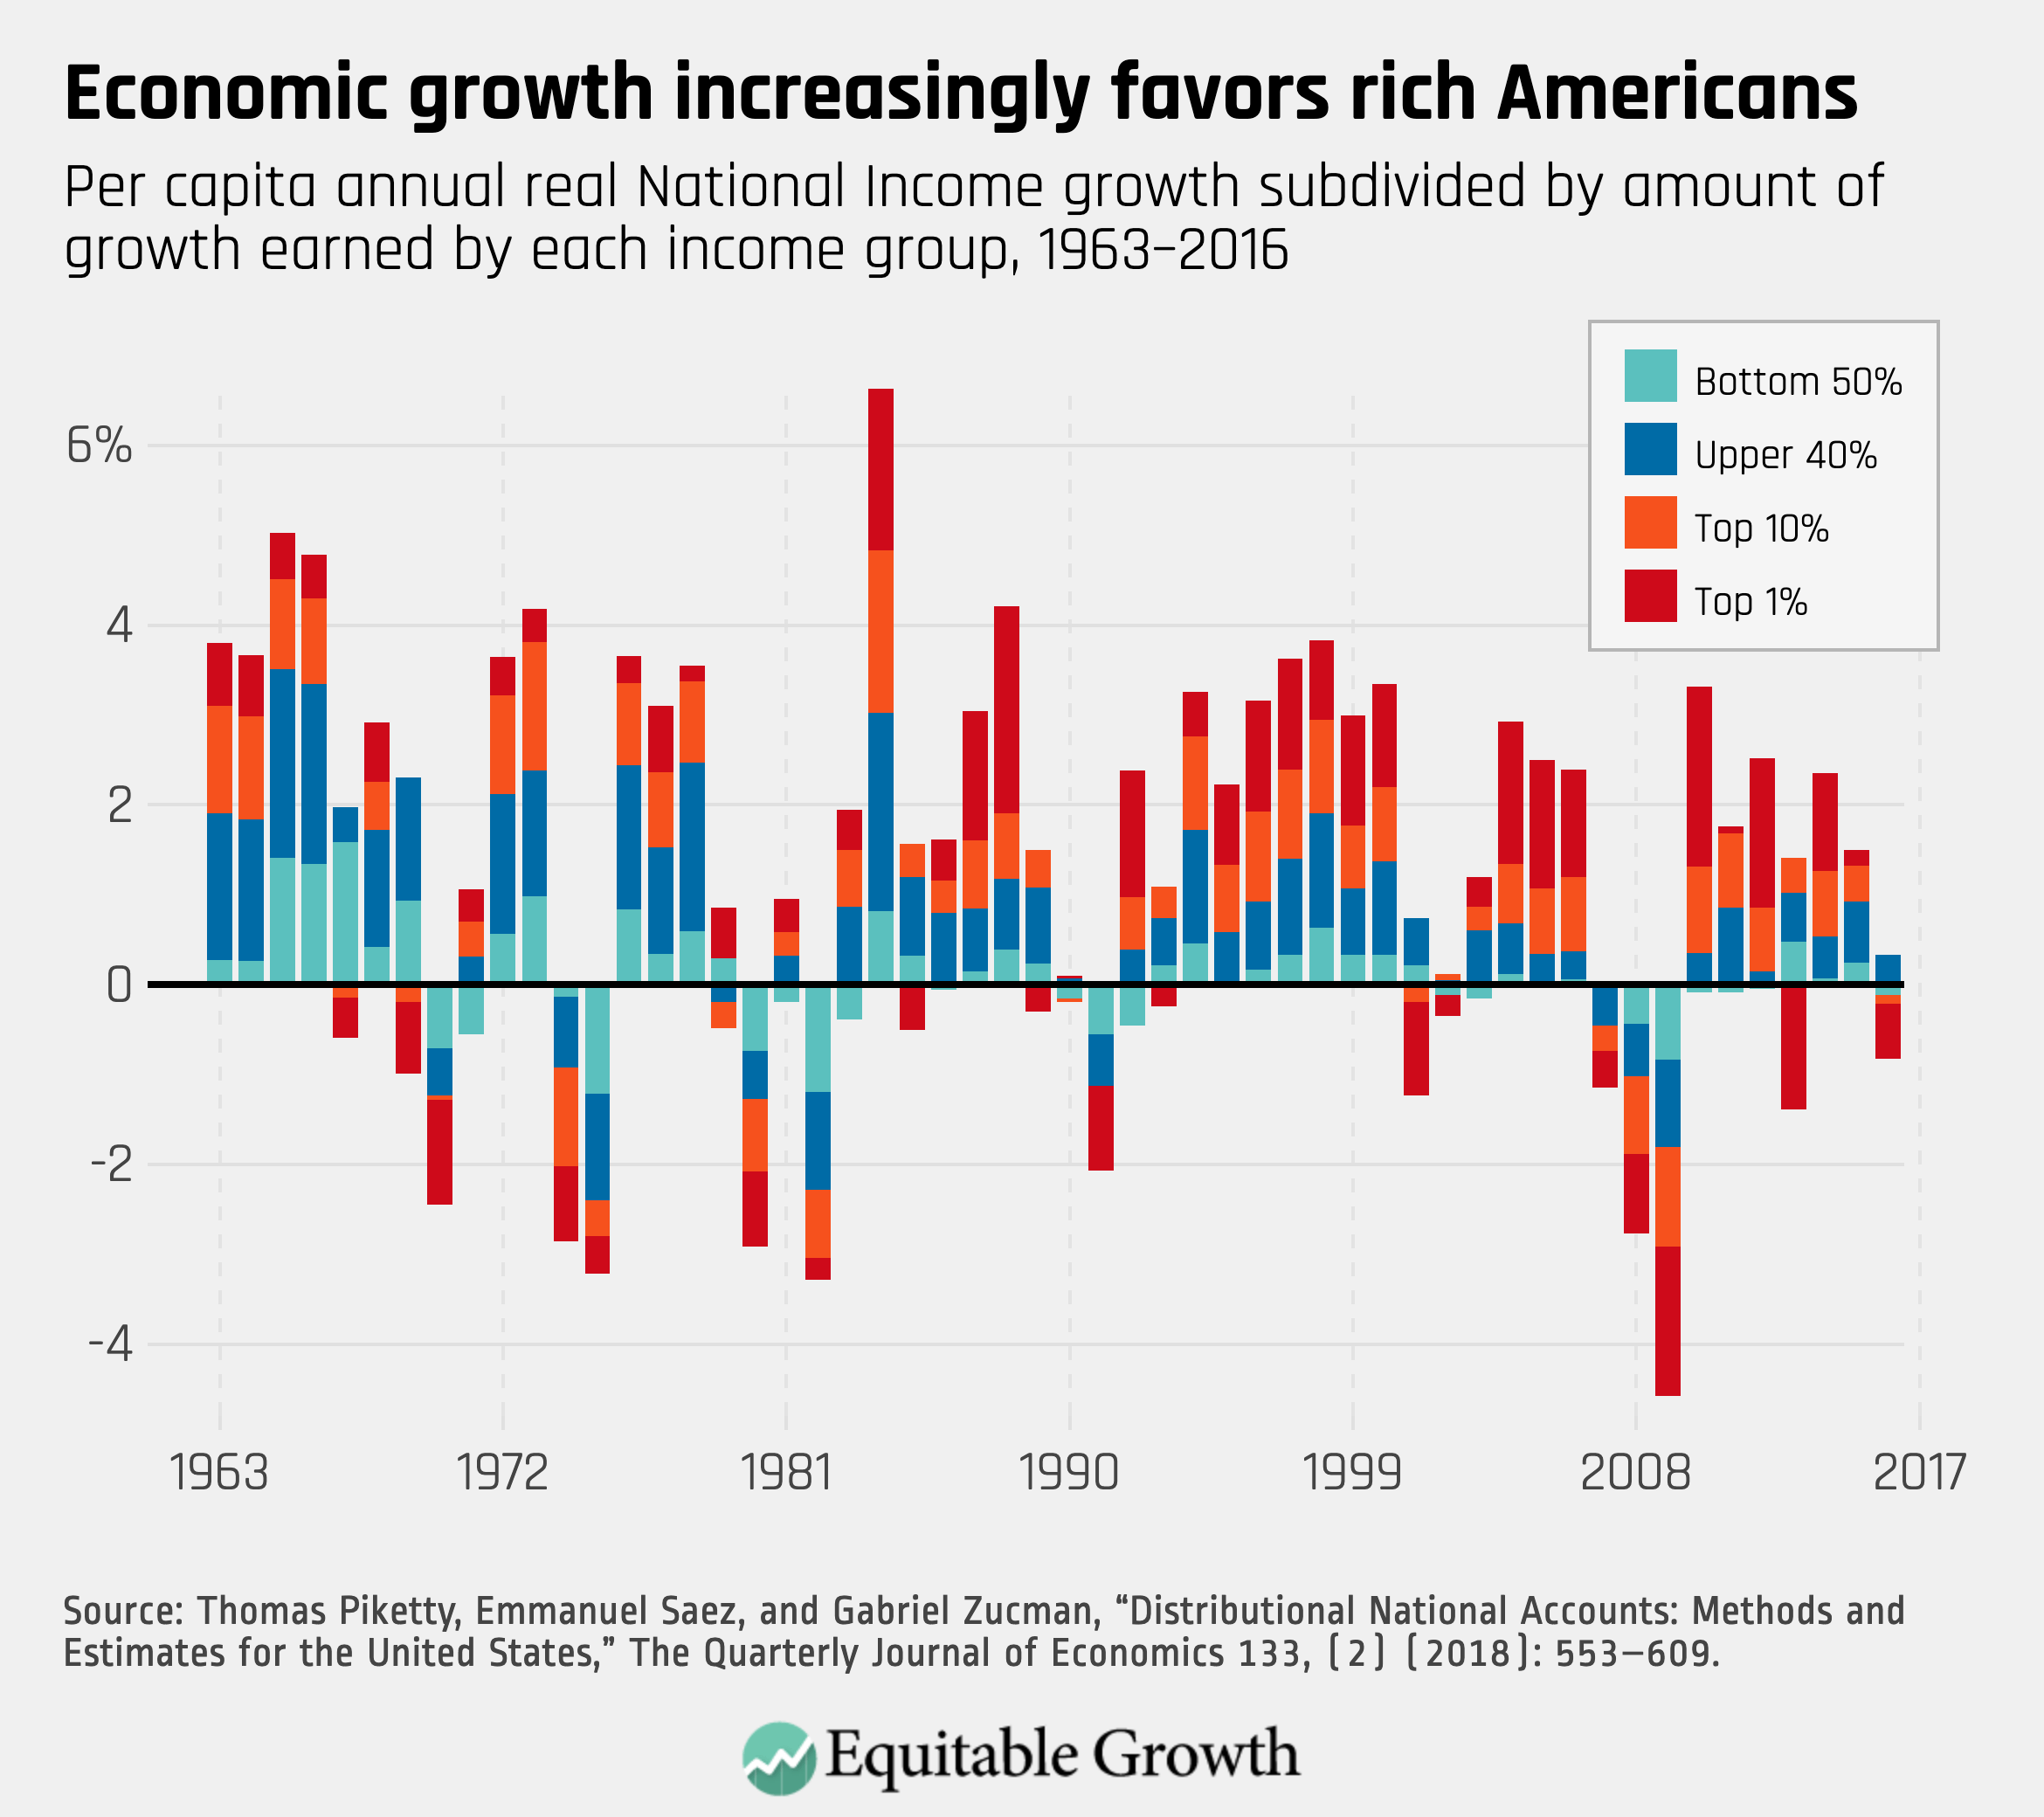
As Figure 2 shows, the benefits from economic growth have disproportionately accrued to the top 10 percent since the early 1980s. Progress for the bottom 50 percent has almost completely collapsed over the same time period. Since 1980, the richest 10 percent of Americans have captured more than half of all growth in the economy. Meanwhile, working-class Americans with below-median incomes have received just 10 percent of all growth. Americans in this group are keeping up with inflation but have relatively stagnant incomes; they are essentially treading water.
The past three economic expansions have largely benefitted the top 10 percent. In each, the top decile received between 47 percent and 59 percent of all income growth in the expansion. The losses endured during contractions were similarly distributed. (See Figure 3.)
Figure 3
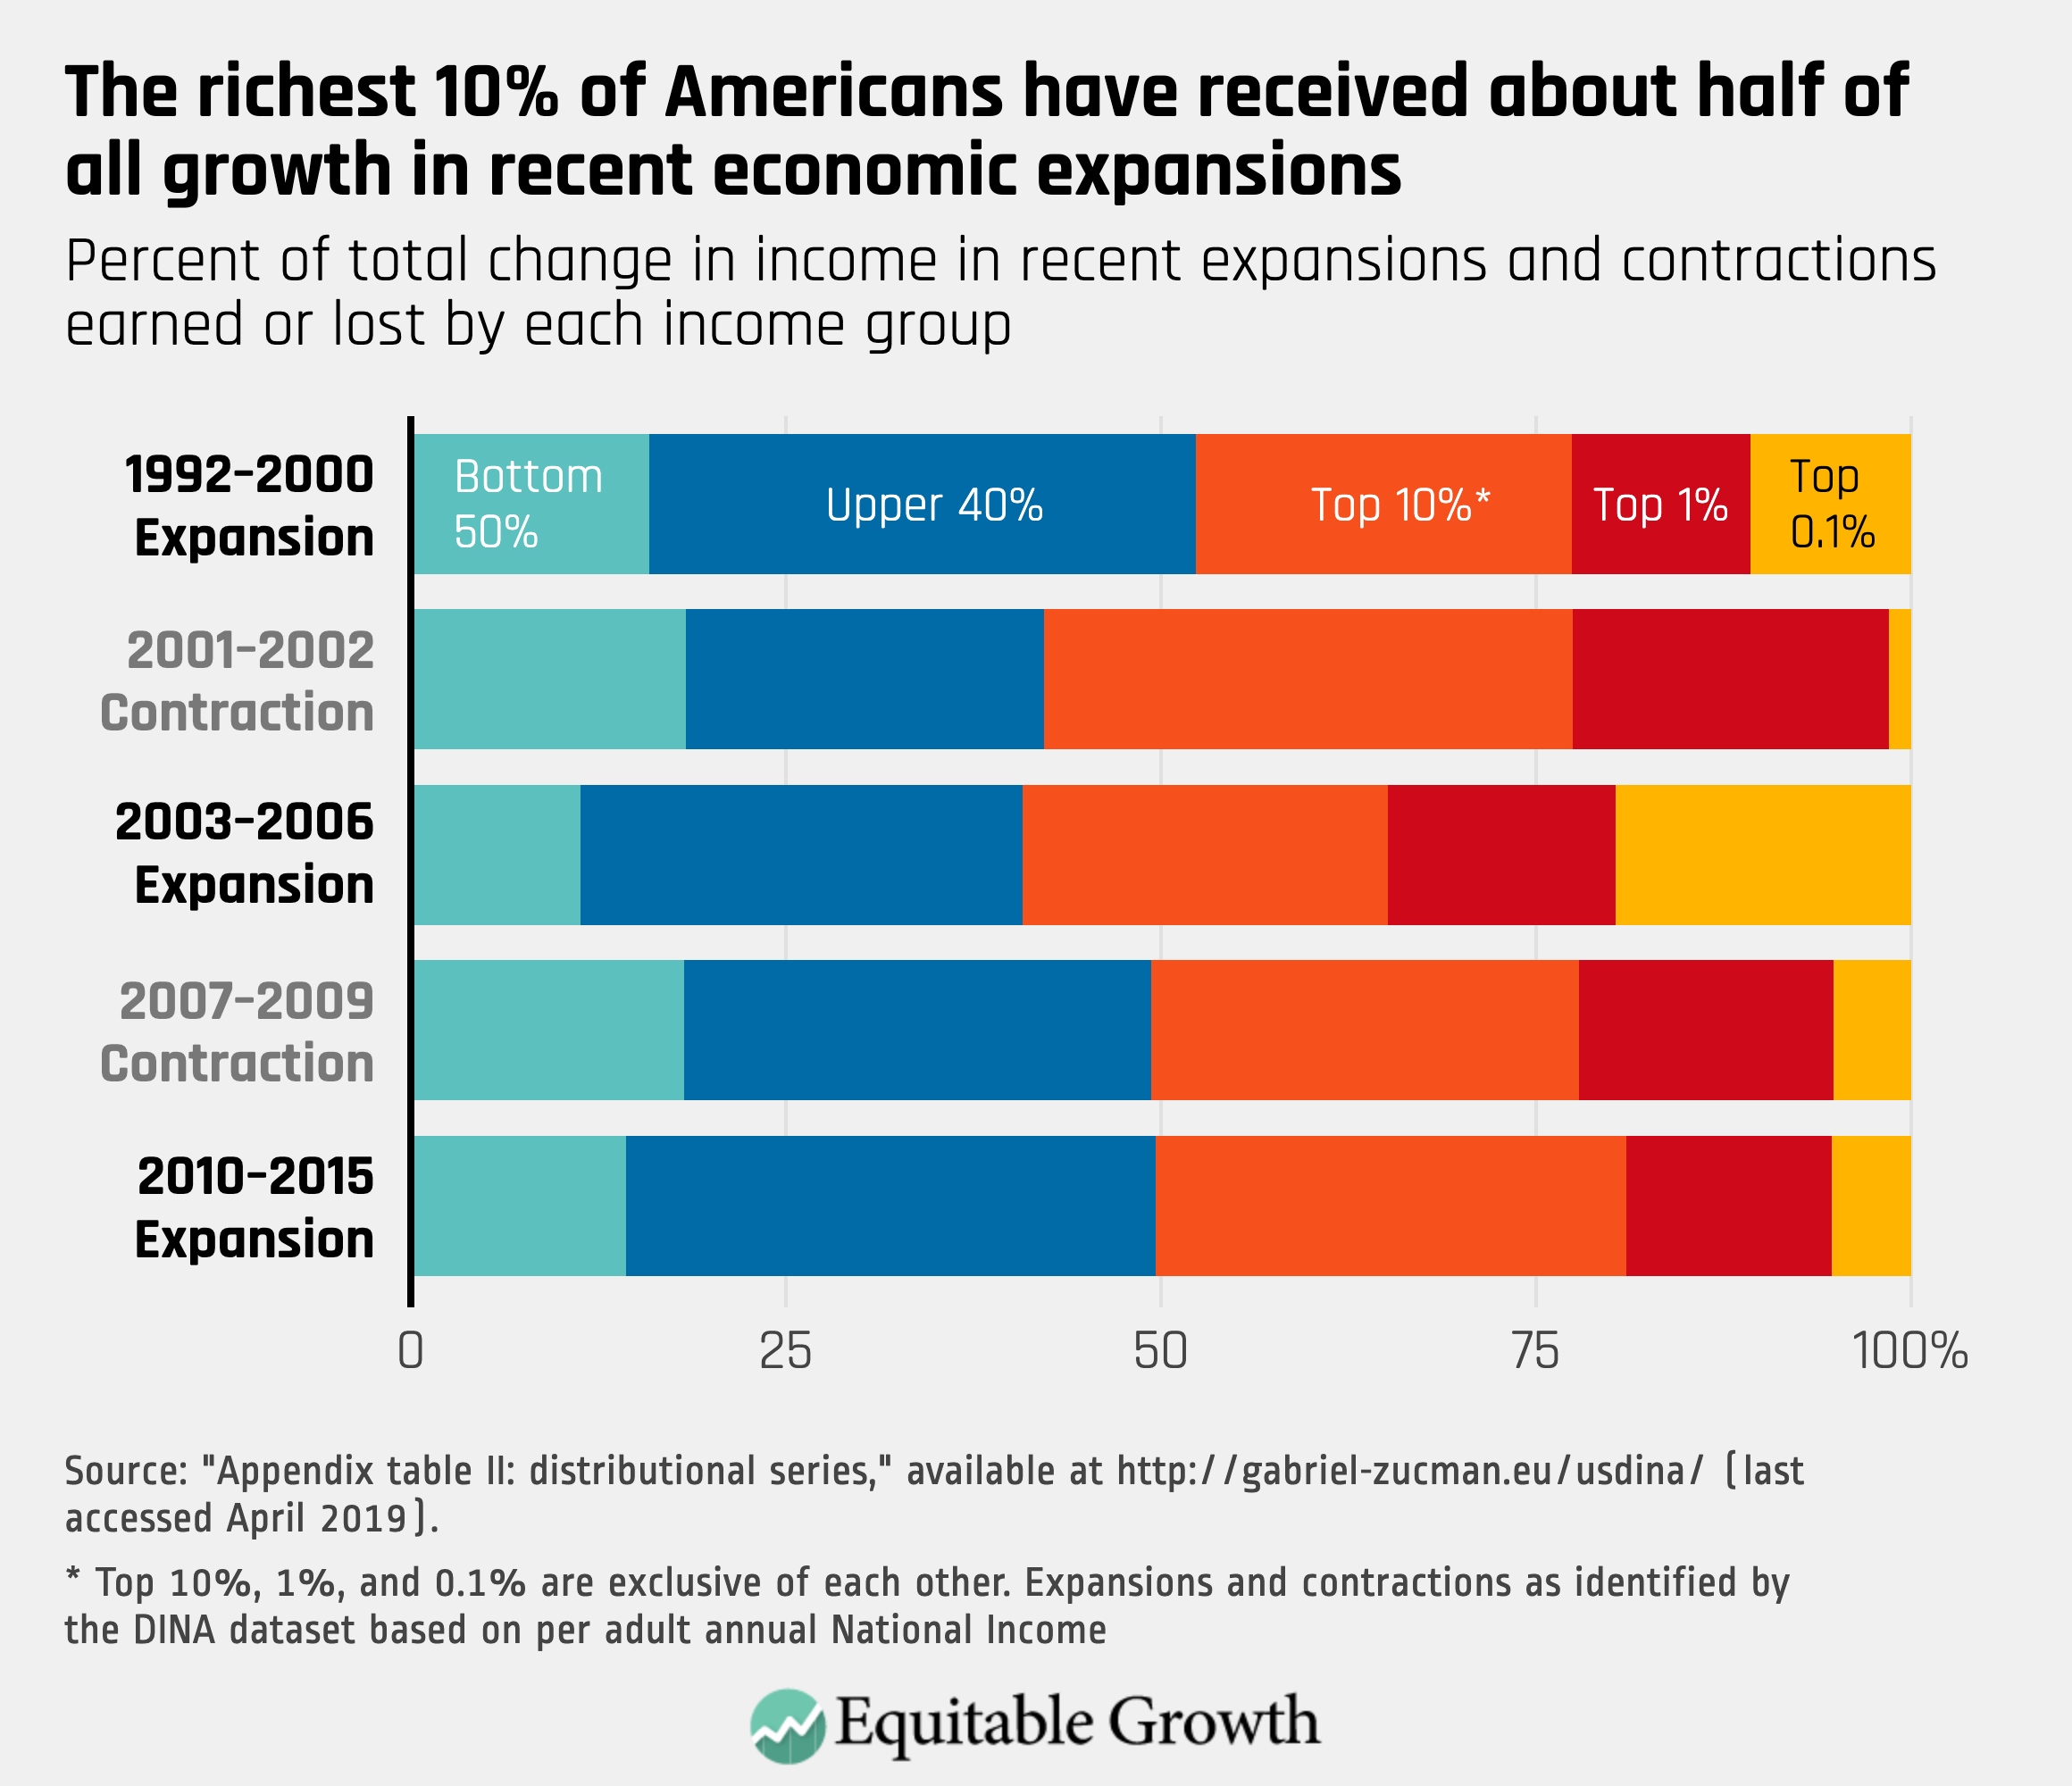
A significant tax cut passed during the George W. Bush administration that primarily benefitted those in higher brackets and the booming financial sector of the early 2000s probably contributed to the less equitable growth amid the 2003–2006 expansion. But the dismal growth seen by the bottom 50 percent in each of the past three expansions points to the persistence of inequitable growth in the U.S. economy and suggests that there is room for more aggressive policy to address inequality.
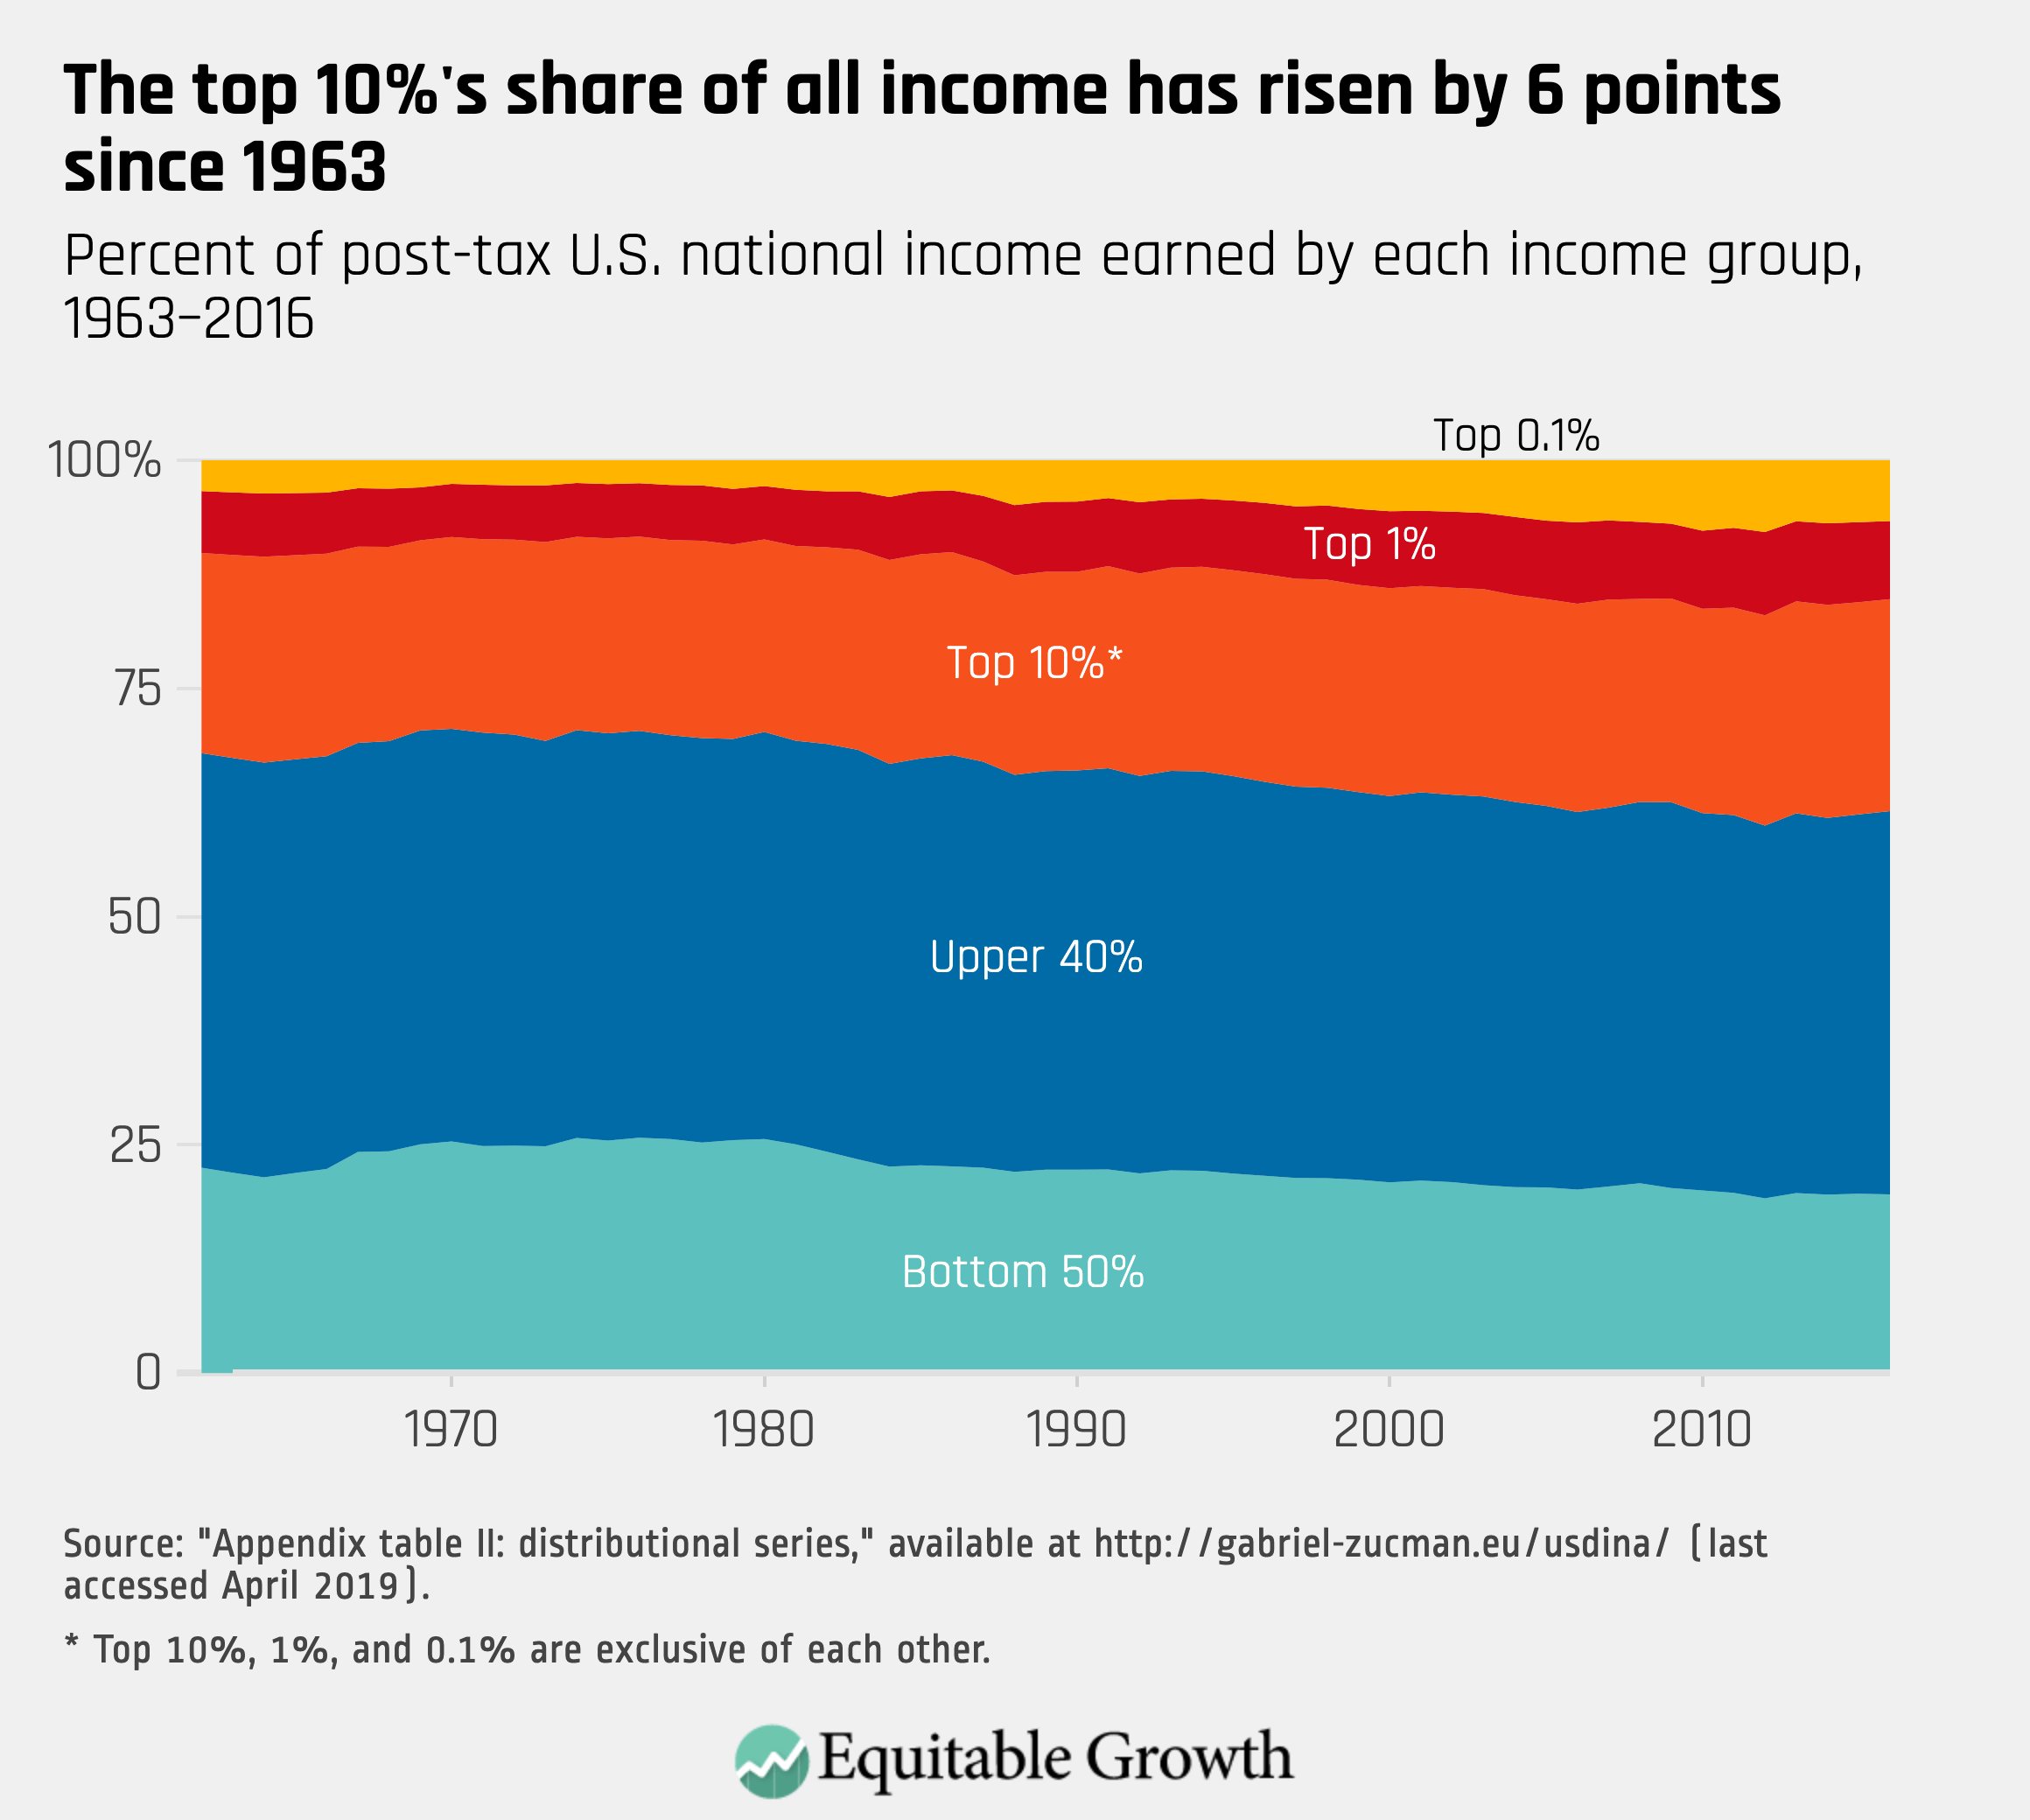
The share of total economic income held by the top 10 percent dropped slightly between 2014 and 2016, from 39.2 percent to 38.4 percent. Its high was 40 percent in 2012, a rise of more than 10 percentage points from lows of around 30 percent in the 1960s and 1970s. Figure 4 charts the steady rise of top 10 percent’s share of income.
Figure 4
Evidence shows that economic inequality is a threat to the overall strength and stability of our economy. Ensuring our economy works for all Americans—and not just for those at the top—starts with collecting the data that allow policymakers to accurately measure how the U.S. economy is performing at all income levels. Without that window into the lived experiences of households—rich and poor—policymakers will remain severely hampered in their ability to fight for equitable growth. Passing the legislation introduced by Sens. Schumer and Heinrich and Rep. Maloney is a necessary first step for governance that aims to achieve economic progress for all Americans.
In this video, Heather Boushey, executive director of the Washington Center for Equitable Growth, explains the importance of measuring who prospers when the economy grows. Historically, policymakers have relied on gross domestic product, or GDP, to measure the state of the U.S. economy. But in today’s era of increasing inequality, aggregate GDP statistics do not reflect the lived reality of most Americans, underscoring the need for new data on how the economy is performing for Americans at all income levels.
End Notes
1. The academic team responsible for these estimates calculates annual growth slightly differently from the BEA. They use adults over the age of 20 instead of the entire population to get their per capita measure, and they deflate NI according to the Net National Product Deflator in BEA table 1.7.4.