U.S. income growth has been stagnant. To what degree depends on how you measure it.
![]()
A recent Congressional Budget Office report on the distribution of incomes in the United States back in 2015 has sparked debate over whether Americans are actually experiencing good income growth. By some measures, middle-class Americans have seen very little income growth, dating back to the 1990s or even the 1980s. It is a common view among economists that wage growth is the one sore spot in an otherwise good U.S. economy—to the point that the trend boasts the colloquial name of the “wage puzzle.”
But according to Washington Post columnist Robert Samuelson, the new CBO report is evidence that talk of stagnation is overblown. This report, called “The Distribution of Household Income 2015,” is one of the best federal data products for tracking income and income inequality in the United States. Instead of relying on survey data, as the Census’s “Income and Poverty in the United States” report does, CBO uses administrative tax data, which gives a clearer picture of how incomes are changing for high-income individuals.
Nonetheless, the CBO report needs to be interpreted carefully. Ultimately, this debate is a reminder that we do not currently have a regularly produced national data product that is designed to accurately measure the distribution of income in the U.S. economy. The adoption of better official measures of inequality is long past due.
Overall, the CBO report finds a significant growth in inequality since 1979, with incomes among the top 1 percent rising 242 percent, compared to an overall average of just 70 percent (after accounting for inflation). But Samuelson points to what he considers strong growth of 79 percent for the bottom fifth of income earners. CBO finds that earners in the middle class—those between the 20th and 80th percentiles of income—fared the worst over this same period, accruing income gains of only 46 percent. (See Figure 1.)
Figure 1
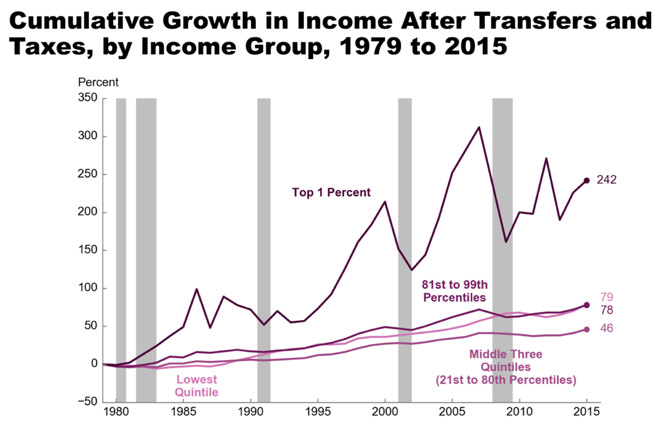
But this graph should be interpreted carefully. Despite the name of the report—“The Distribution of Household Income”—the statistical design is primarily focused on analyzing the impact of federal welfare policy and federal taxation on incomes of Americans up and down the income ladder. In fact, earlier iterations of this report were simply called “Effective Federal Tax Rates.”
This analytical focus has important consequences for talking about income growth, as Samuelson does, and about income inequality generally. State taxes, for example, are not part of the analysis at all—even though state taxes are generally regressive, and including them would increase income inequality and could also have an impact on income growth patterns over time.
But the most significant and often overlooked aspect of CBO’s focus on the impact of federal policy is how it treats incomes before and after the federal government redistributes income in the form of transfer and tax policies such as supplemental nutrition assistance and the Earned Income Tax Credit. CBO calculates income before these taxes and transfers and then ranks everyone by income.1 After separating individuals into quintiles, they hold those groups constant and report incomes after taxes and transfers for each of those quintiles without re-ranking any of the individuals in them.
This approach is useful for describing the impact of federal policy on the people who compose a pretax quintile. But it does not accurately describe the shape of the income distribution after taxes and transfers have been applied. Because many individuals in the bottom fifth of the income distribution on a pretax basis will move up into the second fifth of the income ladder on an after-tax-and-transfers basis, while others will move down the after-tax income ladder, the bottom fifth after taxes and transfers will consist of different people, and the group will overall be worse off than the group of individuals ranked by before tax and transfer income. If, instead, individuals are re-ranked in the post-tax-and-transfer distribution,2 then incomes for those in the bottom fifth have increased by 62 percent since 1979 not 79 percent, as CBO reports, while income growth among the top 1 percent is virtually unchanged because government taxes and transfers do not cause significant re-ranking in this group.
Neither method is more correct; they just do different things.
CBO’s method is a better way to think about the effects of federal government policies related to U.S. incomes. Re-ranking is a better way to think about the overall shape of the income distribution and income growth within different quintiles of income earners over time. The CBO report is a great data product, but it’s not the right one for every situation. Importantly, its analytical limitations underscore how urgently we need better measurement of inequality by our federal statistical agencies.
Let’s return to Samuelson’s claim that the report shows that income stagnation is a myth. Is 62 percent income growth good income growth? That’s a matter of perception. From 1979 to 2015, overall income growth averaged 1.4 percent annually (with re-ranking, as described above). But for the middle class, it was just 1.1 percent. The top fifth of income earners accrued 1.9 percent growth annually, while the top 1 percent of households saw annual growth of 3.3 percent. The bottom fifth saw growth in line with the average at 1.4 percent.
And an analysis of just the recent data reveals even bleaker trends. Average annual growth between 2000 and 2015 is just 0.8 percent. This income growth was shared more equally, thanks to large declines in income at the top of the distribution due to the Great Recession (as seen in Figure 1). Stagnation is in the eye of the beholder, but income growth of less than 1 percent per year is consistent with the idea that our economy is producing poor wage gains for most workers.
End Notes
1. There’s a little more to it here. They actually equivalize incomes to perform this ranking. Equivalizing is a method of adjusting incomes for family size to reflect the idea that shared housing expenses mean that large households with a set amount of money are actually doing a bit better than their income suggests, compared to a single person. CBO has a wonderful doc that summarizes its methodology here.
2. Possible thanks to the supplemental files provided by CBO.