Testimony by Heather Boushey before the Joint Economic Committee
Washington Center for Equitable Growth
Testimony Before the Joint Economic Committee
Hearing on “Examining the Rise of American Earnings and Living Standards”
September 26, 2018
Thank you, Chairman Paulsen, Vice Chairman Lee, and Ranking Member Heinrich for inviting me to speak here today. It’s an honor to be here.
My name is Heather Boushey and I am Executive Director and Chief Economist at the Washington Center for Equitable Growth. We seek to advance evidence-backed ideas and policies that promote strong, stable, and broad-based economic growth.
I’m here today to talk about how we can improve economic outcomes for American workers. Over the past four decades, the typical American worker has been left behind. While incomes and wealth surge at the top, earnings for low- and middle- income Americans have stagnated.
Unfortunately, the recently passed Tax Cuts and Jobs Act will, according to all credible observers, contribute to inequality in the United States. And, because it limits our ability to bring in revenue, it will also hinder our ability to finance infrastructure, social insurance, education, and other spending priorities that strengthen our economy and support workers and families.
High levels of inequality have real consequences. The “American Dream,” an article of pride and faith for Americans, is being undermined by policies like the Tax Cuts and Jobs Act. Income mobility in the United States has fallen precipitously since the middle of the 20th century. It was once the case that all Americans enjoyed the fruits of economic prosperity, but as the economy works for fewer and fewer people, it is more difficult than ever for children to exceed the reach of their parents.
Policies that have benefits primarily for the rich are often justified by the promise of economic growth. But “growth” doesn’t automatically benefit everyone. And if growth does materialize, the pattern of our modern economy is to reward it to those who need it least.
These realities are given little attention in part because we do not always know who benefits when the economy grows. Our statistical agencies report aggregate growth and in an era of rising inequality, average and aggregate measures are becoming less informative about the experience of most Americans. While the administration was touting the 4.1 percent growth in GDP in the second quarter as evidence of the success of the tax cuts, the question we need to ask is who benefitted from that growth? Did it mostly go to those at the top of the income ladder – just like the tax benefits themselves?
Because we don’t know the answer to these questions, policymakers like you have a limited view of how our economy is performing. This lack of data hinders our ability to diagnose problems in the economy and preempt them with appropriate policy. Our economy has changed fundamentally, and, in many ways, we are flying blind when it comes to responding appropriately.
The Measuring Real Income Growth Act of 2018, which was introduced by Senator Schumer and Ranking Member Heinrich this month, and an identical bill that was just introduced by Representative Maloney, would help us to understand more about what is happening to our friends and family in your districts and across the United States. This legislation would add distributional measures of economic growth to our policymaking toolbelt. These measures are already the subject of a major academic project that dozens of economists at universities and within the OECD are participating in. They break down growth at the national level to report growth for workers up and down the income spectrum and give us new insights into how the economy has changed and where it might be going.
Implementing Distributional National Accounts here in the United States would provide policymakers with a new tool to track the progress of the economy, evaluate how past policy is changing our economic fortunes, and guide future economic decision-making. It is especially important to implement now as the American economy continues to exhibit increasing inequality, returning us to levels of inequity that we have not seen for nearly a century.
Implementing these measures is critical to the wellbeing of Americans across the country. Present policies may be exacerbating the rise of inequality, but the currently available data requires us to assemble this story piecemeal, sometimes with lags of several years, and we still do not have a complete picture. If we want to build an economy that benefits all Americans, we need to add these distributional statistics to our arsenal now so that policymakers, pundits, and the public can assess where we are and plan for more broad-based, stable economic growth.
Distributional National Accounts: Measuring the right things
Distributional national accounts refers to adding subpopulation estimates of income growth to our existing National Income and Product Accounts reports. Currently, the U.S. Bureau of Economic Analysis releases a new estimate of quarterly or annual GDP growth every month. Distributional national accounts would add to this release an estimate that disaggregates the topline number and tells us what growth was experienced by low-, middle-, and high-income Americans.
Academics have already constructed such a measure. The so-called DINA dataset constructed by economists Thomas Piketty, Emmanuel Saez, and Gabriel Zucman disaggregates National Income growth from 1962 to 2014. 1 This dataset gives us a complete picture of how inequality has changed in the United States over time and how recent growth in national output is being shared by Americans. In 2014, for example, total National Income growth was 2.1 percent. According to the DINA dataset, income growth for the lowest-earning 50 percent of all Americans was just 0.4 percent, while growth for the richest 1 percent of Americans was 5.3 percent. (See Figure 1.)
Figure 1
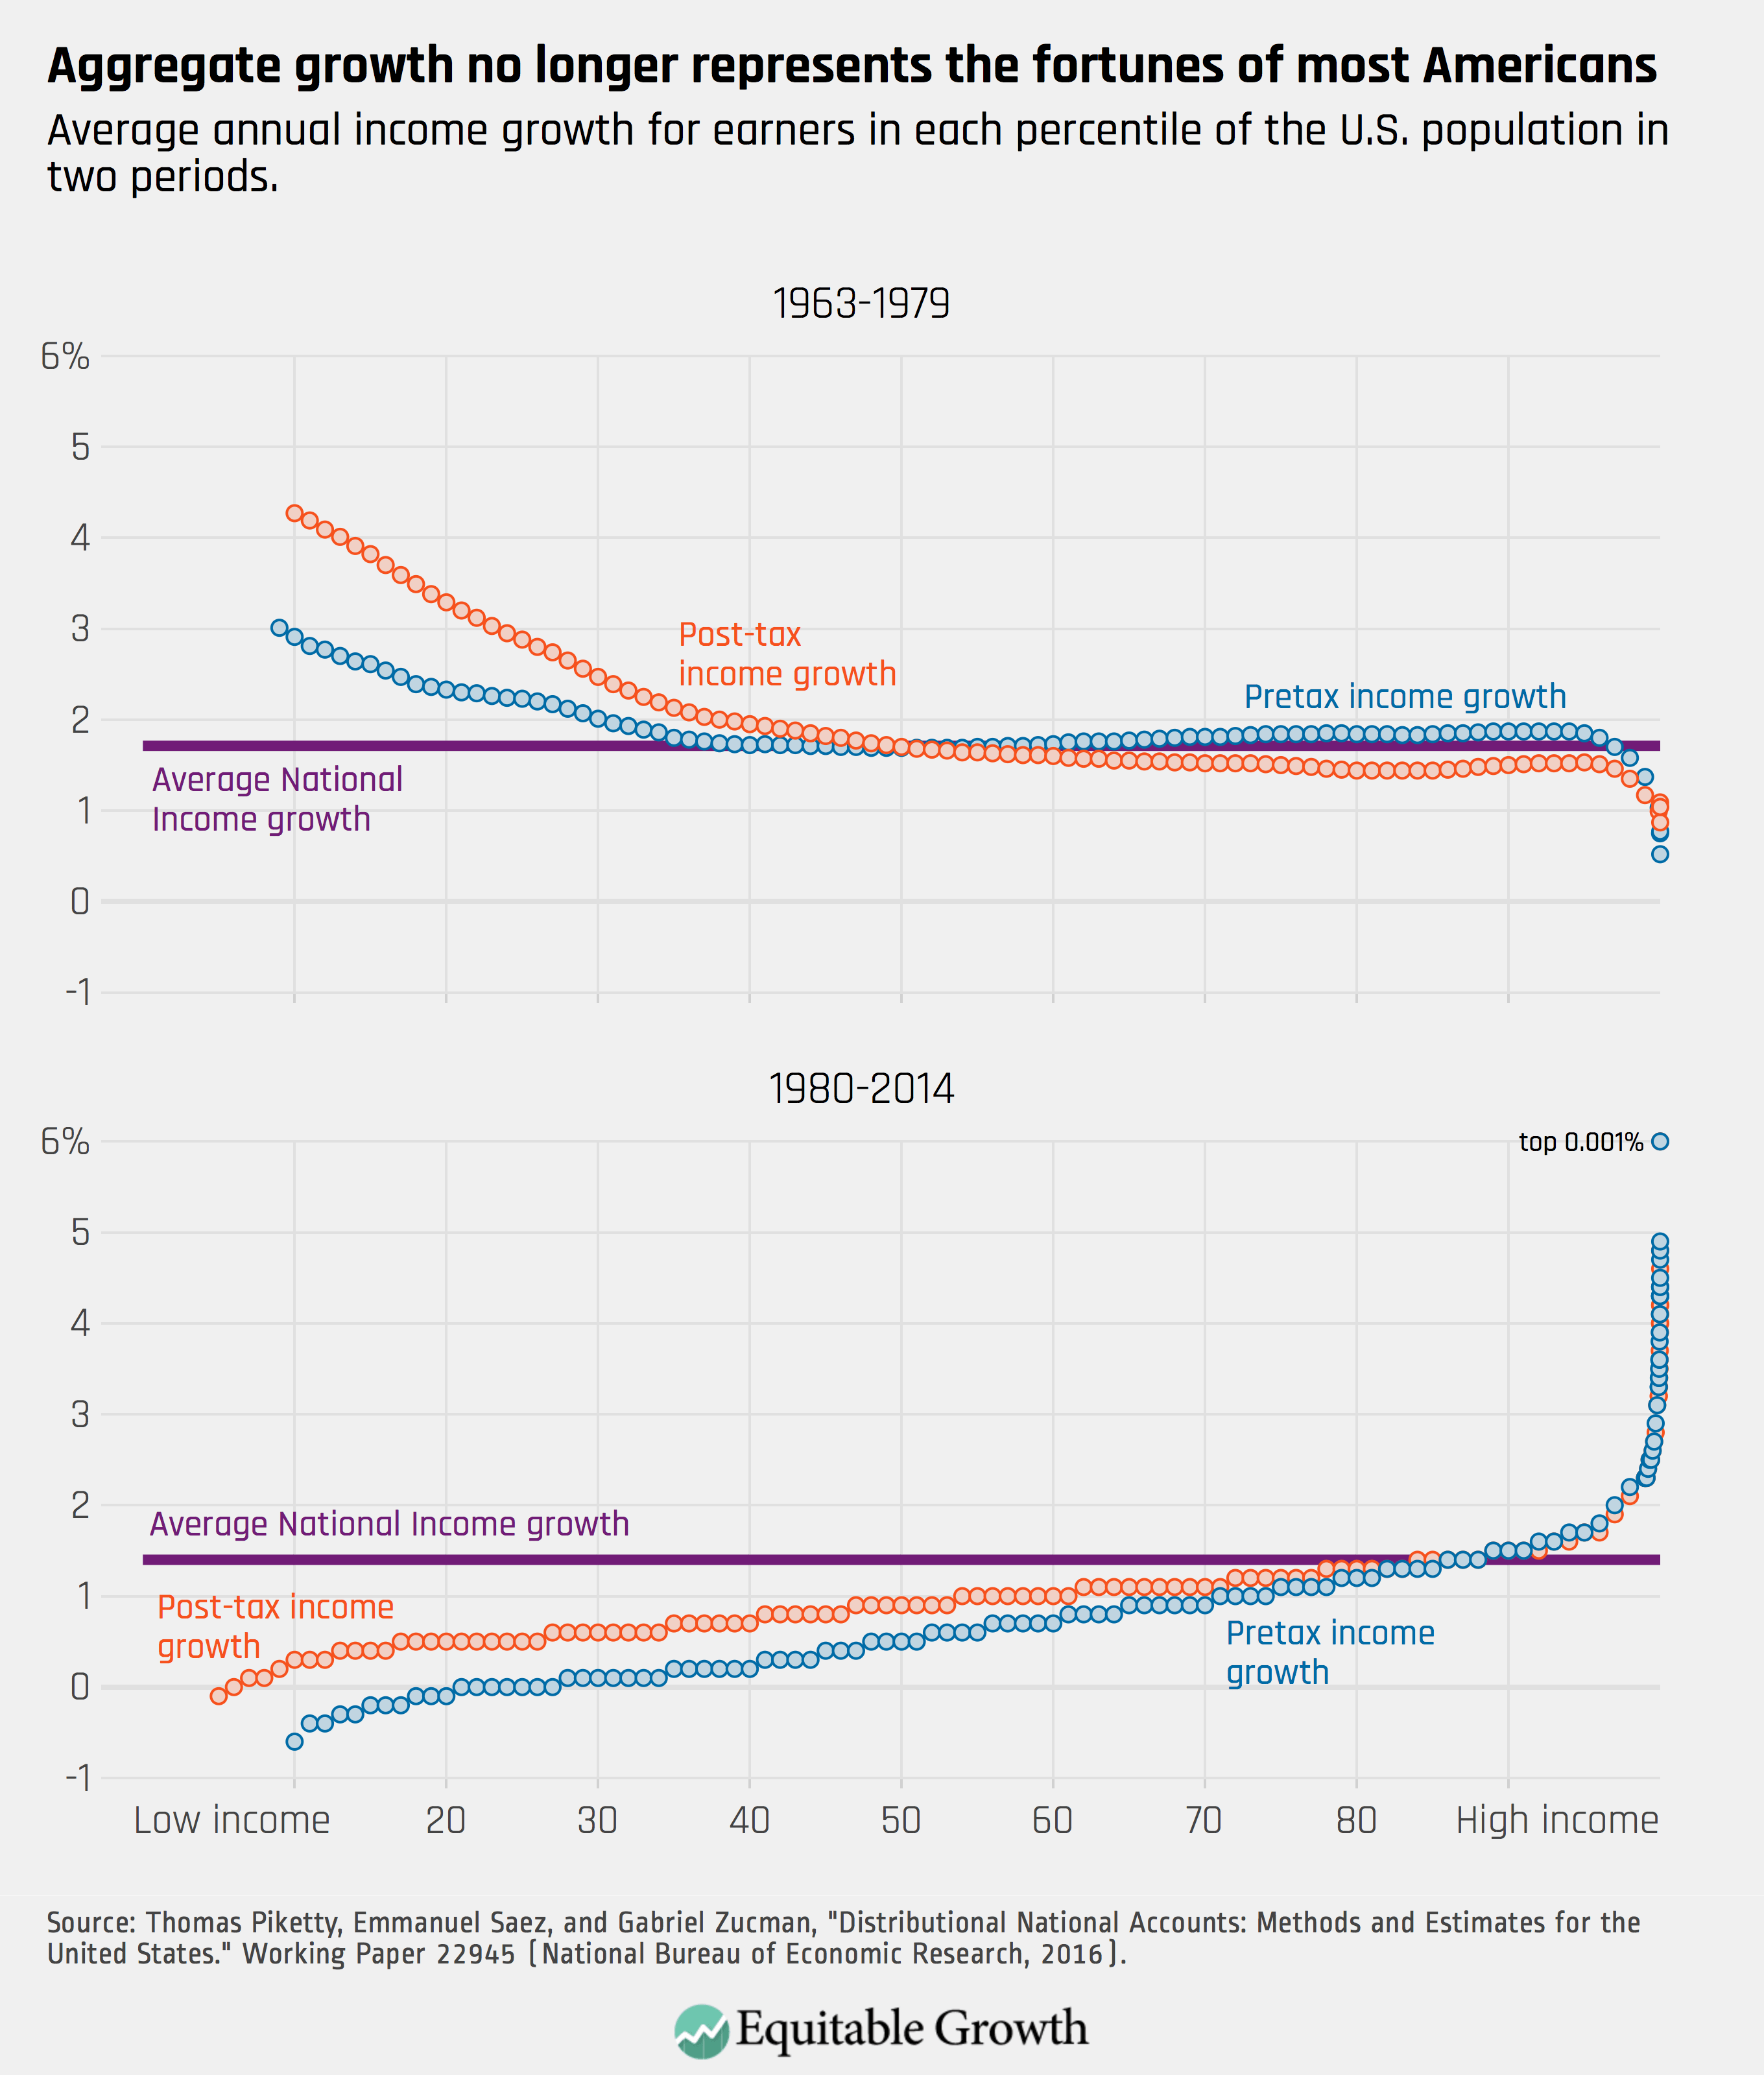
Over the period from 1980 to 2014, average growth was about 1.4 percent annually. However, the bottom 90 percent of all adults saw income below this. Only those in the top ten percent experienced better than average growth.
This is a new phenomenon. The DINA dataset shows that prior to this period, there was little need to disaggregate national growth because the headline GDP growth statistic was broadly representative of most Americans. Average growth was around 1.7 percent between 1963 and 1979 – higher than in the years since. And, that growth was broadly shared as the scatter plots of pre- and post-tax income growth for each percentile of income show. Most Americans saw income growth at or above that average. (See Figure 1.)
GDP growth, in effect, is now decoupled from the fortunes of most Americans. What was once a useful indicator of how most families were fairing is now unmoored from the experience of most families. It is because of this divergence that the Income Growth Indicators proposed by Senator Schumer, Ranking Member Heinrich, and Representative Maloney must be added to our monthly GDP reports so we can understand how the economy is performing for Americans up and down the income ladder.
GDP growth has been treated for decades by pundits and policymakers alike as synonymous with prosperity, but this is no longer a useful indicator of well-being. President Kennedy famously alluded to it when he said that “a rising tide lifts all boats.” In the decades since, economists and commentators have used the metaphor of “growing the pie” to indicate that we should first and foremost be concerned with growing the economy rather than concerning ourselves with who gets a slice.
But GDP is a first and foremost a tool for thinking about total output and how different sectors of the economy are faring. It was never really intended to be a measure of the wellbeing of individuals in the economy, as it is now sometimes used. Simon Kuznets, the economist who assembled the first report to Congress on national income back in the 1930s, warned against interpreting GDP as indicative of the welfare of the nation’s families. He wrote that “The welfare of a nation can, therefore, scarcely be inferred from a measurement of national income.” Robert Kennedy was more explicit when he said that GDP “measures everything… except that which makes life worthwhile.”
Rising inequality means less informative aggregate statistics
Over the past four decades, the U.S. economy has undergone a significant transition. Prior to the 1980s, economic growth was equitably shared between most Americans. But we are now in a new economy, where it is growing slower than in the past and where most growth benefits only those at the very top of the economic ladder. Incomes for the working class and the middle-class have grown slowly for decades while incomes at the very top have exploded.
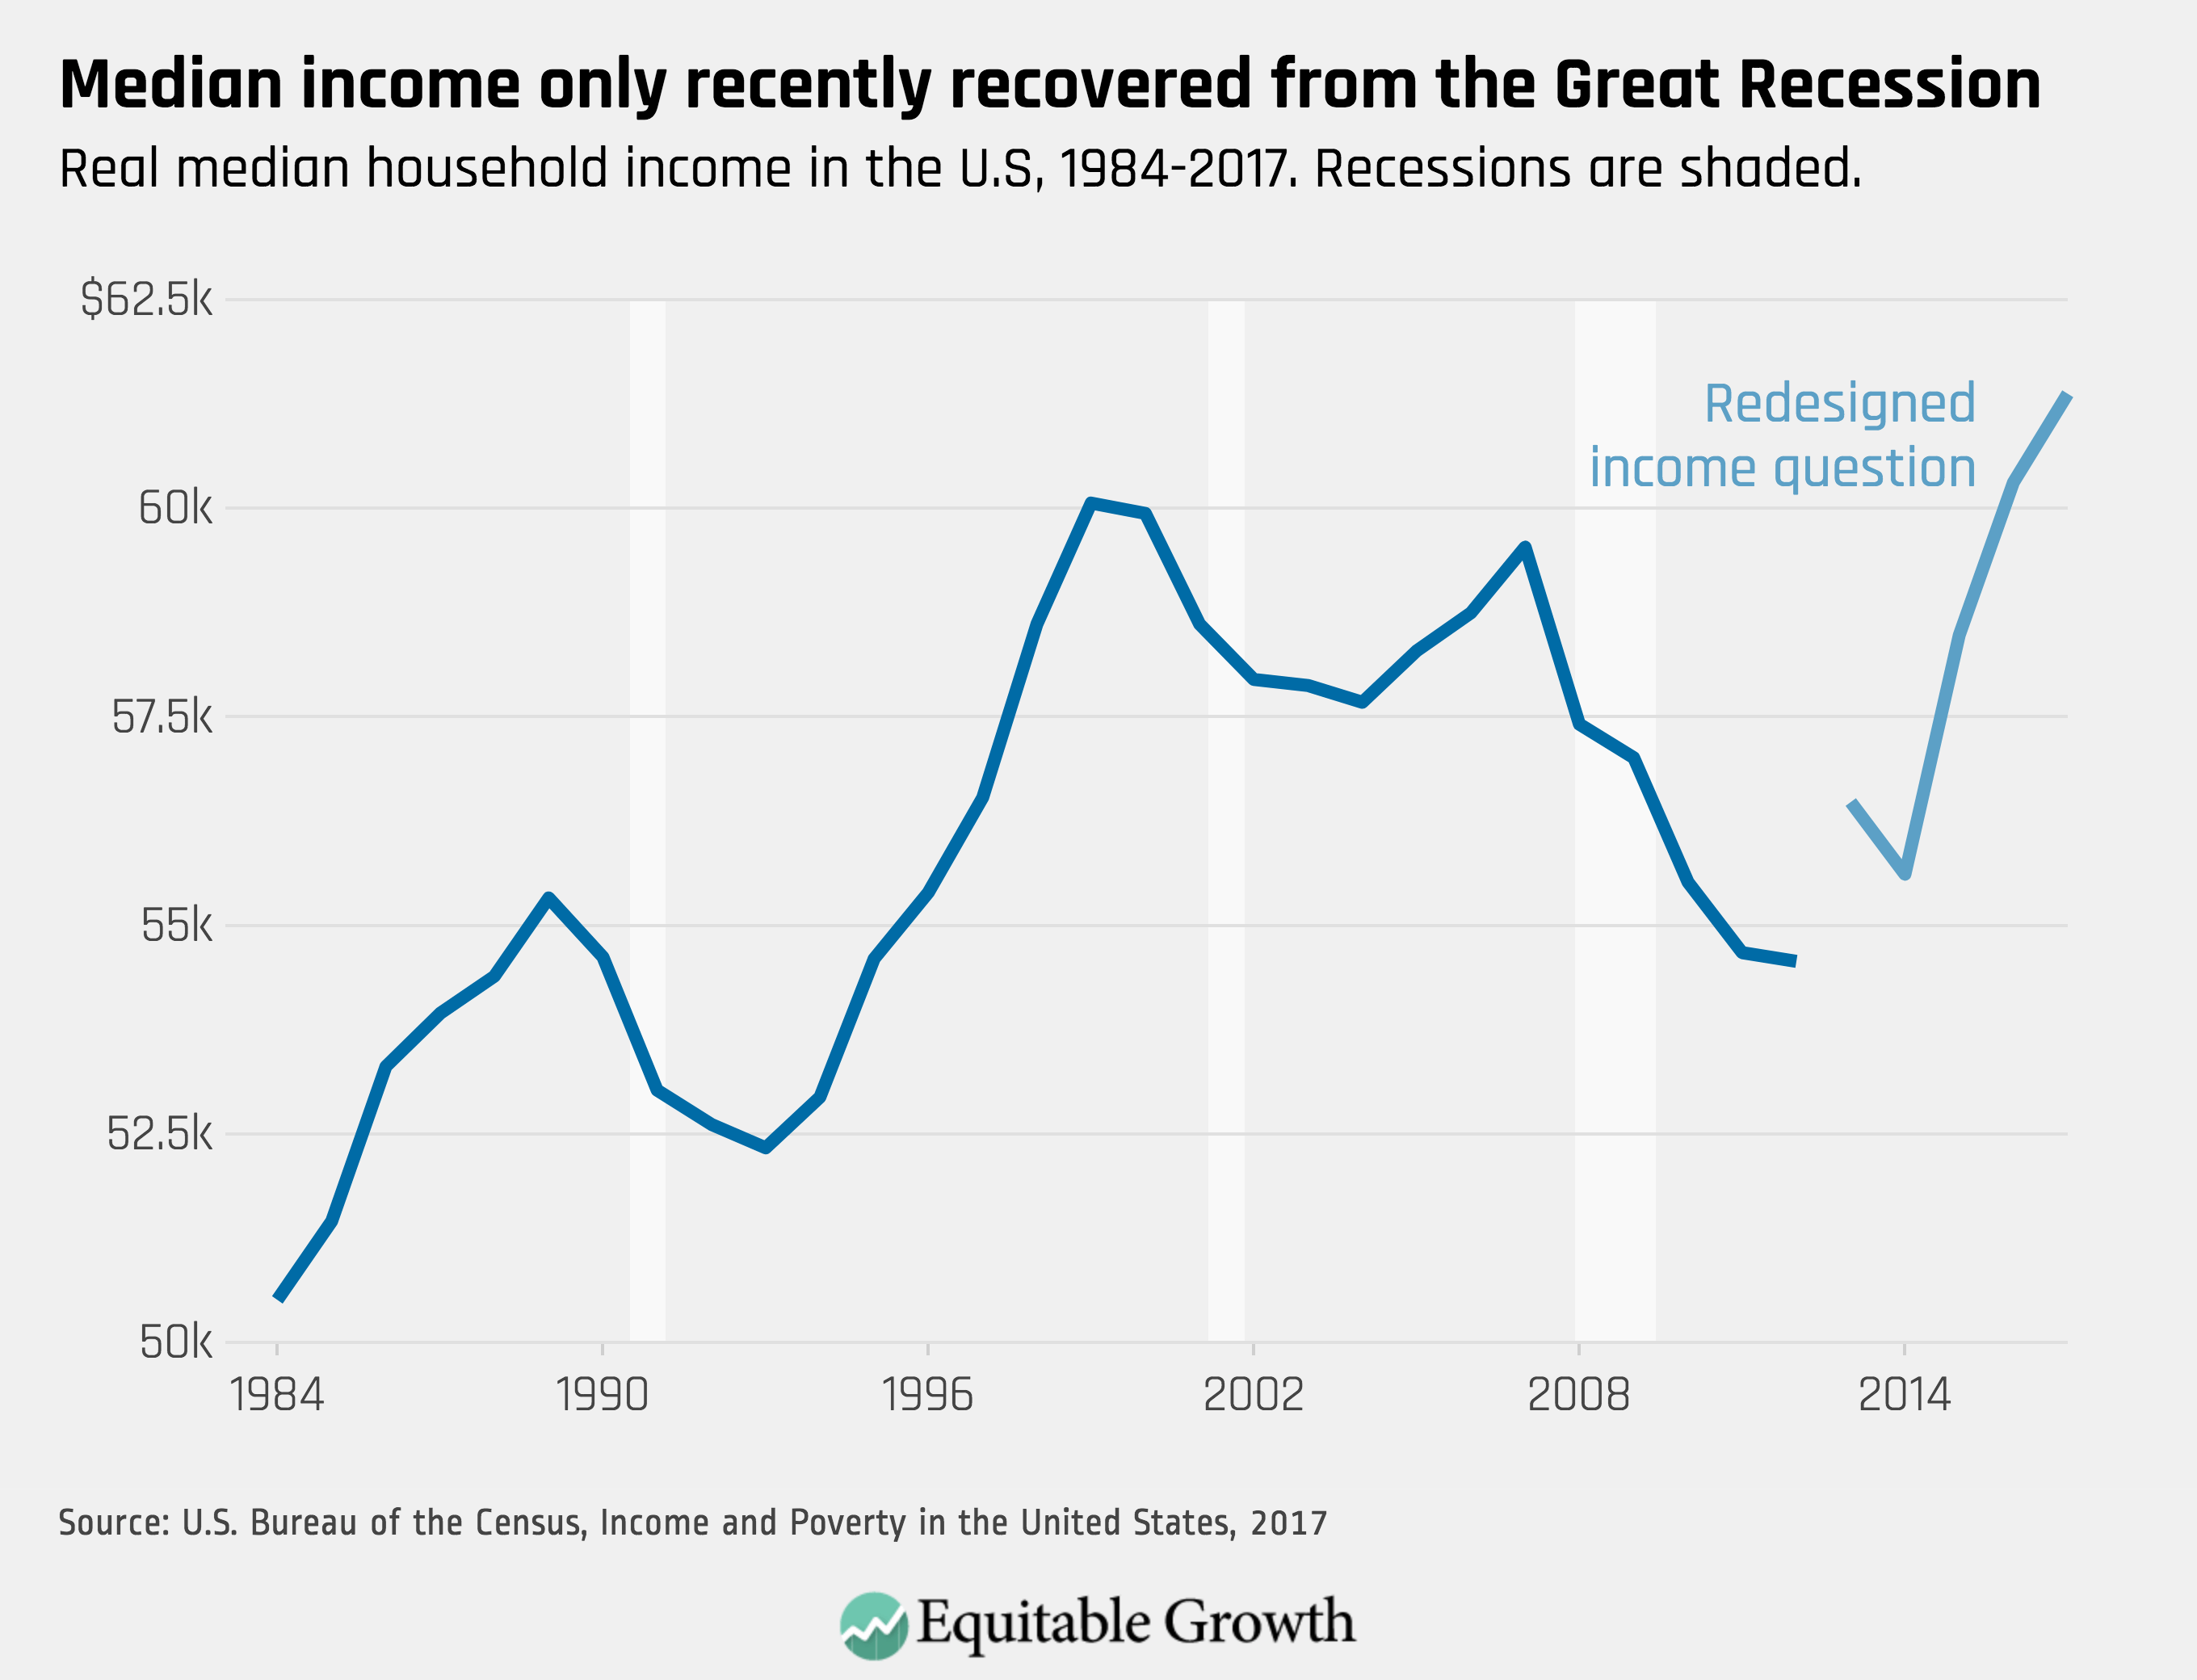
There is now ample evidence for this seismic shift in the fundamentals of the economy. Just two weeks ago a new U.S. Census Bureau report on Income and Poverty in the United States showed that median income for all households has only just now recovered from the Great Recession. Before the Great Recession, income had only just recovered from the collapse of the dotcom bubble. As a result, there has been no rise in median incomes since around the turn of the century 2 (although the recent Census report shows higher median income, it is based on a revised survey question that led to higher reported incomes and the report states that this new estimate is not statistically different from incomes in 2007 and 1999). (See Figure 2.)
Figure 2
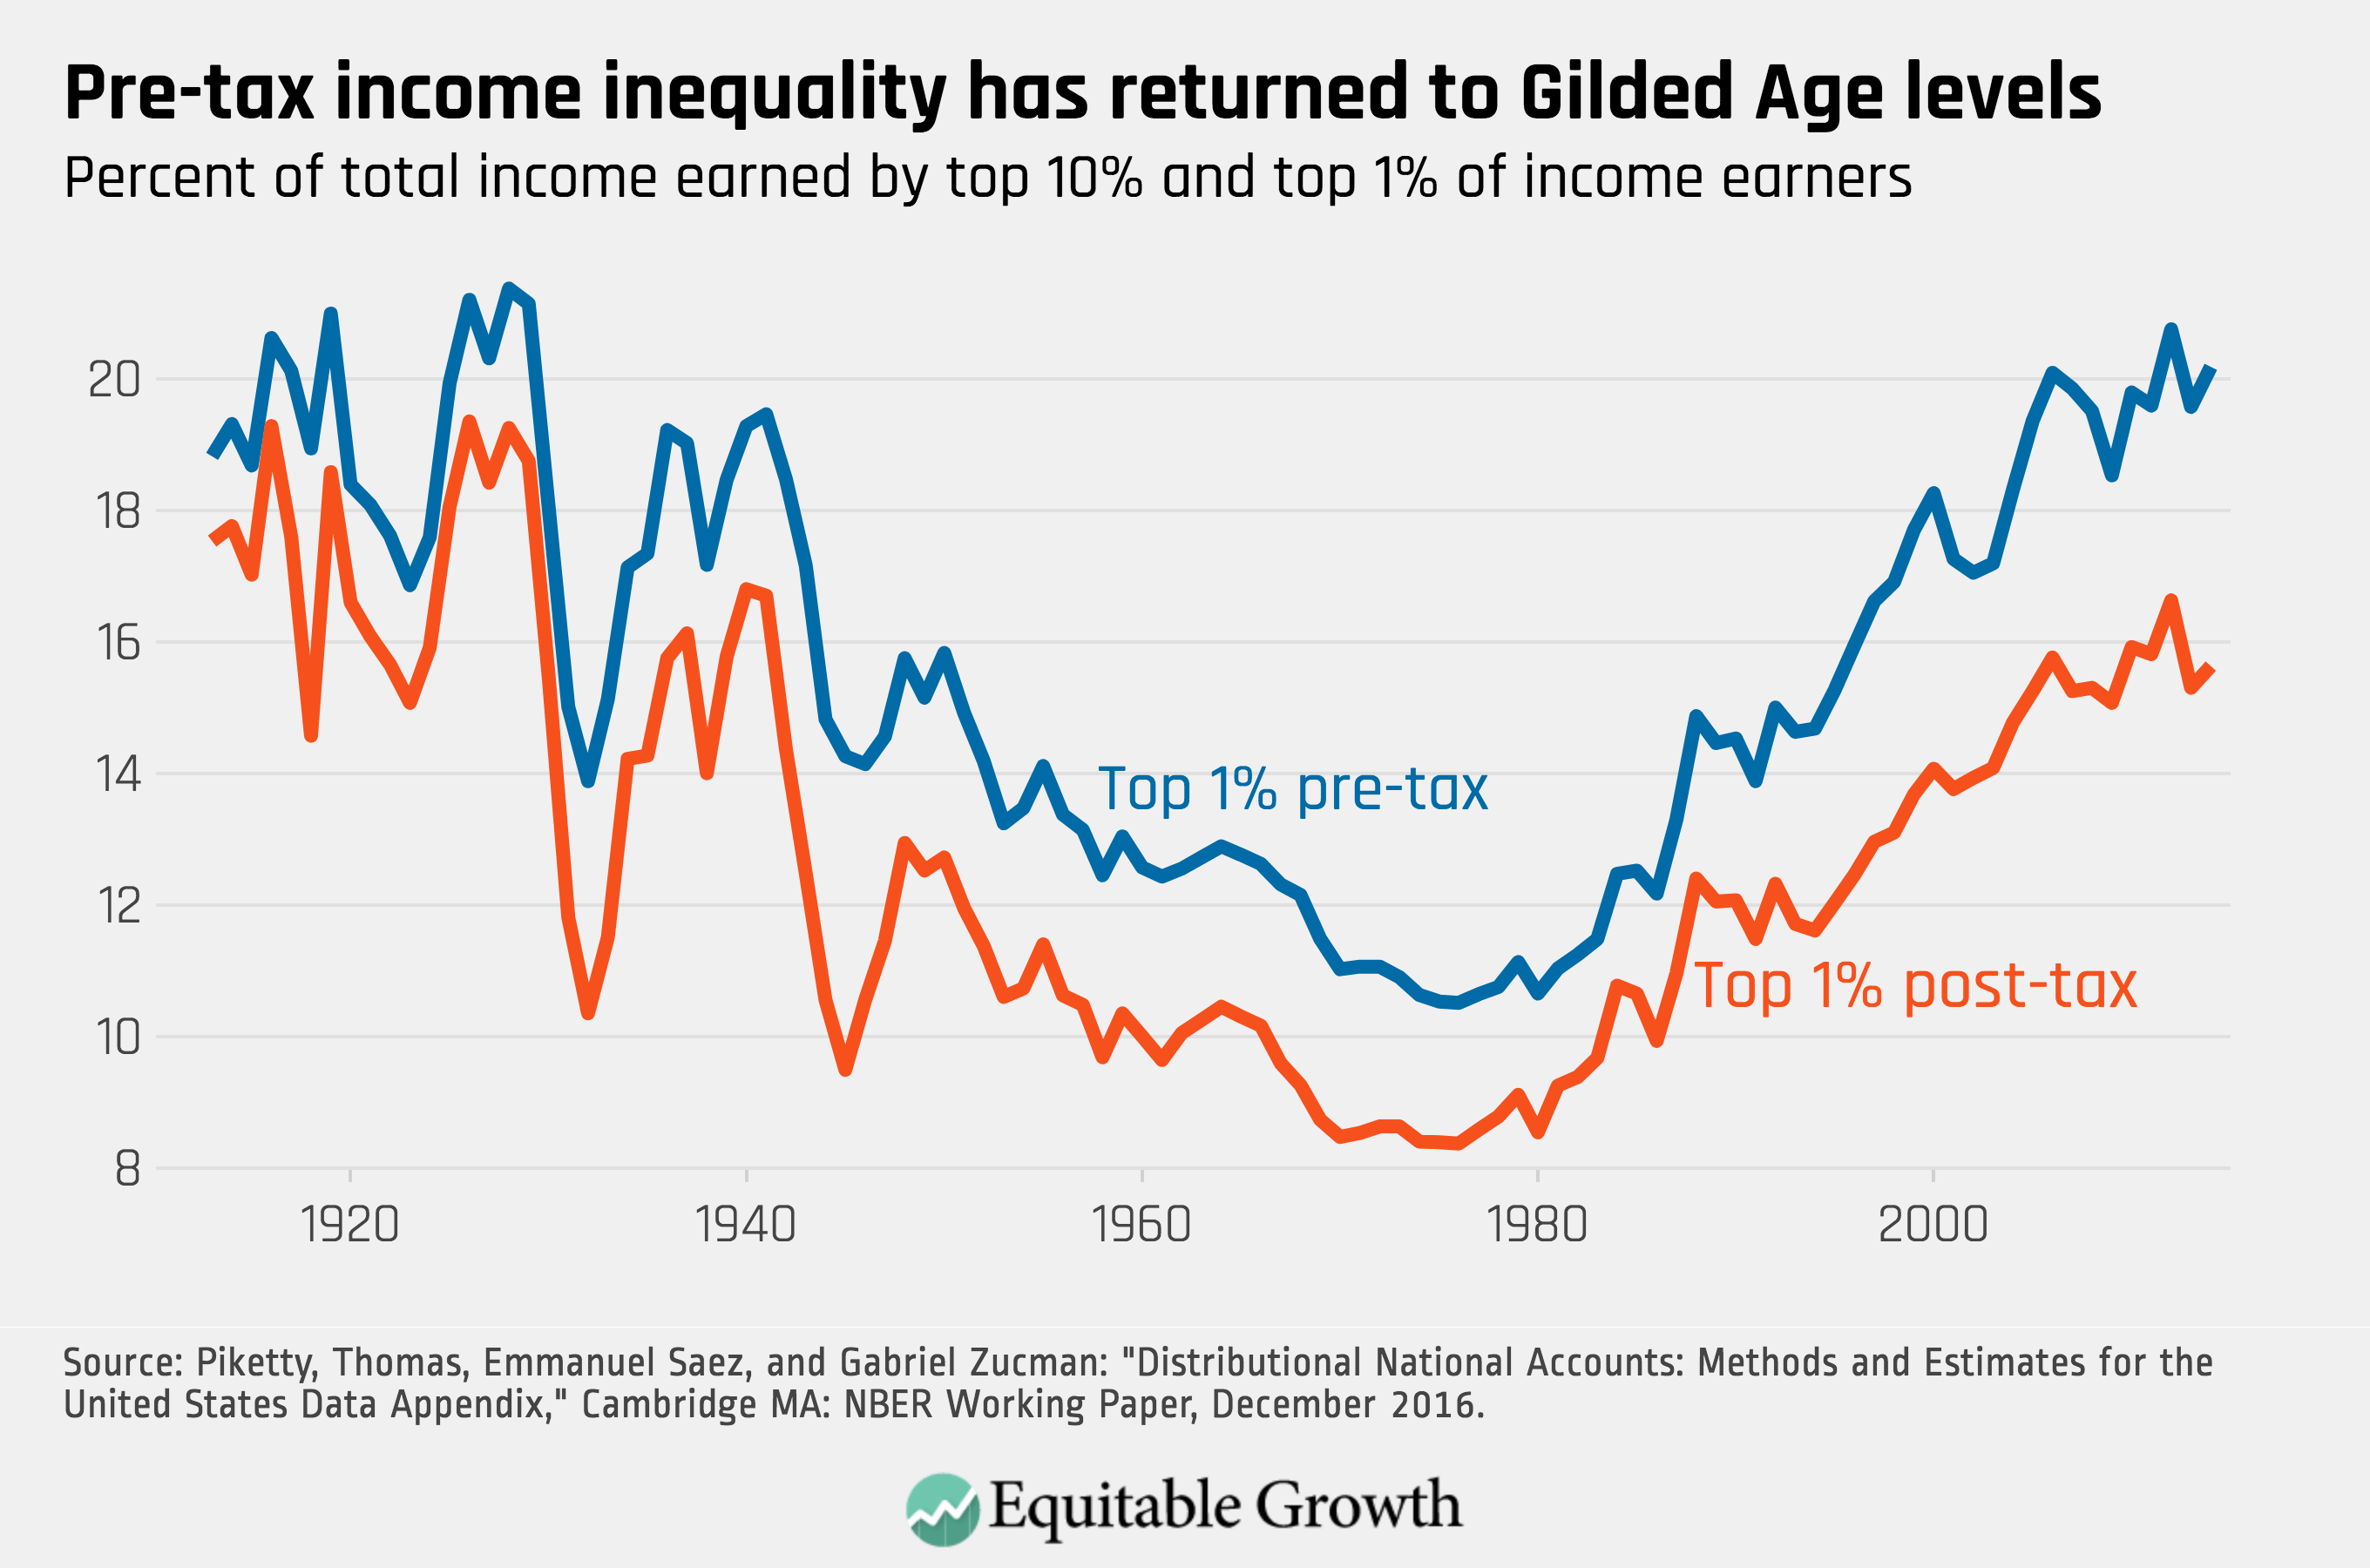
Distributional national accounts tell the same story. The economists Piketty, Saez, and Zucman find that between 1980 and 2014 the bottom half of Americans by income saw average annual income growth of just 0.6 percent. The richest ten percent of Americans, by contrast, enjoyed annual income growth of 2.2 percent, adding up to a total after-tax increase of 113 percent over the 35-year period. But even they were left behind by the top one percent, who saw their income triple over the same period.
The result is that the pre-tax distribution of income has returned to the Gilded Age levels of the 1920s. The story is not quite so dramatic after government taxes and transfers, but by either measure the share of total national income held by the top 1 percent has nearly doubled since hitting lows in the 1970s. (See Figure 3.)
Figure 3
We see these same divergent trends across multiple measures of economic wellbeing: wages, income, and wealth. The implication for how we evaluate the economy is that mean economic progress is pulling away from median economic progress. Almost all of our national economic statistics are becoming less representative of the experience of most Americans. Reforming our national statistical infrastructure to account for this reality is long overdue.
Tracking growth all along the income curve will inform policy
Distributional national accounts would be an important tool for crafting policy today in our unequal economy. Economic inequality has a number of detrimental effects on society that researchers are still working to understand. Inequality has been linked, for example, to both high crime and poor health outcomes. I am going to focus on two important ways in which inequality may hinder the economy and in which distributional national accounts could therefore improve our stewardship of the economy. First, it has now been conclusively shown that unequal patterns of growth are reducing economic mobility in America. Second, evidence suggests that the economy depends critically on the fortunes of lower-income consumers who have higher propensities to consume.
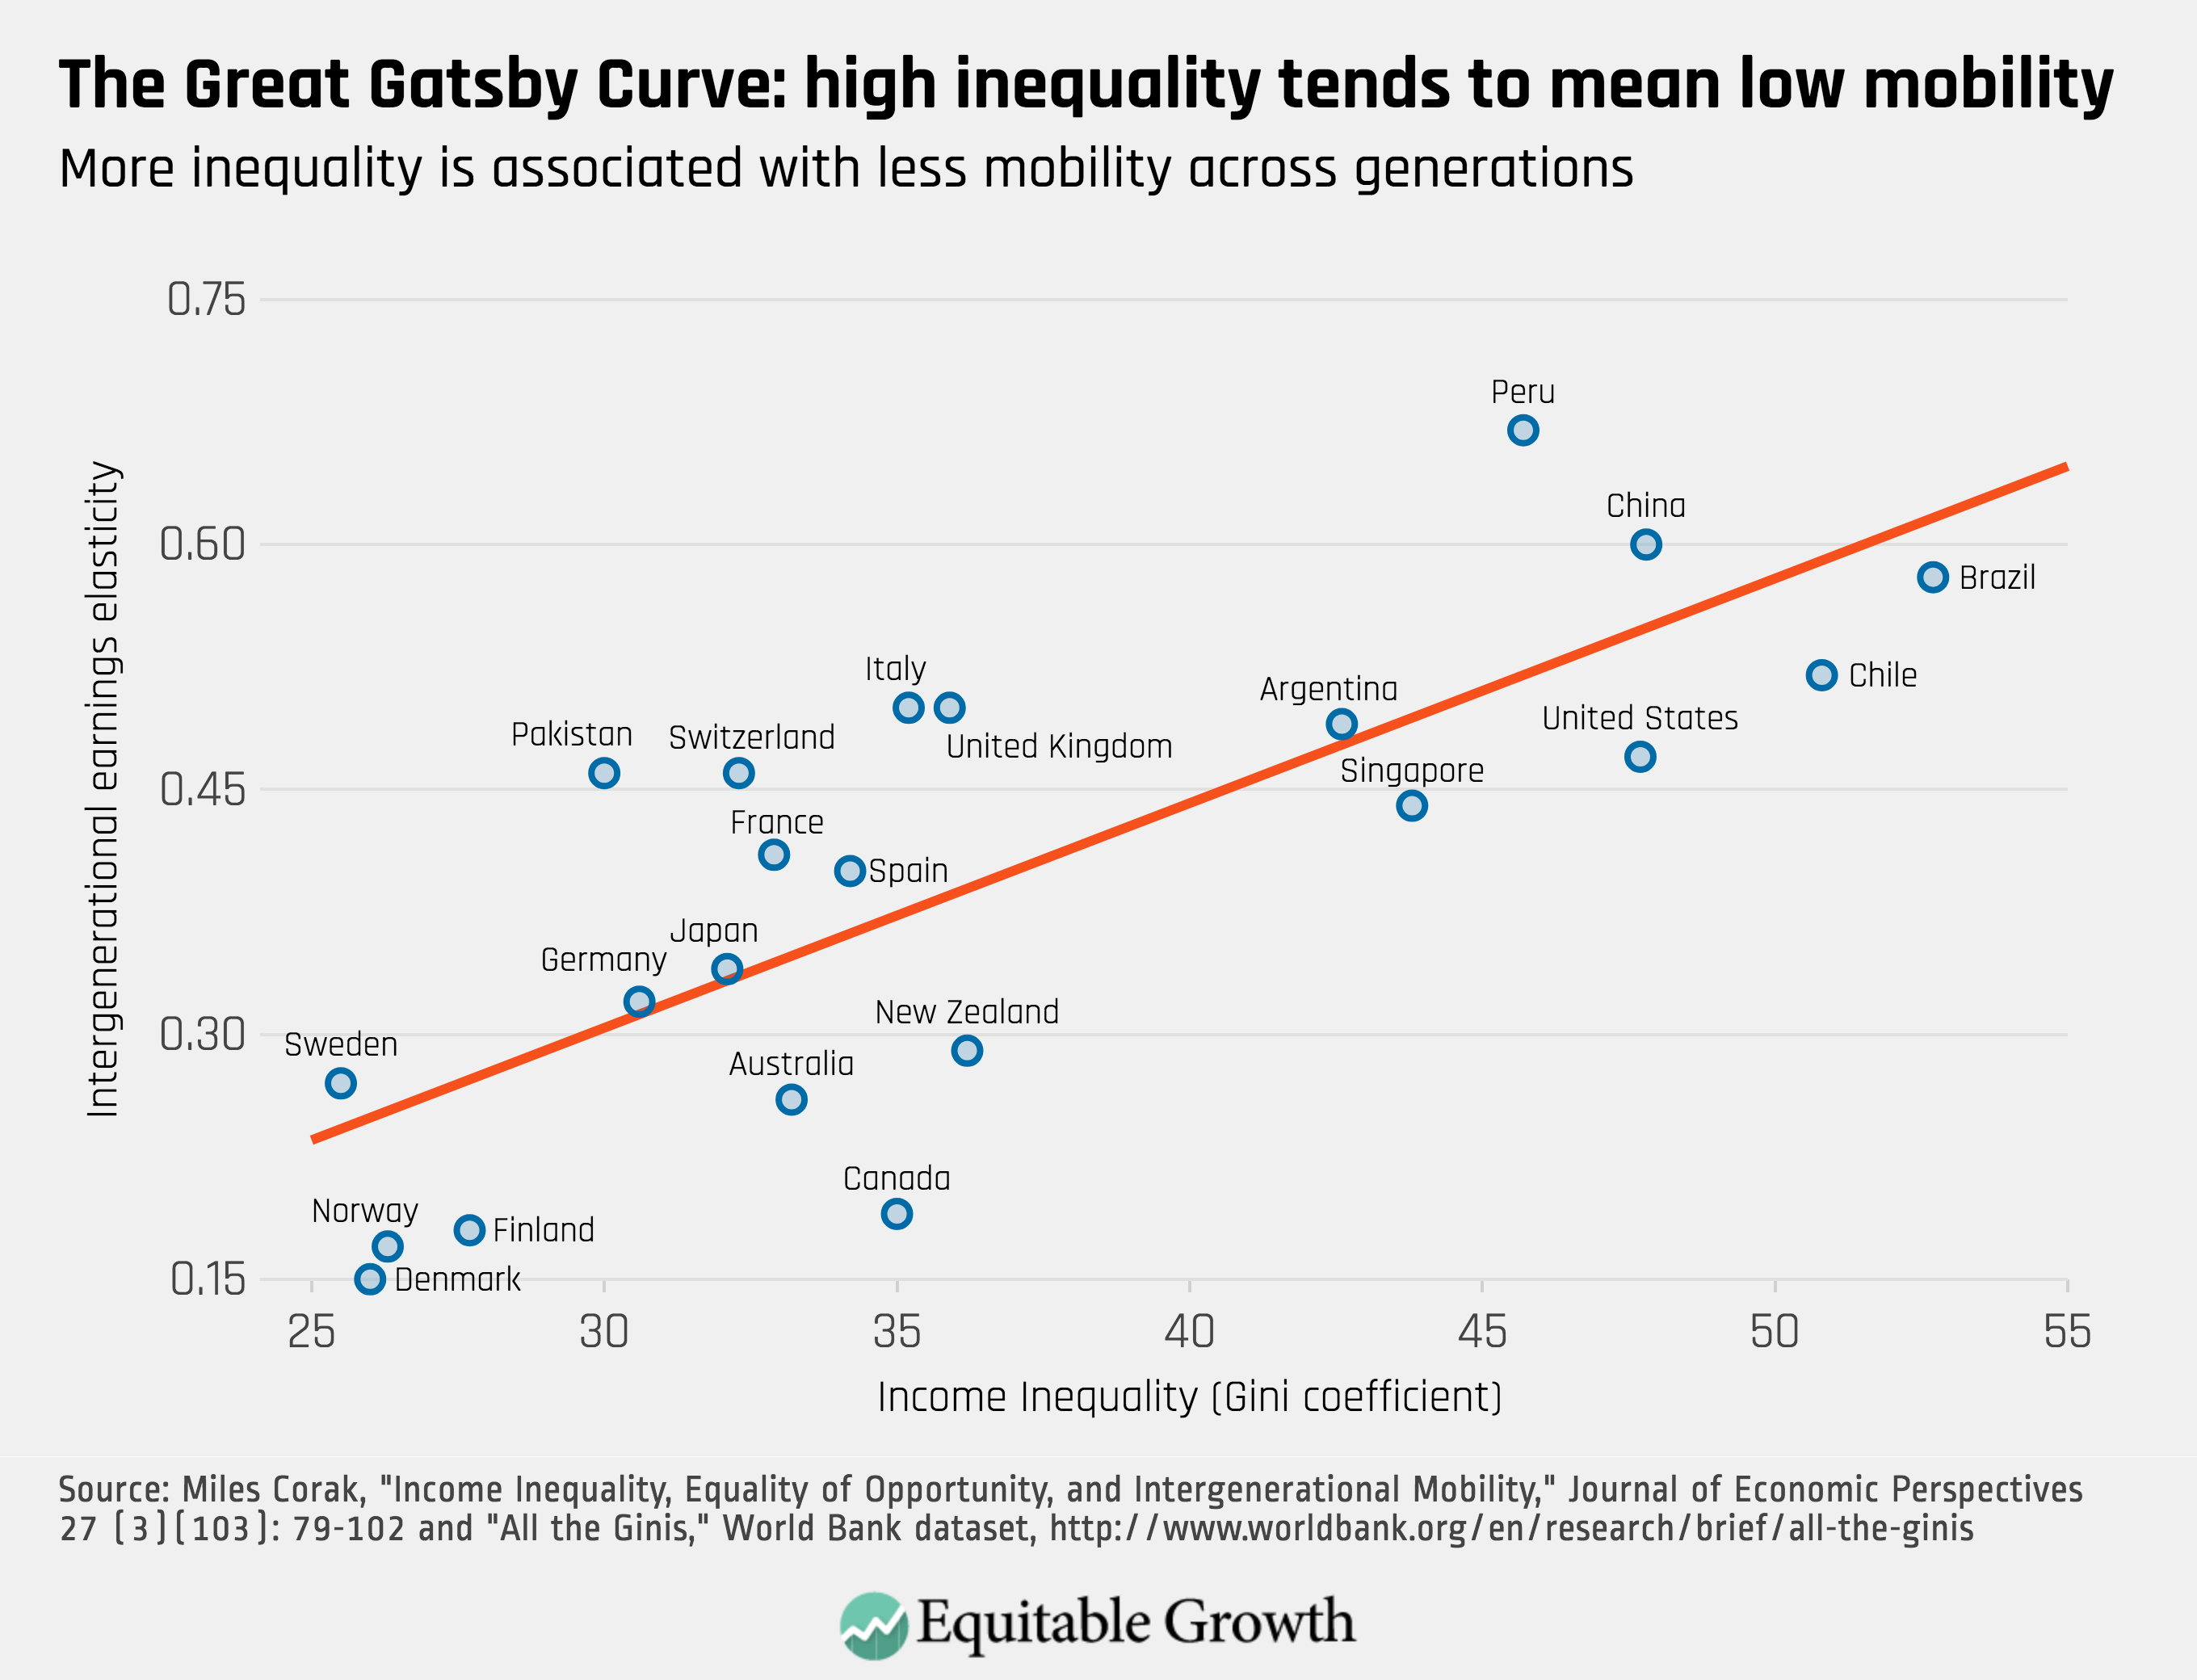
It is intuitively unsurprising that societies with higher inequality are also societies with low economic mobility. Economist Miles Corak created what former CEA chair Alan Krueger has called “The Great Gatsby Curve,” which plots the relationship between inequality and intergenerational mobility across countries. Countries with higher inequality tend to have lower economic mobility. Figure 4 shows one version of this curve.
Figure 4
While critics often suggest that the relationship is not causal, more recent research shows that increasing inequality in the United States has significantly reduced absolute intergenerational mobility. Economist Raj Chetty has shown that children born in 1940, just before the baby boom, when inequality was low and growth was high had a 90 percent chance of earning more than their parents. Generation Xers born in 1980, when income inequality was high and growth was low, however, have just a 50 percent chance of surpassing their parents’ income.3
More importantly, the evidence shows that even if children born in 1980 had experienced the same higher growth experienced by children born in 1940, this would have closed only about one-third of the mobility gap. But if children born in 1980 had instead faced the same levels of inequality as children in 1940 (even with the lower growth), this would have closed two-thirds of the mobility gap. Figure 5 illustrates rates of absolute mobility by parent income percentile and shows these counterfactuals.
Figure 5
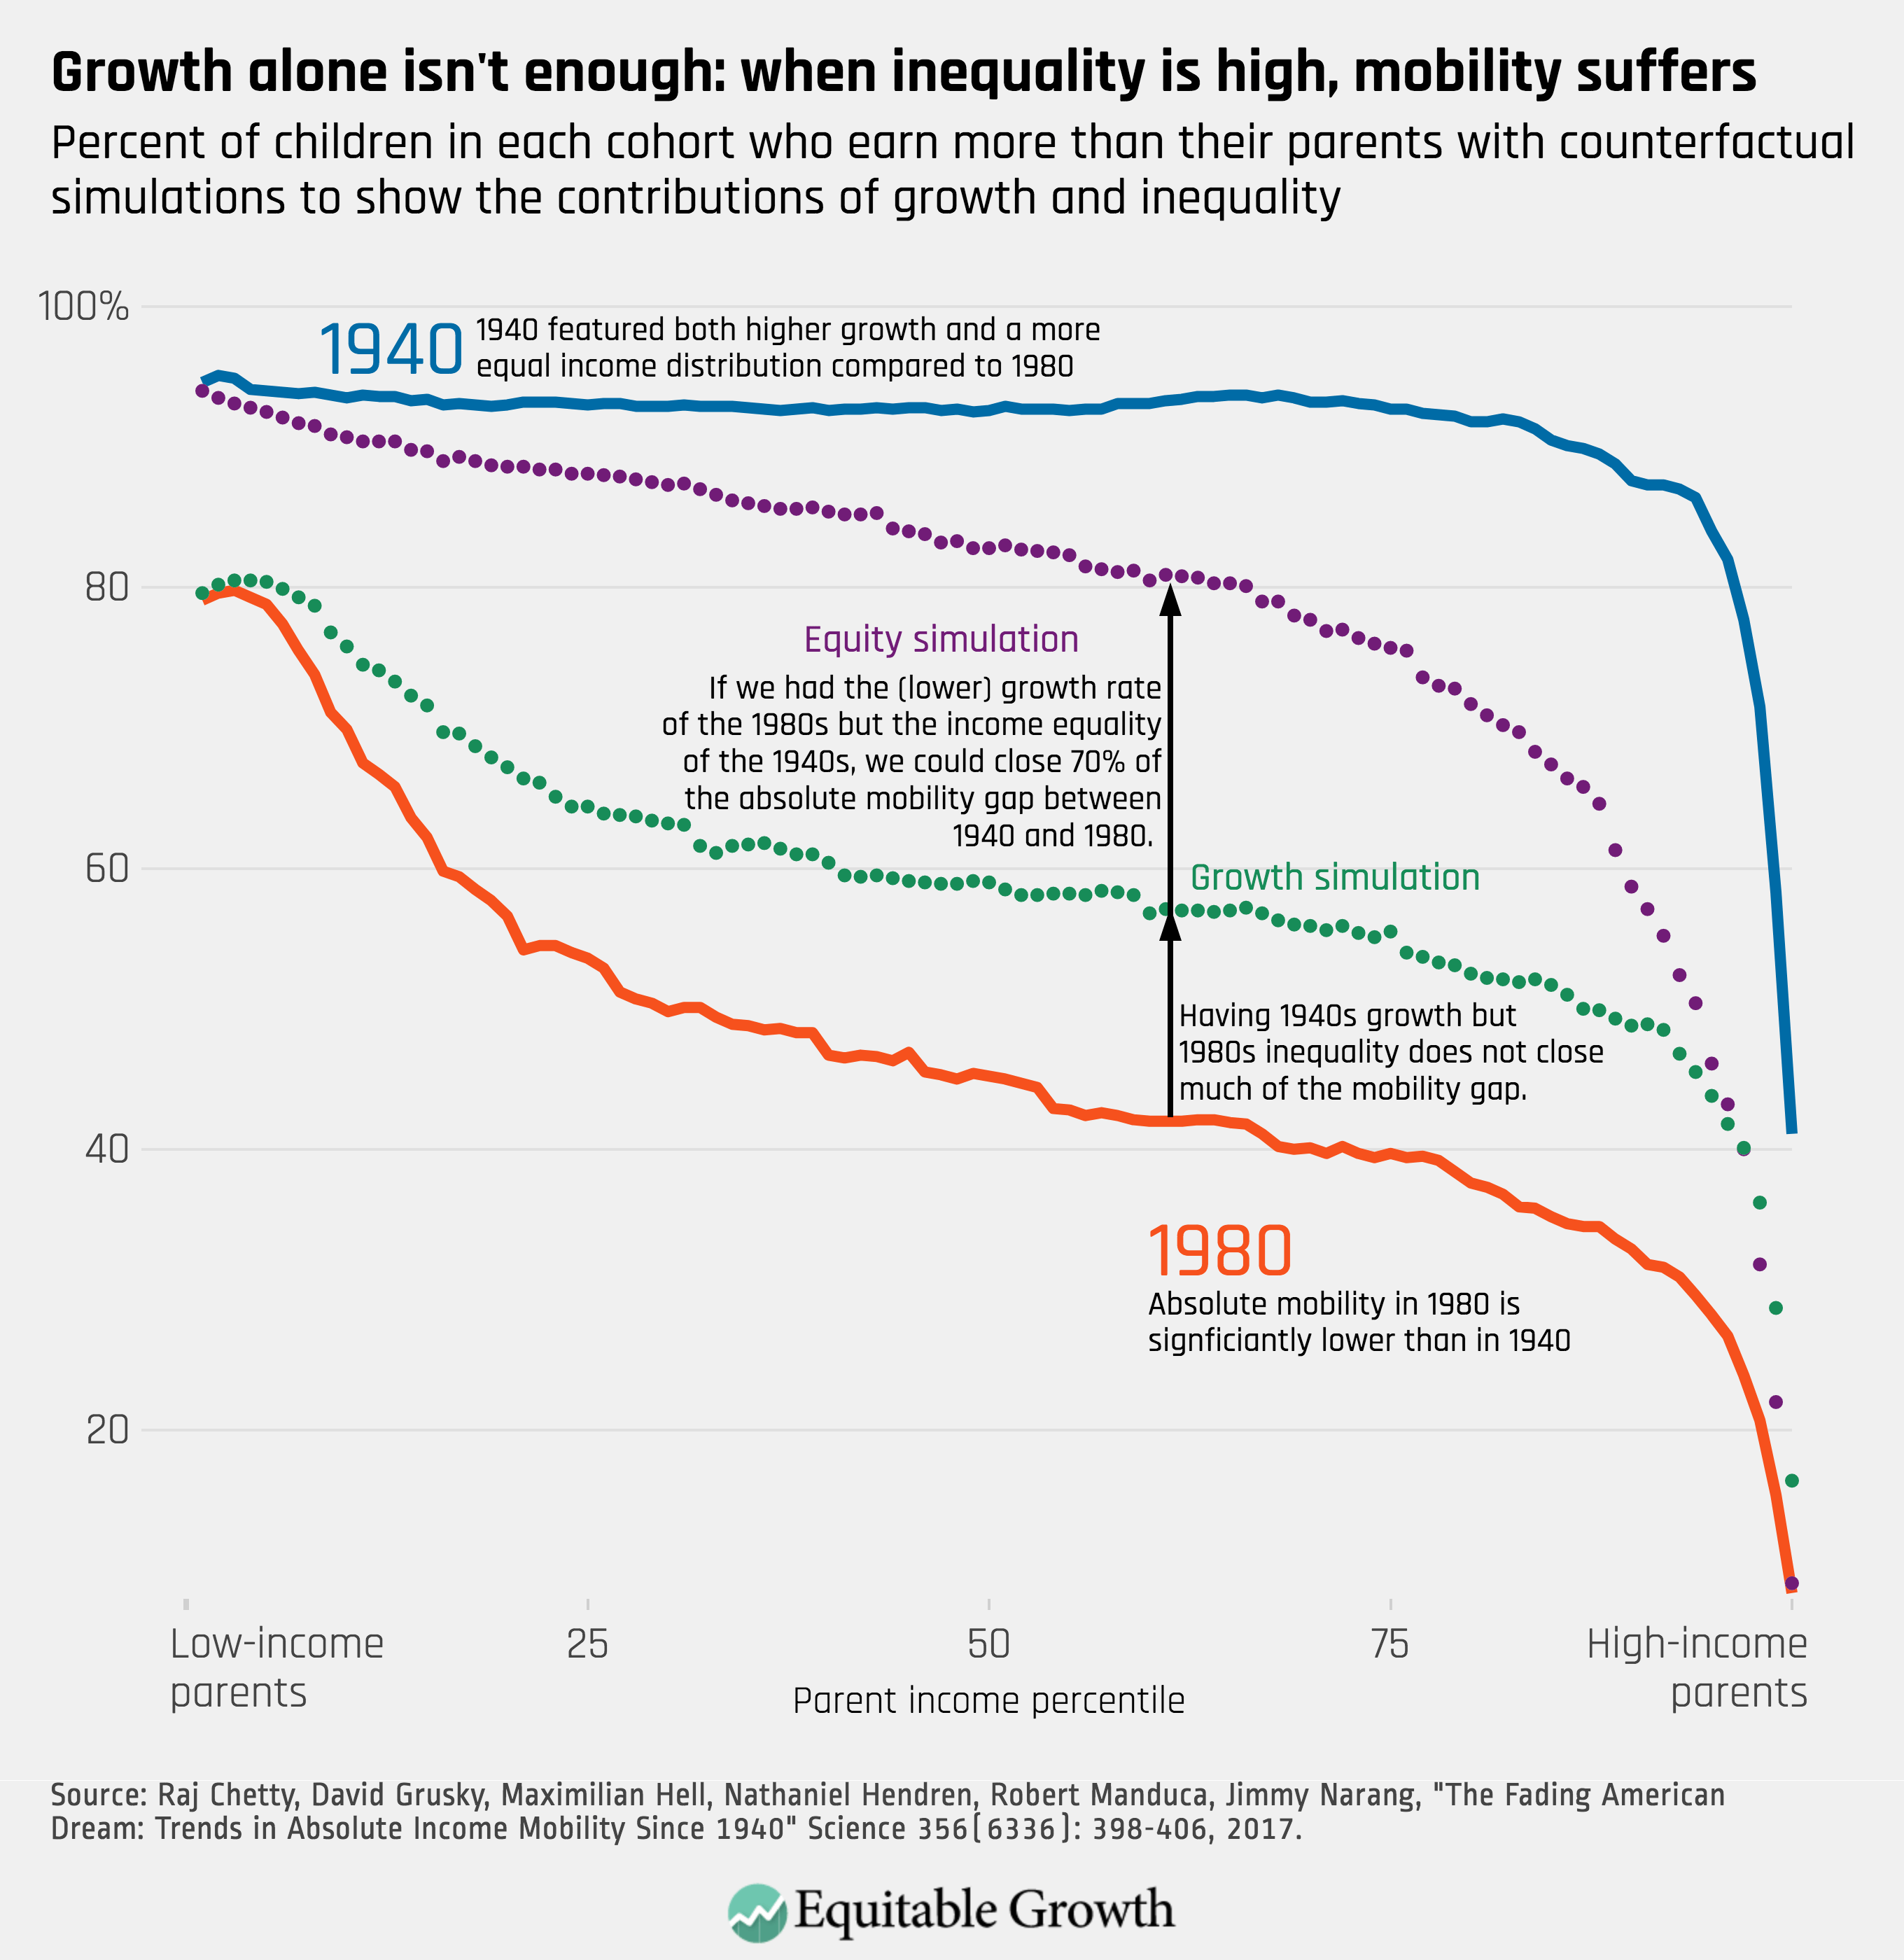
The implication is clear: growth alone is not enough to produce strong absolute mobility. Distributional national accounts would allow us to track how growth is distributed annually and manage the economy accordingly to increase economic mobility. Notably, to diagnose this problem it is not enough to know that median household income is stagnant. Understanding how mobility might be changing requires a complete picture of how growth is accruing to families all along the income curve, including at the very top.
Distributed national accounts would also give us important insights into the future performance of the economy. One of the lessons of the Great Recession, as economists Atif Mian and Amir Sufi document in their book “House of Debt,” was that robust consumption in the 2000s was being financed in large part by borrowing. Homeowners who had relied on withdrawing equity from their mortgages suddenly found themselves deeply indebted when housing prices began to collapse. The result was a collapse in consumption as these low- and middle-income households, sensitive to changes in their income, reined in spending.
In their most basic form, distributional national accounts could help us spot phenomena like this by alerting us when incomes are declining in households at the bottom of the income distribution with a high marginal propensity to consume. But we could potentially do much better by disaggregating some of the components of national output measures to also report savings rates by income quantile. These kinds of statistics are more difficult to develop and may require us to improve some of our existing economic surveys. But they promise an important advance over current statistics. Because of the rapid rise of inequality, it is hard to say when we look at the national savings rate whether savings will be a hedge against recession because we don’t know if all households have strong savings or if these savings are concentrated at the top of the income distribution. It is entirely possible that aggregate household savings measured in the aggregate is good yet obscures weaknesses in the balance sheets of many households—weaknesses that suggest stormy economic weather ahead.
Recent policy changes may be exacerbating the problem
We have little information today about the current state of inequality in our nation. Some commentators believe that inequality may have peaked, but we have little data to support such a pronouncement. The best government-produced report on inequality, CBO’s “Distribution of Household Income” report, is published on a four-year lag, with the most recent estimates covering 2014. Since then, a number of important policy changes have been made that could increase inequality across the United States. Because there is no standard report of how growth is distributed, we may not know how these policies affect families for several years.
Most notably, the Tax Policy Center estimates that the Tax Cuts and Jobs Act of 2017 will have a sharply regressive effect, with high-income families enjoying larger income gains in both the short- and long-term than low- and middle-income families. Because of sunsets on most personal tax provisions in the act, only families in the top quintile see gains after ten years while those in the lowest two quintiles will actually see declines in their income. 4 (See Figure 6.)
Figure 6
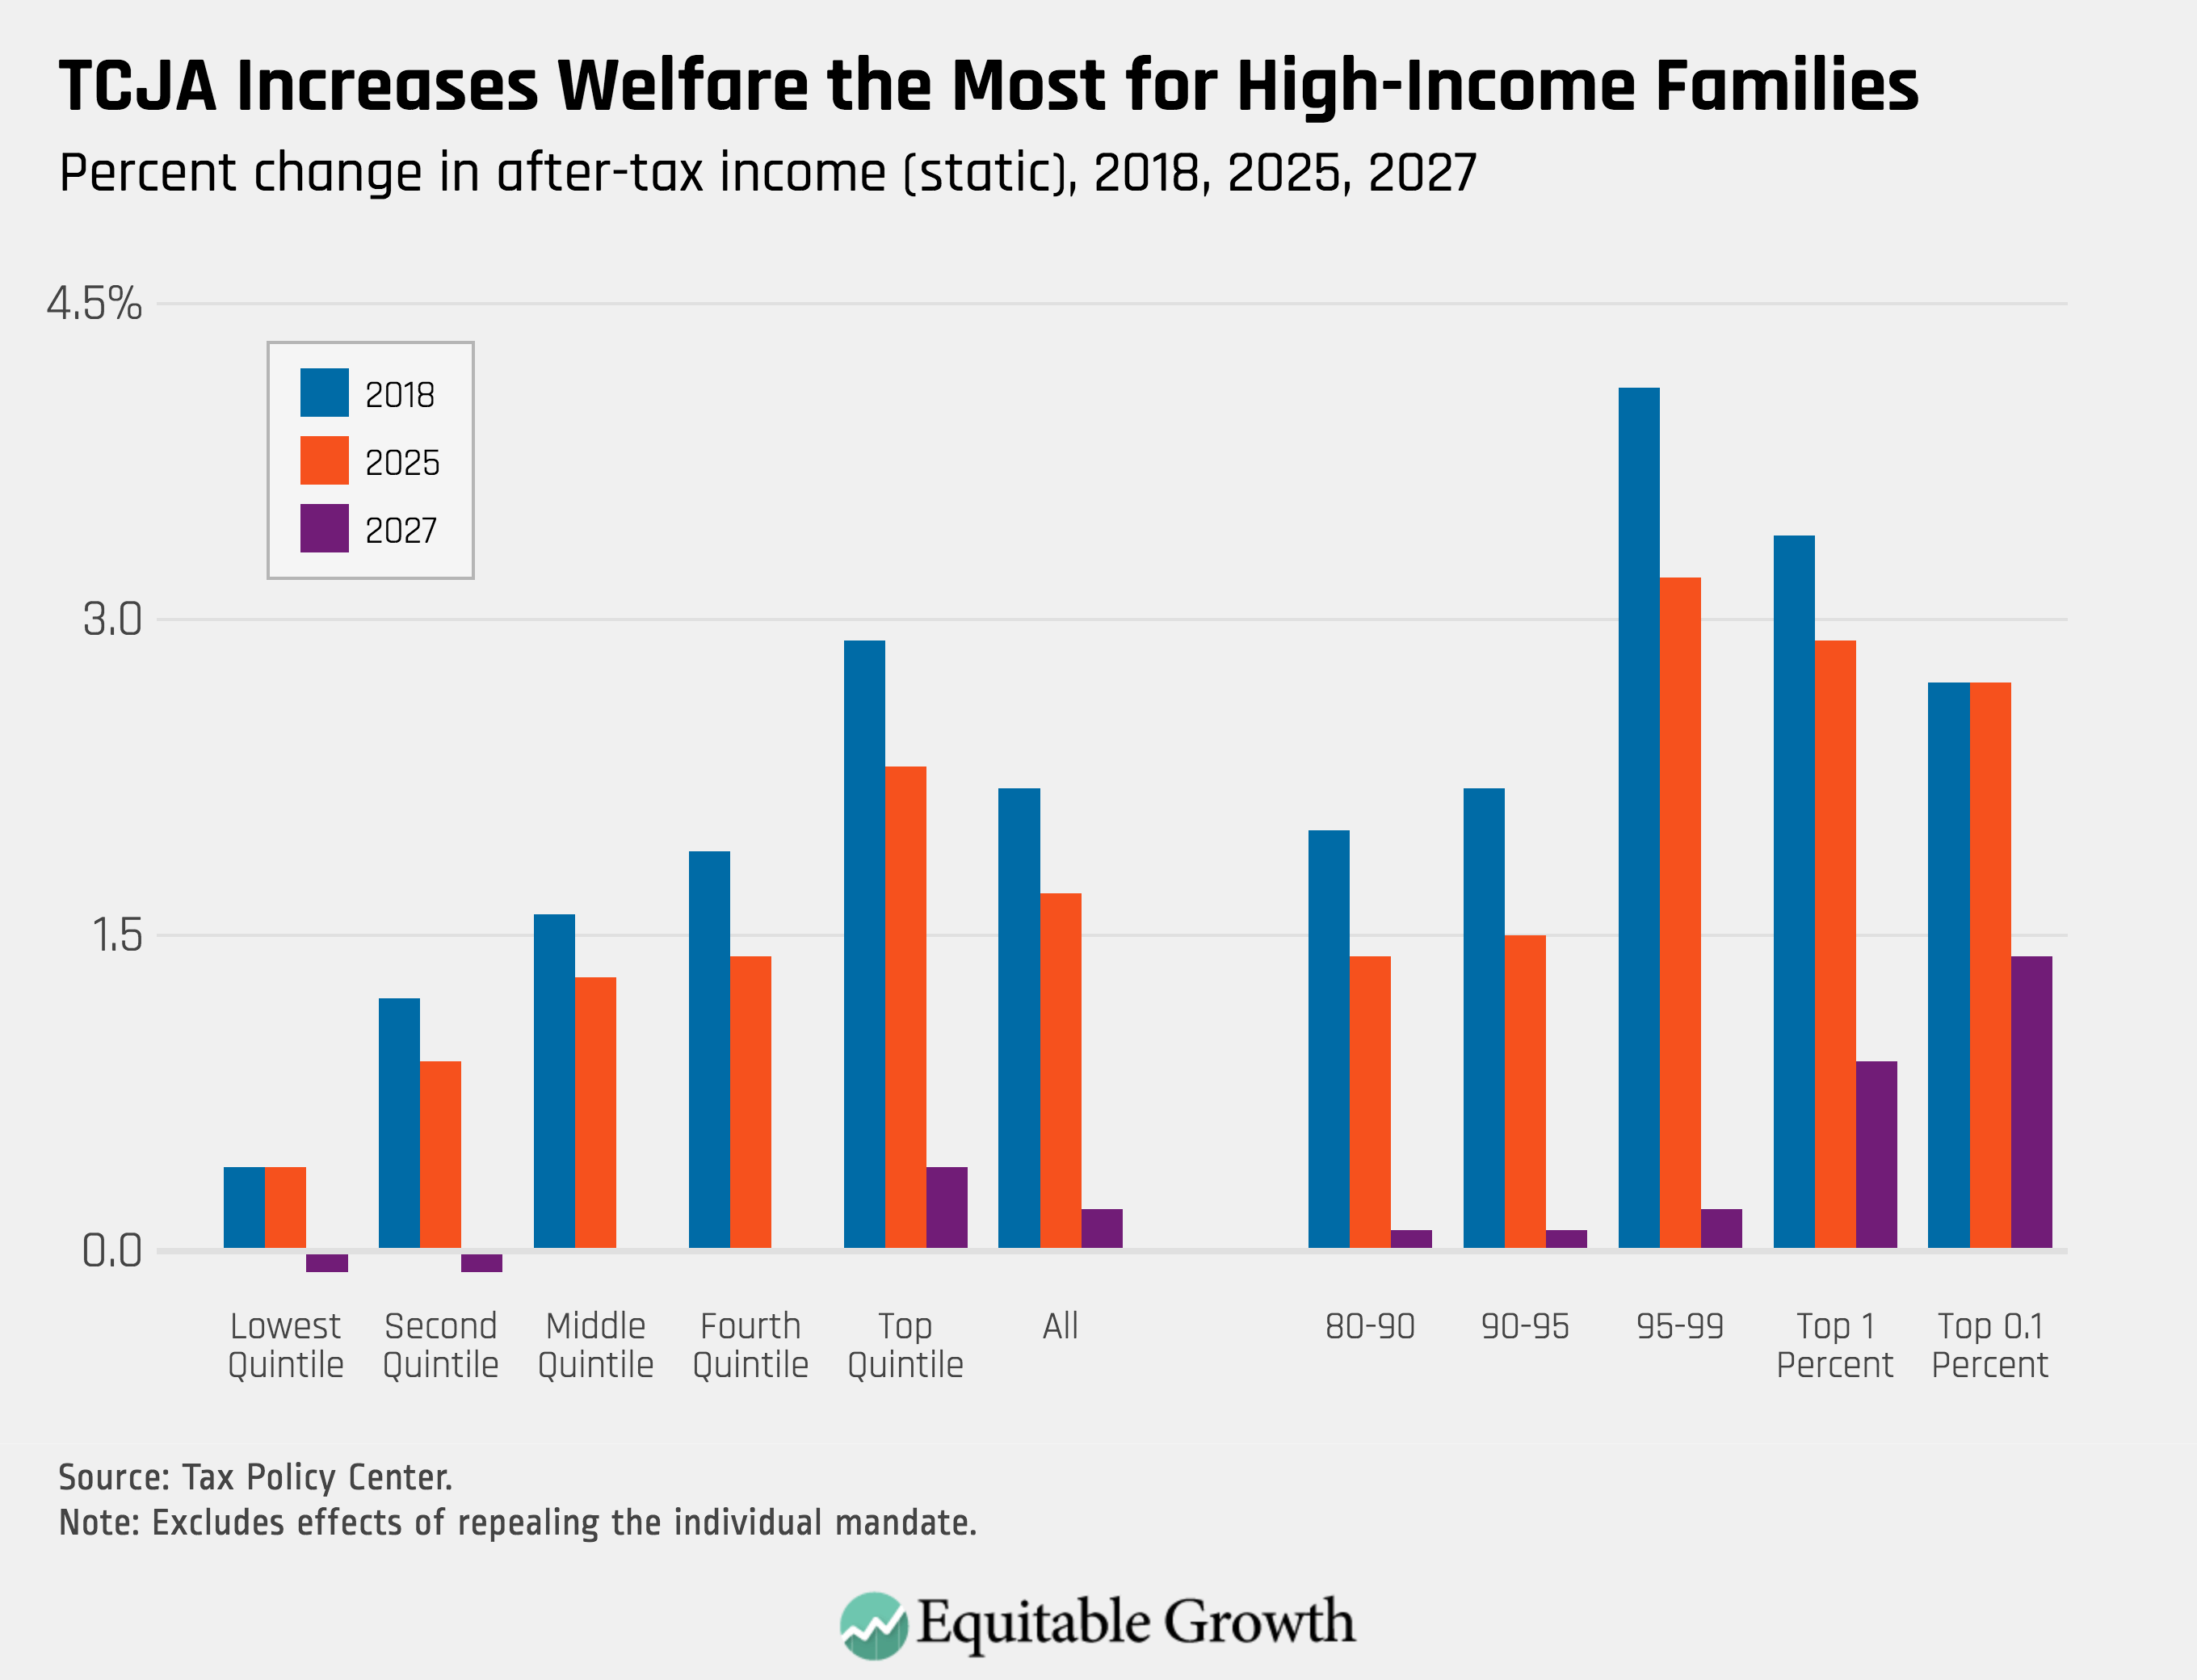
The purpose of the tax system, as with public policy in general, is to support the living standards of American families. Core to this purpose is raising the revenues necessary to finance the investments in children and families, the social insurance programs, and the many other basic governmental functions that support our quality of life. The Tax Cuts and Jobs Act cut taxes for those at the top in the long run, while leaving us with decreased revenue to fund the things that matter for the well-being of the typical American family.
These are regressive policy changes that are likely to increase inequality in the United States, but we will not know how they affect incomes for years and currently have no way of knowing how they will affect the distribution of economic growth in the years to come as these changes take effect. Smart stewardship of our economy in an era of high inequality requires us to start to disaggregate our topline statistics and report on economic prosperity for all Americans. Distributional national accounts are a critically important step in that direction.
End Notes
1. Thomas Piketty, Emmanuel Saez, and Gabriel Zucman, “Distributional National Accounts: Methods and Estimates for the United States.” Quarterly Journal of Economics, 2018, 133.
2. Kayla Fontenot, Jessica Semega, and Melissa Kollar, “Income and Poverty in the United States: 2017.” (Department of Commerce, 2018).
3. Raj Chetty, David Grusky, Maximilian Hell, Nathaniel Hendren, Robert Manduca, Jimmy Narang, “The Fading American Dream: Trends in Absolute Income Mobility Since 1940.” Science 2017, 356.
4. Tax Policy Center, “Distributional Analysis of the Conference Agreement for the Tax Cuts and Jobs Act,” Available online at https://www.taxpolicycenter.org/publications/distributional-analysis-conference-agreement-tax-cuts-and-jobs-act/full