Six charts that explain how inequality in the United States changed over the past 20 years

The U.S. Bureau of Economic Analysis, in late 2021, updated its data series on income inequality in the United States. This update adds data for 2019 and extends the data back to 2000, making this a very useful series for understanding how economic inequality evolved over the past two decades.
Below, we’ve assembled six charts that show how high-, middle-, and low-income households experienced inequality over the first two decades of the 21st century.
Inequality is rising
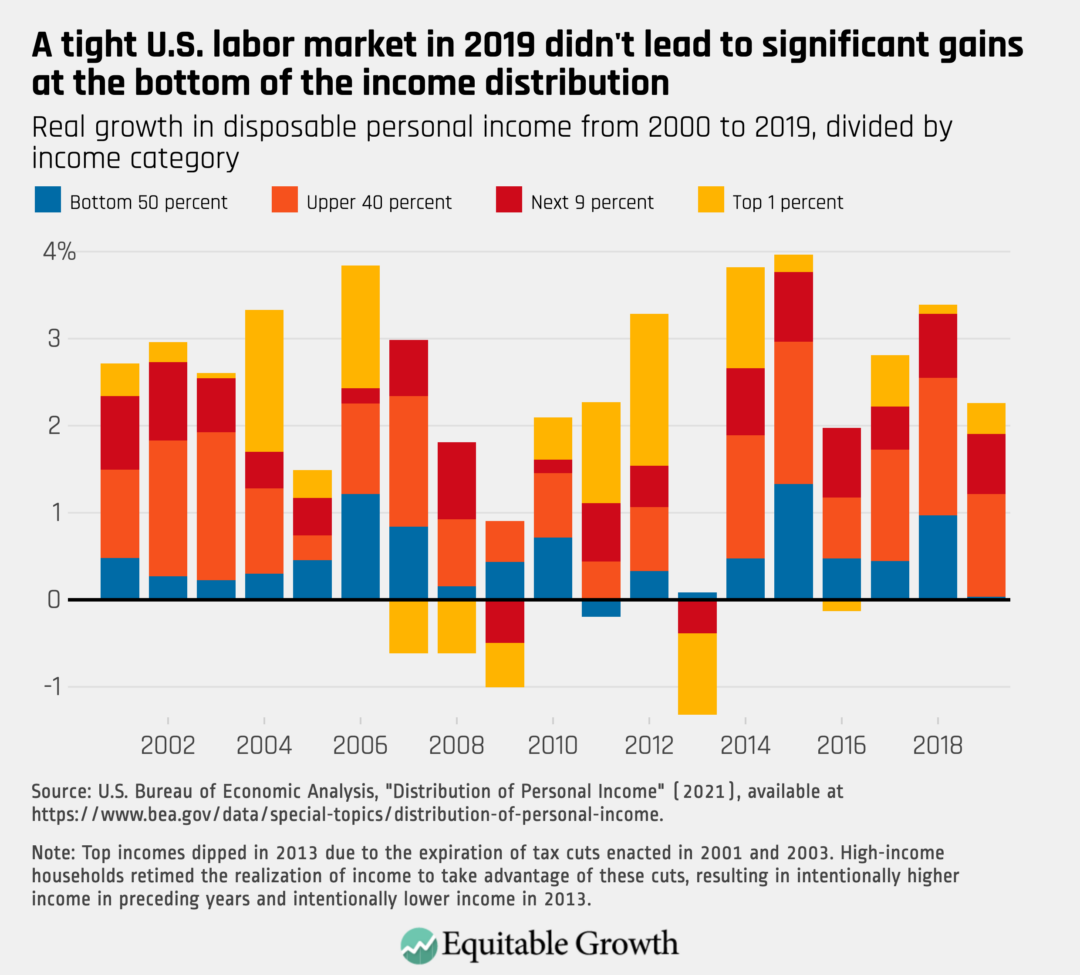
The new data show that economic inequality continues to rise. Our first chart shows growth in disposable personal income in each year between 2001 and 2019. Each bar is subdivided to show where growth went. The blue sections indicate growth that went to households in the bottom half of the U.S. income distribution. That is, blue bars represent all households in the country that earn less than the median household income. The warmer colors—yellow, red, and orange—represent groups with higher incomes. Notably, significant percentages of growth in every year flow to the top 10 percent of households, which are represented on the graph by the yellow and red sections of each bar. (See Figure 1.)
Figure 1
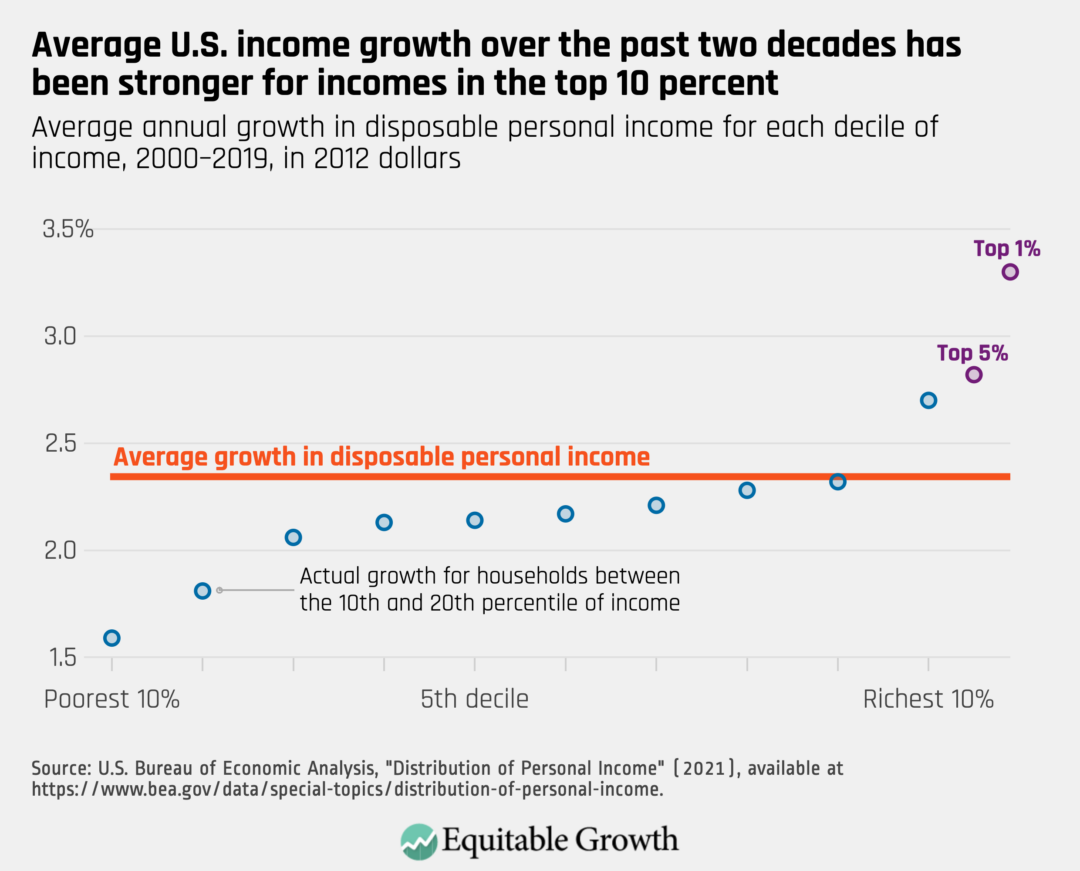
One easy way to see that inequality is increasing is to compare average personal income growth—which is the number most commonly reported by the media—to growth for particular groups of U.S. households. Our second chart breaks the population into deciles of income, with the lowest-income households on the left side of the graph, showing that for the vast majority of Americans, “headline” growth in disposable personal income overstates income growth for households in their decile. Only the very highest decile beats average income growth, and those in the top 5 percent and top 1 percent of the distribution beat it by large margins. (See Figure 2.)
Figure 2
Inequality rose at a similar rate in the two most recent economic expansions
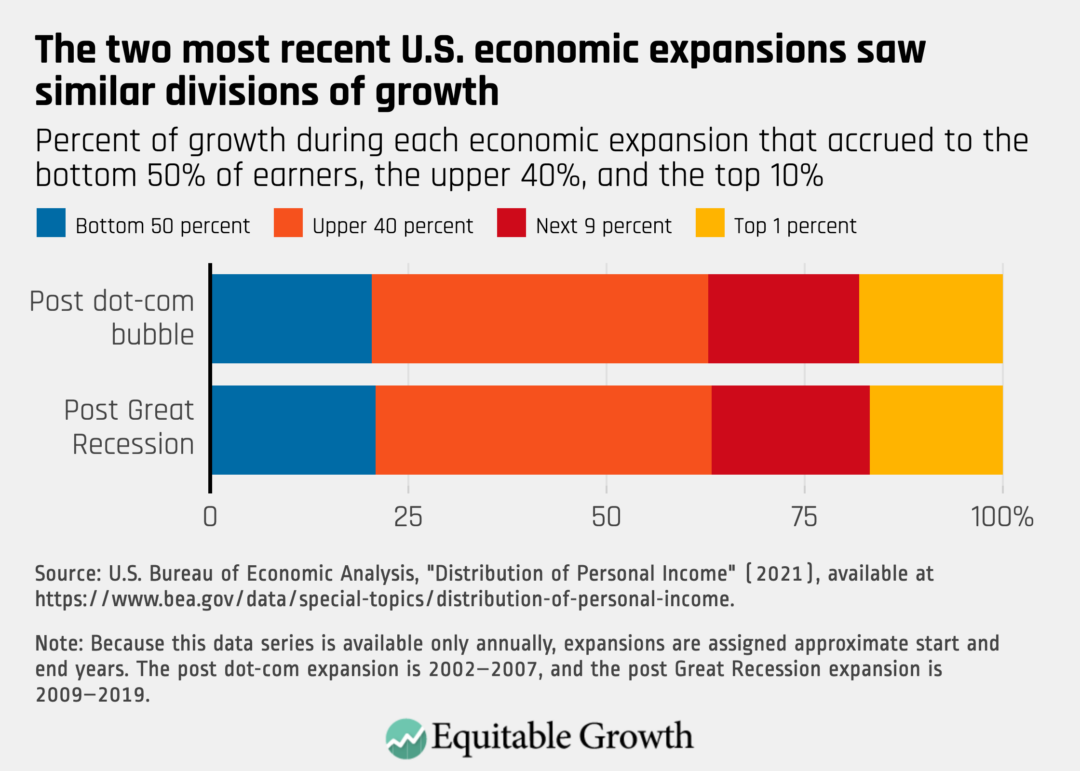
The next chart shows how growth was subdivided in the 2002–2007 economic recovery from the dot-com bubble of 2001 and the 2009–2019 recovery from the Great Recession of 2007–2009. In both of these expansions, growth patterns were similar.
In both recoveries, the bottom 50 percent of households received around 20 percent of economic growth in the expansion, despite representing 50 percent of the population. The “upper 40” group, which includes households above the 50th percentile of household income and below the 90th percentile, received about 42 percent of total growth in both periods, suggesting that this group is receiving a relatively fair share of growth. (See Figure 3.)
Figure 3
Low-income households had poor wage growth while high-income households registered strong business profits and asset-price rises
Next up are three charts that show how specific components of income contributed to the economic fortunes of the bottom 50 percent of households, the upper 40 percent, and the top 10 percent by income.
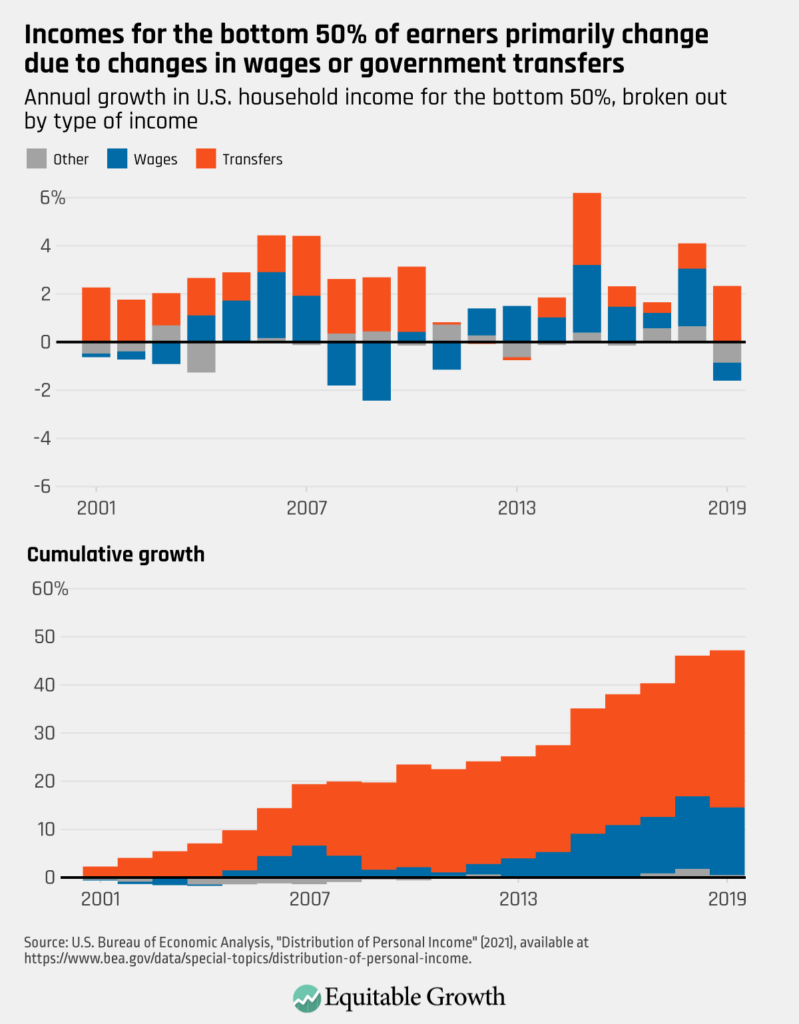
In the bottom 50 percent of households, wages and government transfer programs—economic parlance for social infrastructure programs, such as Unemployment Insurance, that underpin the economy during downturns—make up the vast majority of all income. Accordingly, these categories matter far more than others for determining income growth in this group.
Wage growth was relatively weak for the bottom 50 percent of households in the first two decades of the 21st century. The vast majority of income growth for this group came thanks to government transfers, such as the Affordable Care Act, more commonly called Obamacare and more formally known as the Patient Protection and Affordable Care Act of 2010. Obamacare boosted this group’s income significantly when it was implemented in 2014 and 2015. Health insurance provided what is known as a social transfer in-kind, meaning it doesn’t give money but gives a valuable service to people that they would otherwise have to pay for. That’s why Obamacare was a boost to incomes overall. (See Figure 4.)
Figure 4
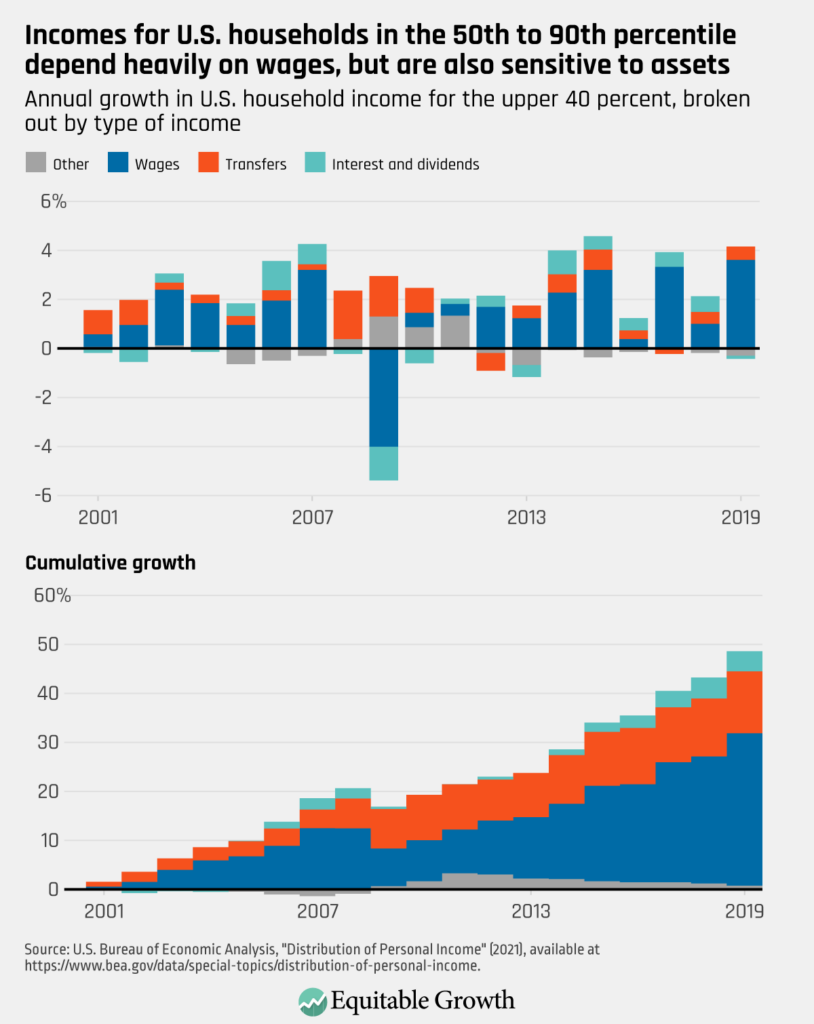
The story for the upper 40 percent of households is similar. Households in this group also get most of their income from wages, but they still receive some government transfers.
Unlike the bottom 50 percent of households, the upper 40 percent holds assets, and interest and dividend income from these assets represents about 8 percent of their total income in 2019. This group experienced robust wage growth in most of the expansionary years, providing the bulk of income growth for this group. (See Figure 5.)
Figure 5
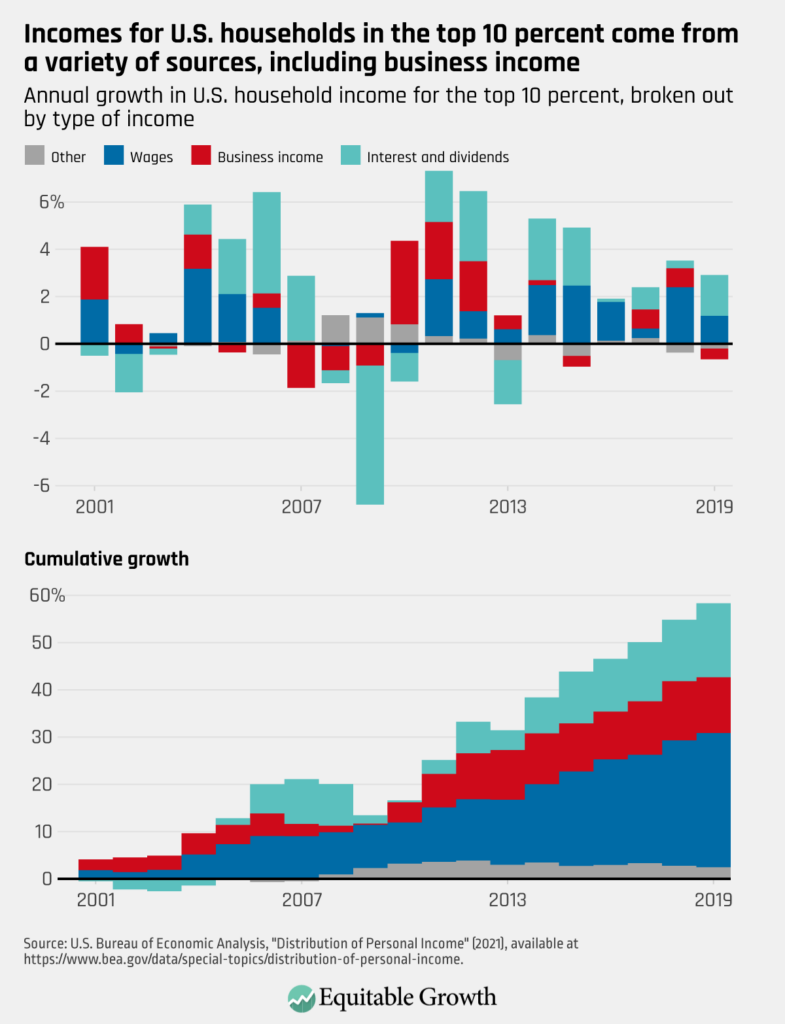
Then, there’s the top 10 percent of households, which boasts diverse sources of income that include wages, interest and dividends earned on assets, and business income. Notably, too, the BEA data series does not include capital gains, which would significantly increase the incomes of the top 10 percent of households by income. So, this should be considered a low estimate of top 10 percent income growth over the period.
This group enjoyed very strong wage growth, which was further supplemented by sources of capital income that are mostly concentrated in this group, even when capital gains are excluded. (See Figure 6.)
Figure 6