JOLTS Day Graphs: May 2022 Edition

Every month the U.S. Bureau of Labor Statistics releases data on hiring, firing, and other labor market flows from the Job Openings and Labor Turnover Survey, better known as JOLTS. Today, the BLS released the latest data for May 2022. This report doesn’t get as much attention as the monthly Employment Situation Report, but it contains useful information about the state of the U.S. labor market. Below are a few key graphs using data from the report.

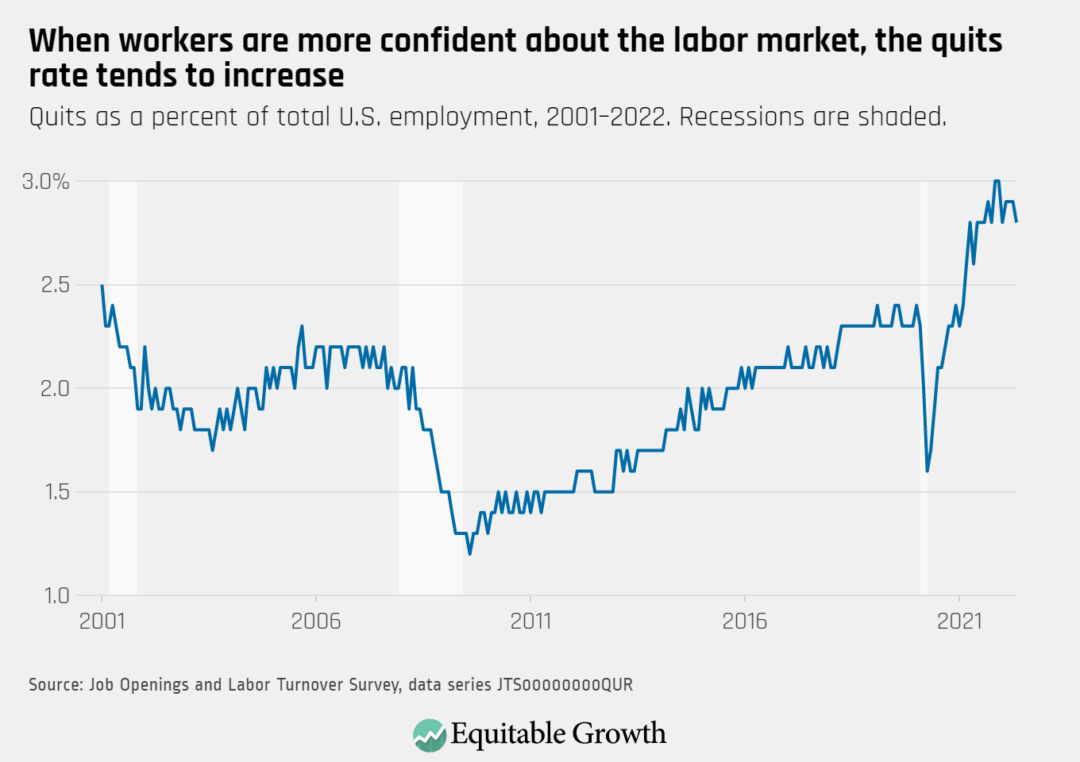
Quits have tempered from their recovery peak, declining slightly to 2.8 percent in May, but remain well above pre-pandemic levels.

Quits as a percent of total U.S. employment, 2001–2022. Recessions are shaded.

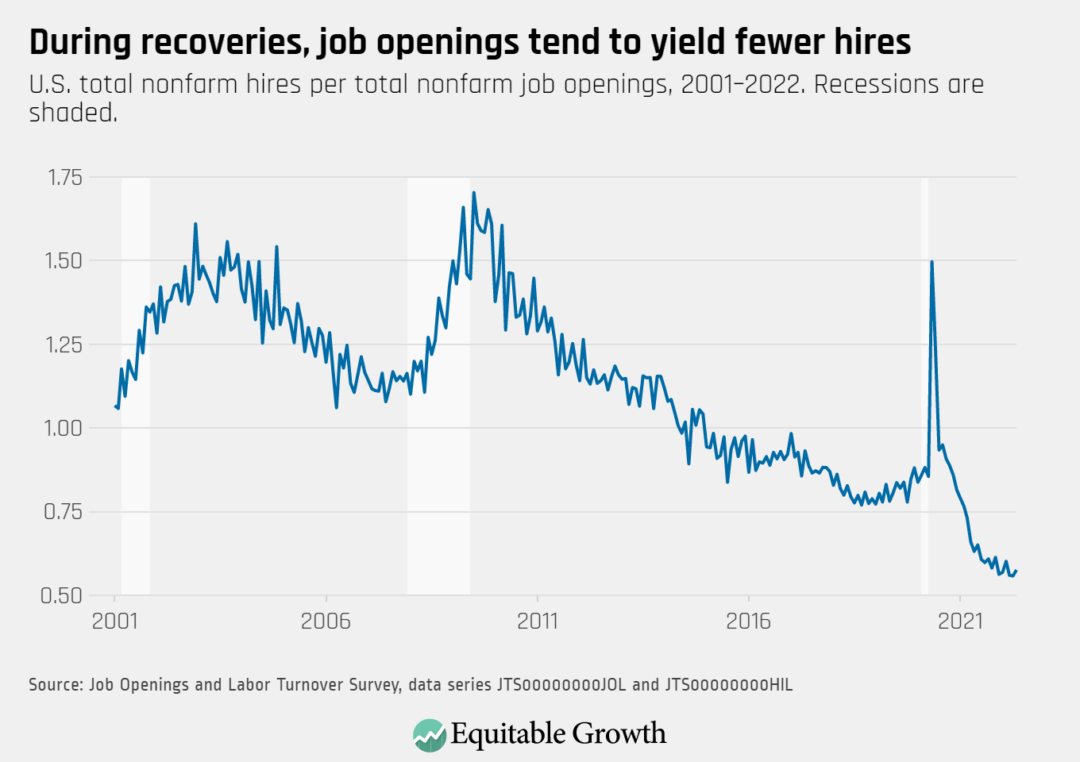
Job openings decreased to 11.3 million in May as total hires remained at 6.5 million over the month.

U.S. total nonfarm hires per total nonfarm job openings, 2001–2022. Recessions are shaded.

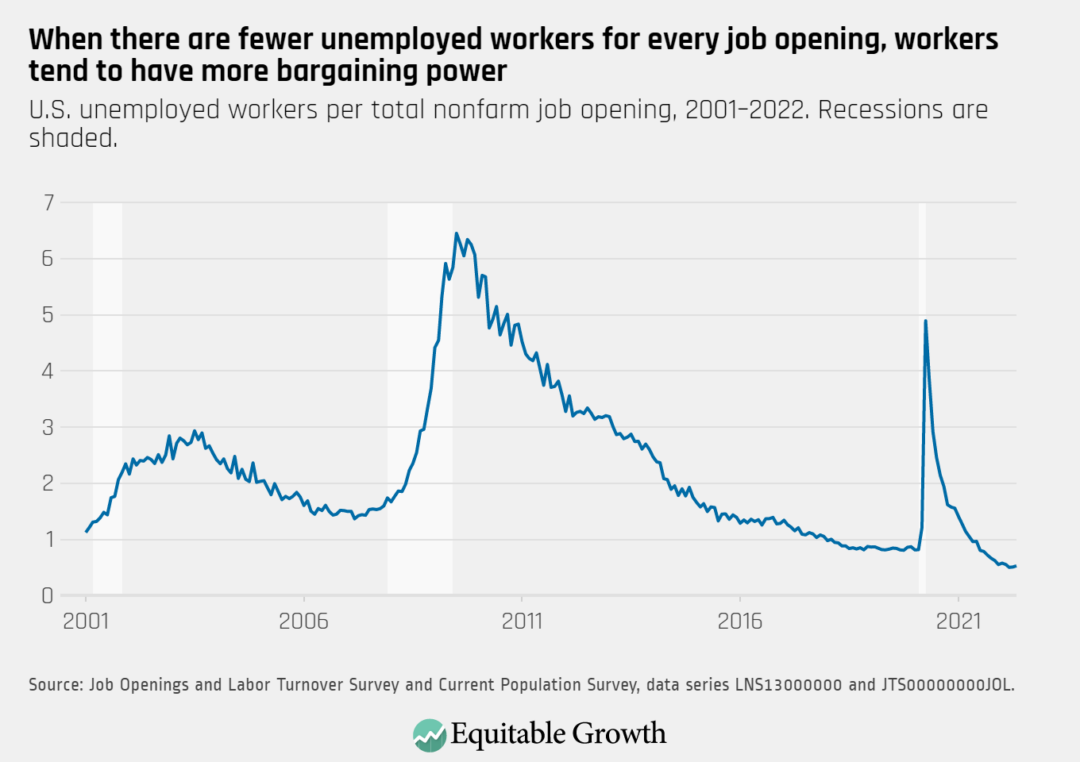
The ratio of unemployed workers-to-job openings increased slightly to 0.53 in May, potentially signifying a plateau of this rate following a rapid tightening of the labor market in the recovery.

U.S. unemployed workers per total nonfarm job opening, 2001–2022. Recessions are shaded.

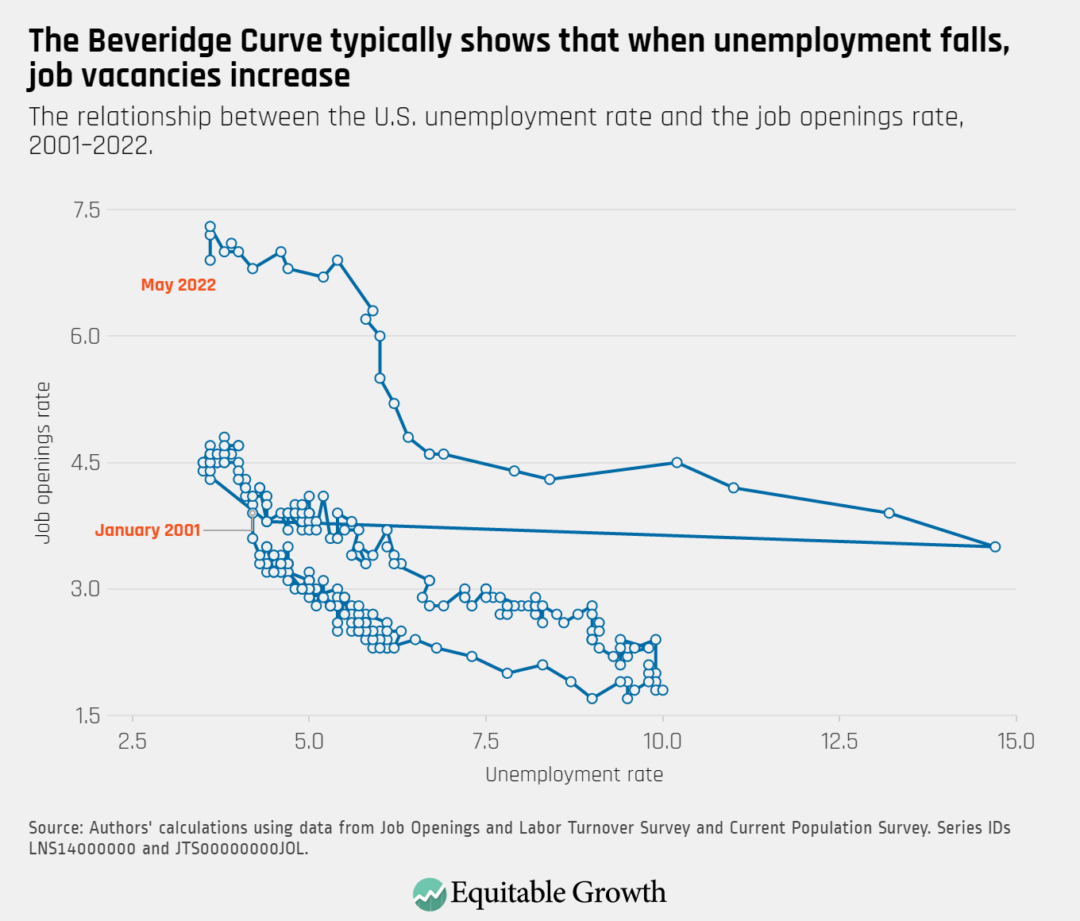
The Beveridge Curve moved downward in May as openings declined and unemployment remained steady, but remains outside its typical cyclical range.

The relationshi between the U.S. unemployment rate and the job openings rate, 2001-2022

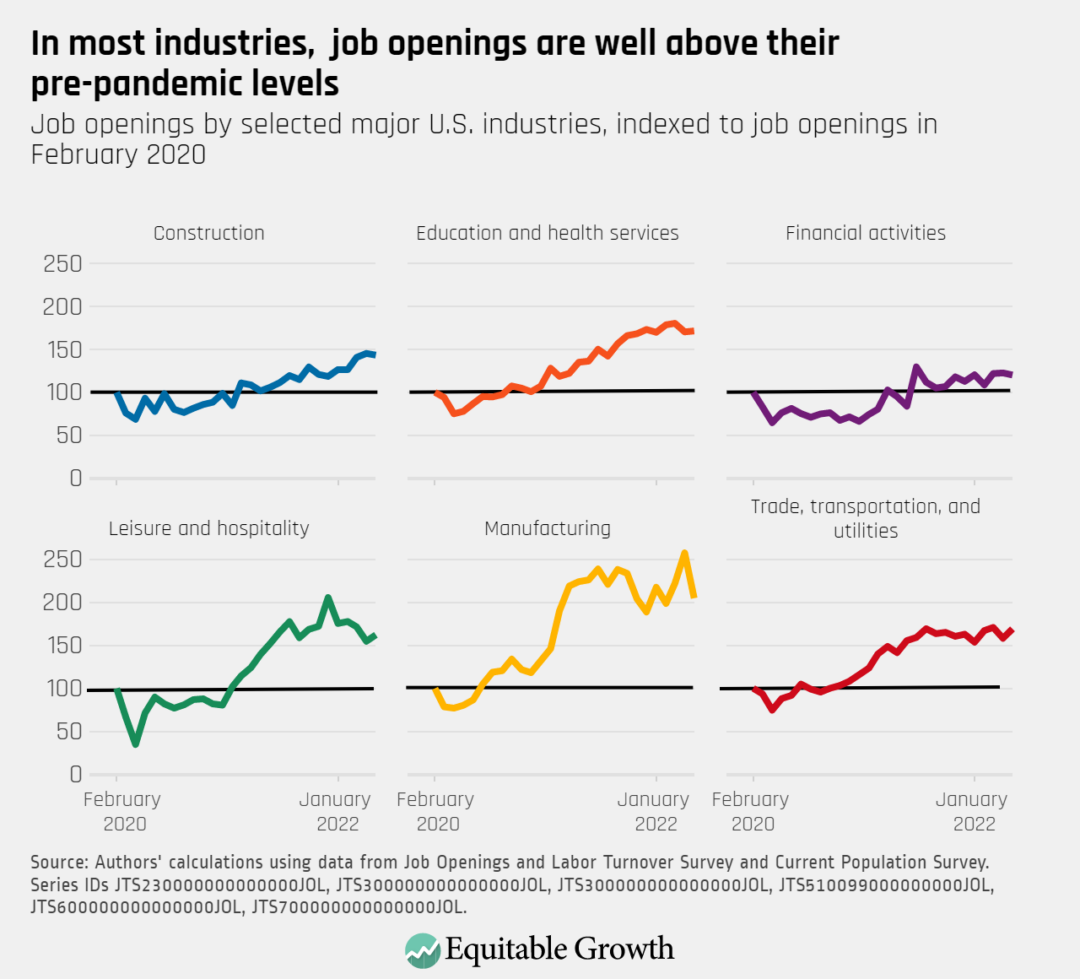
Job openings remain above pre-pandemic levels in most sectors, but openings decreased significantly in manufacturing in May.

Job openings by selected major U.S. insudtries, indexed to job openings in February 22020
Connect with us!

Explore the Equitable Growth network of experts around the country and get answers to today's most pressing questions!

Get in Touch