Canada is the first country to release subannual statistics on the distribution of income. Here’s how it was done.

Statistics Canada, the umbrella agency for national statistics in Canada, is the first statistical agency in the world to release subannual data on how economic growth is distributed among rich and poor households. In January of this year, it released a quarterly dataset of these distributional statistics for the first quarter of 2020 through the third quarter of 2021 called the Distributions of Household Economic Accounts, or DHEA. Then, in April, it released new statistics for the fourth quarter of 2021. Statistics Canada plans to continue releasing these quarterly snapshots on a one-quarter lag.
The production of these statistics at a quarterly frequency with relatively little lag is a watershed moment for the worldwide effort to produce more comprehensive and useful statistics on income inequality. For decades, reporting on income inequality has been dominated by the production of opaque “Gini coefficients,” which are difficult for nonspecialists to understand and are often constructed using incomplete measures of income.
This new vintage of inequality statistics will be easier for nonspecialists to interpret, while also offering more comprehensive measures of income. These data build on the pioneering work of Joseph Stiglitz at Columbia University, Amartya Sen at Harvard University, and Jean-Paul Fitoussi at the Institut d’Etudes Politiques de Paris—an expert group at the 38-member-nation Organisation for Economic Co-operation and Development on distributional national accounts—in their “Report by the Commission on the Measurement of Economic Performance and Social Progress,” as well as the many economists who have participated in the WID.world project to create comparable metrics of inequality for a large number of countries.
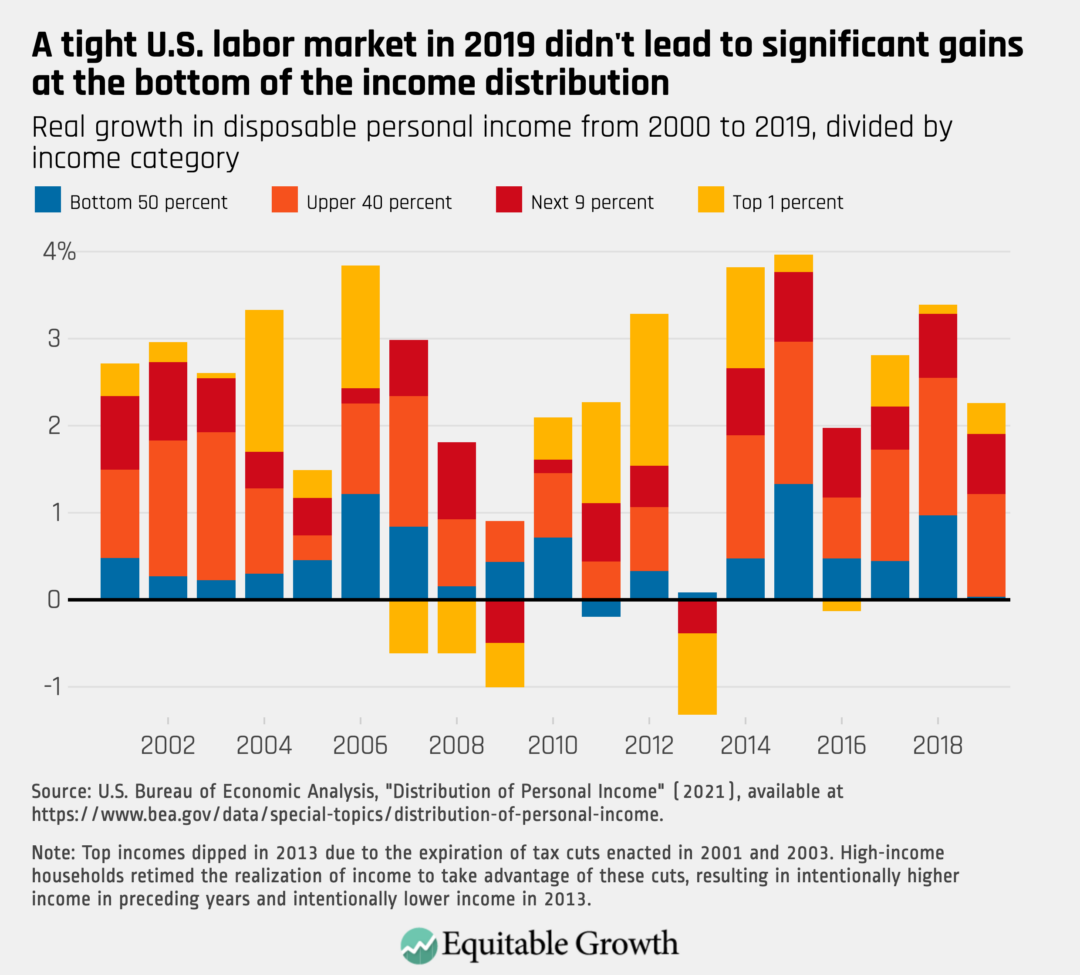
The U.S. version of these statistics, which does not currently offer subannual estimates and is released on a 2-year lag, provides simple answers to questions such as “What share of income is earned by middle-income Americans?” or “What percentage of annual growth accrued to the richest 10 percent of households?” The chart below shows how aggregate economic growth was divided in each year between the lowest-income half of U.S. households, the upper-income 40 percent above that, and the richest 10 percent of households. (See Figure 1.)
Figure 1
A number of other countries are also beginning to produce these statistics, mostly in an experimental capacity. Reducing the amount of lag in the production of these statistics and increasing the frequency of their release is the next frontier in inequality statistics. Statistics Canada’s example could provide a template to produce inequality statistics that provide up-to-date guidance for the public, businesses, and governments to act on.
In this column, I describe how Statistics Canada produced these data and detail some remaining caveats. Notably, Statistics Canada also produces distributional statistics for consumption and wealth, but I focus only on income here.
Overview of datasets and methods used to create Canada’s DHEA
A key advantage Statistics Canada has over the U.S. statistical agencies is that they start with their Social Policy Simulation Database. The SPSD is a high-quality synthetic dataset based on a blend of survey and administrative data that Statistics Canada has maintained in some form since 1990. It is primarily based on four data sources:
- The annual Canadian Income Survey
- The biennial Survey of Household Spending
- Annual income tax return data
- Employment insurance claimant history records
These data sources are blended, and disclosure avoidance techniques are applied to ensure privacy.
The SPSD is publicly available and comes packaged with a simulation program that can be used to look at the impacts of various policy options on Canadian households. Analysts can simulate different kinds of tax changes, for example, or changes in levels of social spending using the simulation program.
This database is fairly different from what the U.S. Bureau of Economic Analysis has access to in the United States. There is no current synthetic dataset that blends administrative and survey data that is widely available to agencies and other researchers. This may change soon, as the U.S. Census Bureau is currently working on some large data blending projects, as well as disclosure avoidance strategies that may make blended synthetic data files available.
Nor can BEA start with confidential administrative data, such as IRS tax returns, because the tax code specifically prohibits this sharing. It is a serious flaw in the U.S. tax code that our economic statistical agencies are prohibited access to these data, which would allow them to construct more innovative and ambitious statistical products that could be informative for the public. Consequently, BEA starts with one part of the Census Bureau’s Current Population Survey, the Annual Social and Economic Supplement, which is somewhat comparable to the Canadian Income Survey.
Statistics Canada follows the lead of the OECD expert group on distributional national accounts, as does BEA in the United States. The aggregate income concepts targeted by each agency are a bit different, but both come relatively close to reproducing the System of National Accounts’ definition of disposable income (BEA’s statistics are available for both personal income and disposable personal income).
Because both methods are grounded in the OECD approach, they have some core similarities. Both make some use of a technique called scaling, for example, to ensure that aggregate income in the microdata match aggregate income in the national accounts. This approach has been criticized, but more research is necessary to determine exactly why these aggregates disagree and how to correct for discrepancies. For now, scaling is the best answer we have. Statistics Canada also makes adjustments to the SPSD data to ensure compatibility with System of National Accounts’ income definitions. These include deriving imputed rent estimates and adjustments for tax-sheltered income.
Methods used in the subannual DHEA
Statistics Canada goes beyond any other country in offering subannual distributions. The agency began producing these in response to demand from the public and government officials to better understand the effects of the COVID-19 pandemic. For the most part, the datasets used to create the SPSD are available only at annual frequency, so statisticians had to get a little creative to provide subannual measures.
An easy way to create subannual distributions is to take existing distributions of income in wages, business income, and other income categories and simply apply them to new national accounts aggregates. This can be an inaccurate approach. In this approach, if the first quintile of households by income earned 10 percent of wage income in the previous year, statisticians would simply assume this distribution continues to apply in current-year quarters, but economists know that these distributions change, so this is not generally going to produce very accurate results.
If agencies want to construct accurate subannual estimates of household income, then it is important for them to try to redistribute at least some income sources on a subannual basis. In other words, they must find a data source that can be used to make a new estimate of how some sources of income are spread across the income distribution. As I have previously explained, the vast majority of income for the lower 90 percent of households comes from wages and government transfers. So, these are the most important categories of income to redistribute.
 post
post
 post
post

Statistics Canada’s solution is very close to the one adopted by the website Realtime Inequality. Realtime Inequality is a project from University of California, Berkeley economists Thomas Blanchet, Gabriel Zucman, and Emmanuel Saez that reports distributional measures of growth in the United States on a quarterly cadence. Both Statistics Canada and Realtime Inequality redistribute government transfers using rules-based simulation. That is, they look at known data on households, such as income, household size and composition, and other relevant information, and use those criteria to determine whether or not the household is eligible for government transfers, such as the stimulus checks issued by the U.S. government during the pandemic.
For wages, another data source is necessary. Statistics Canada uses the monthly Canadian Labour Force Survey. This survey asks respondents a number of questions about employment status and earnings from employment. Statistics Canada uses the responses to these questions to simulate the number of weeks worked and wages for individuals each quarter.
Additionally, the Labour Force Survey asks questions about respondents’ business income. This allows Statistics Canada to redistribute that category of income as well. Unfortunately, in the United States, there are no similar sources of high-frequency business income data to draw on.
Realtime Inequality distributes wages using the Quarterly Census of Employment and Wages. The QCEW does not provide disaggregated data on the wages of particular employees, but it does report out the total money spent on wages in highly disaggregated cells. Pioneering work by Byoungchan Lee of the Hong Kong University of Science and Technology demonstrates that the QCEW can be used to proxy for the distribution of income.
For other sources of income, among them interest and dividends, both Statistics Canada and Realtime Inequality use old, known distributions mapped onto current quarter aggregates. These sources of income account for relatively small percentages of household income outside the top 10 percent of households, making them less important as contributors to inequality.
Implications for the methods of disaggregating U.S. economic data
One significant caveat is necessary. To date, Statistics Canada has not released a public analysis of the accuracy of their method. Subannual estimation of inequality necessarily relies on a modeling approach that may make these estimates less accurate. So-called nowcasting techniques, such as the one described above, require revisions when more accurate annual data are released.
Until that analysis is released, some caution is warranted. The Realtime Inequality website, which uses a similar approach to nowcasting, has shown that the approach can be relatively accurate. In their methods paper, the creators of Realtime Inequality show that they only rarely make errors in the direction of growth. That is, they very rarely find that income for a particular income group—say, the bottom 50 percent—is shrinking when it is, in fact, growing. This is an encouraging sign for the methodology, but more error analysis is necessary.
Statistics Canada may have some advantages that are unavailable to the U.S. Bureau of Economic Analysis. Canada’s Social Policy Simulation Database provides blended administrative and survey data to use as a base for the statistics. The U.S. Bureau of Economic Analysis has no similar starting point and begins instead with the Annual Social and Economic Supplement to the Current Population Survey. The Realtime Inequality team starts with IRS tax data. It is not entirely clear how these differing data sources affect accuracy. More work is necessary to better understand why all these data sources fall short of national income aggregates.
In short, considerable research is still necessary. In 2021, BEA issued a report on the feasibility of creating quarterly distributions. At the time, no one had demonstrated a working prototype of quarterly reporting using current distributions of government transfers and earnings. BEA did not investigate the possibility of using the QCEW data or another dataset to make those redistributions.
In light of continued interest from policymakers and proof of concept from both Realtime Inequality and Statistics Canada, it would be appropriate for BEA to revisit this decision. A prototype dataset blending existing BEA data with QCEW data would provide an opportunity to test the accuracy of more timely predictions and decide whether they meet the necessary standards of national statistical reporting.