JOLTS Day Graphs: February 2022 Edition

Every month the U.S. Bureau of Labor Statistics releases data on hiring, firing, and other labor market flows from the Job Openings and Labor Turnover Survey, better known as JOLTS. Today, the BLS released the latest data for February 2022. This report doesn’t get as much attention as the monthly Employment Situation Report, but it contains useful information about the state of the U.S. labor market. Below are a few key graphs using data from the report.

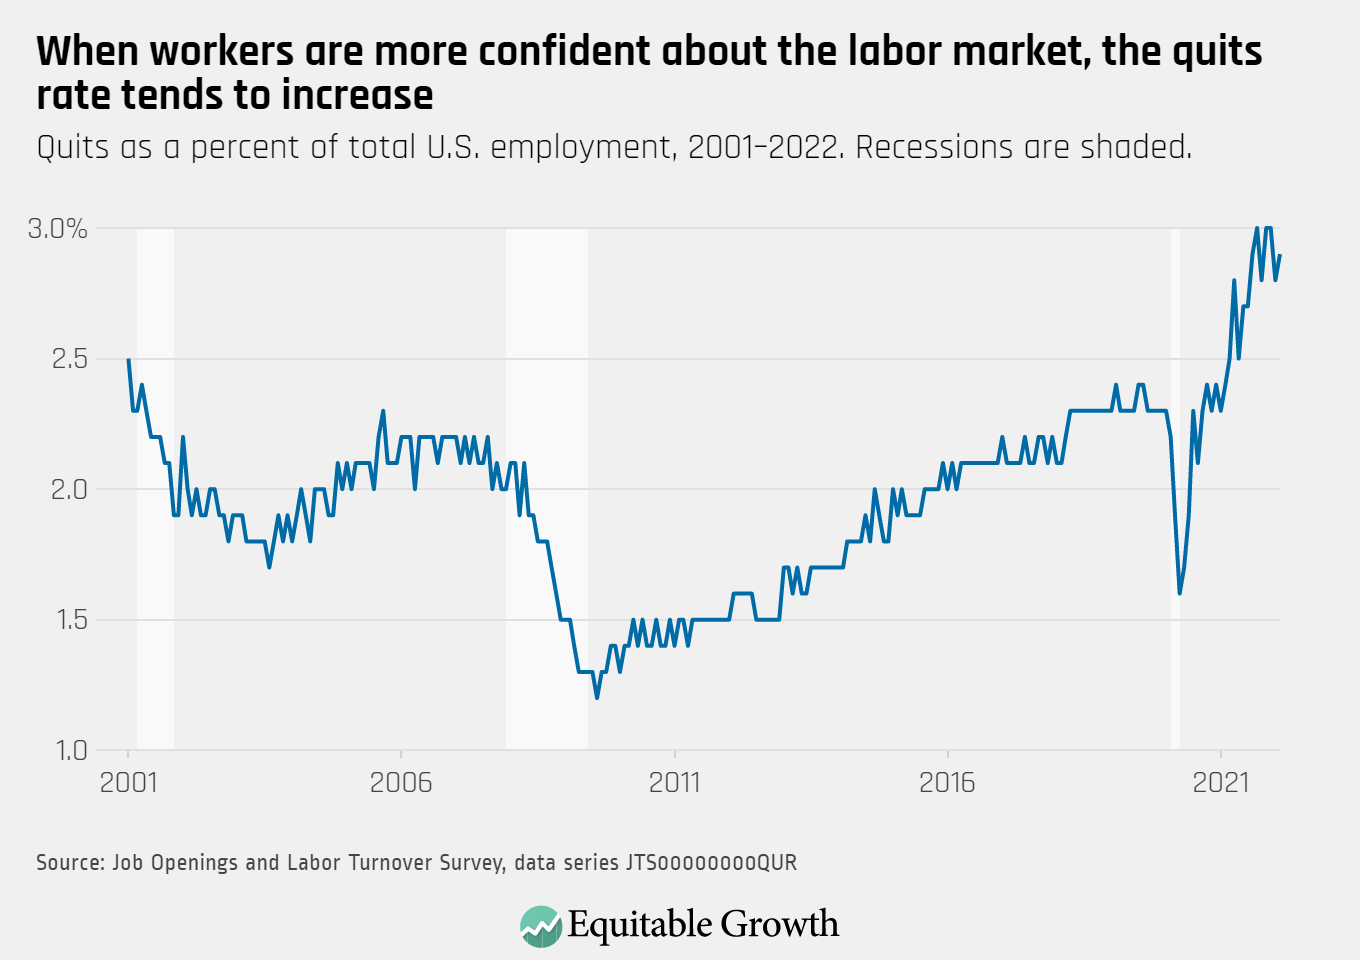
The quits rate rose slightly to 2.9 percent as 4.4 million workers quit their jobs in February.

Quits as a percent of total U.S. employment, 2001–2022. Recessions are shaded.

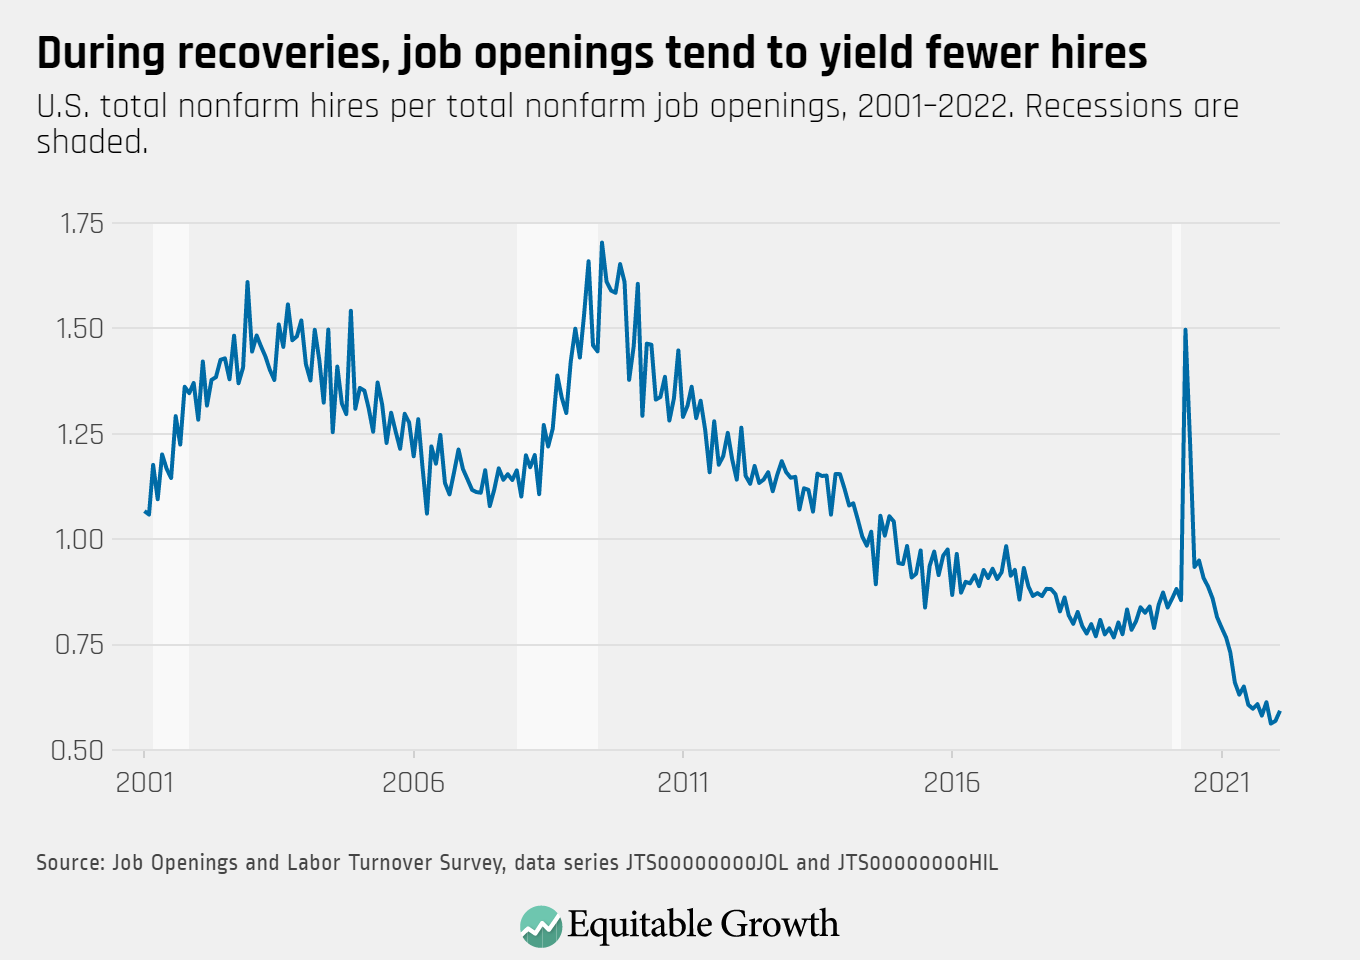
The vacancy yield increased to 0.59 in February from less than 0.57 in January, as job openings stayed at around 11.3 million and hires increased to 6.7 million.

U.S. total nonfarm hires per total nonfarm job openings, 2001–2022. Recessions are shaded.

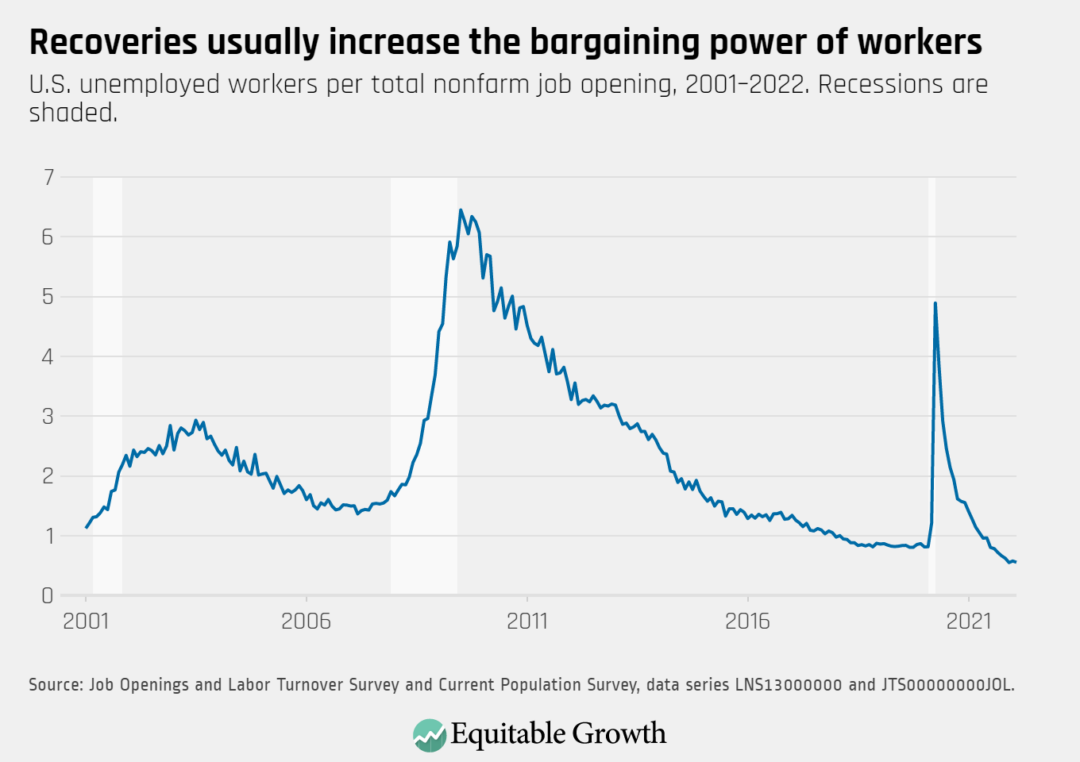
The ratio of unemployed-worker-per-job-opening declined last month, from 0.58 unemployed workers per job opening in January to 0.56 in February.

U.S. unemployed workers per total nonfarm job opening, 2001–2022. Recessions are shaded.

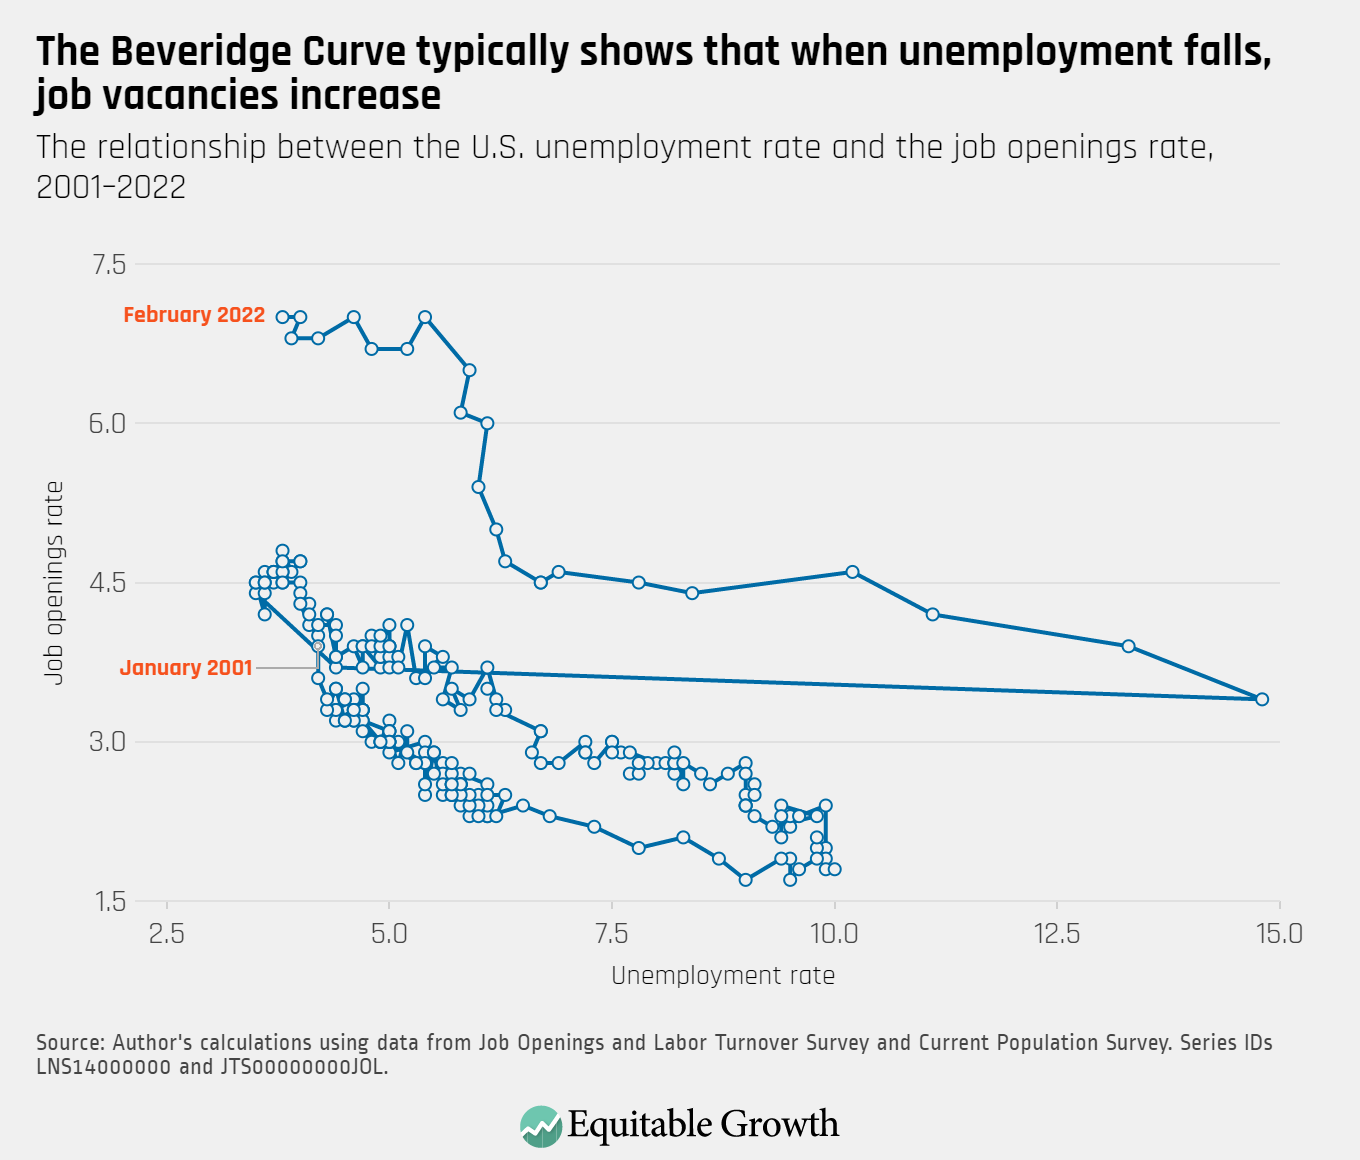
The Beveridge Curve continues to be in an atypical range compared to previous business cycles, as the unemployment rate fell to 3.8 percent and the rate of job openings remained at 7.0 percent.

The relationship between the U.S. unemployment rate and the job openings rate, 2001–2022.

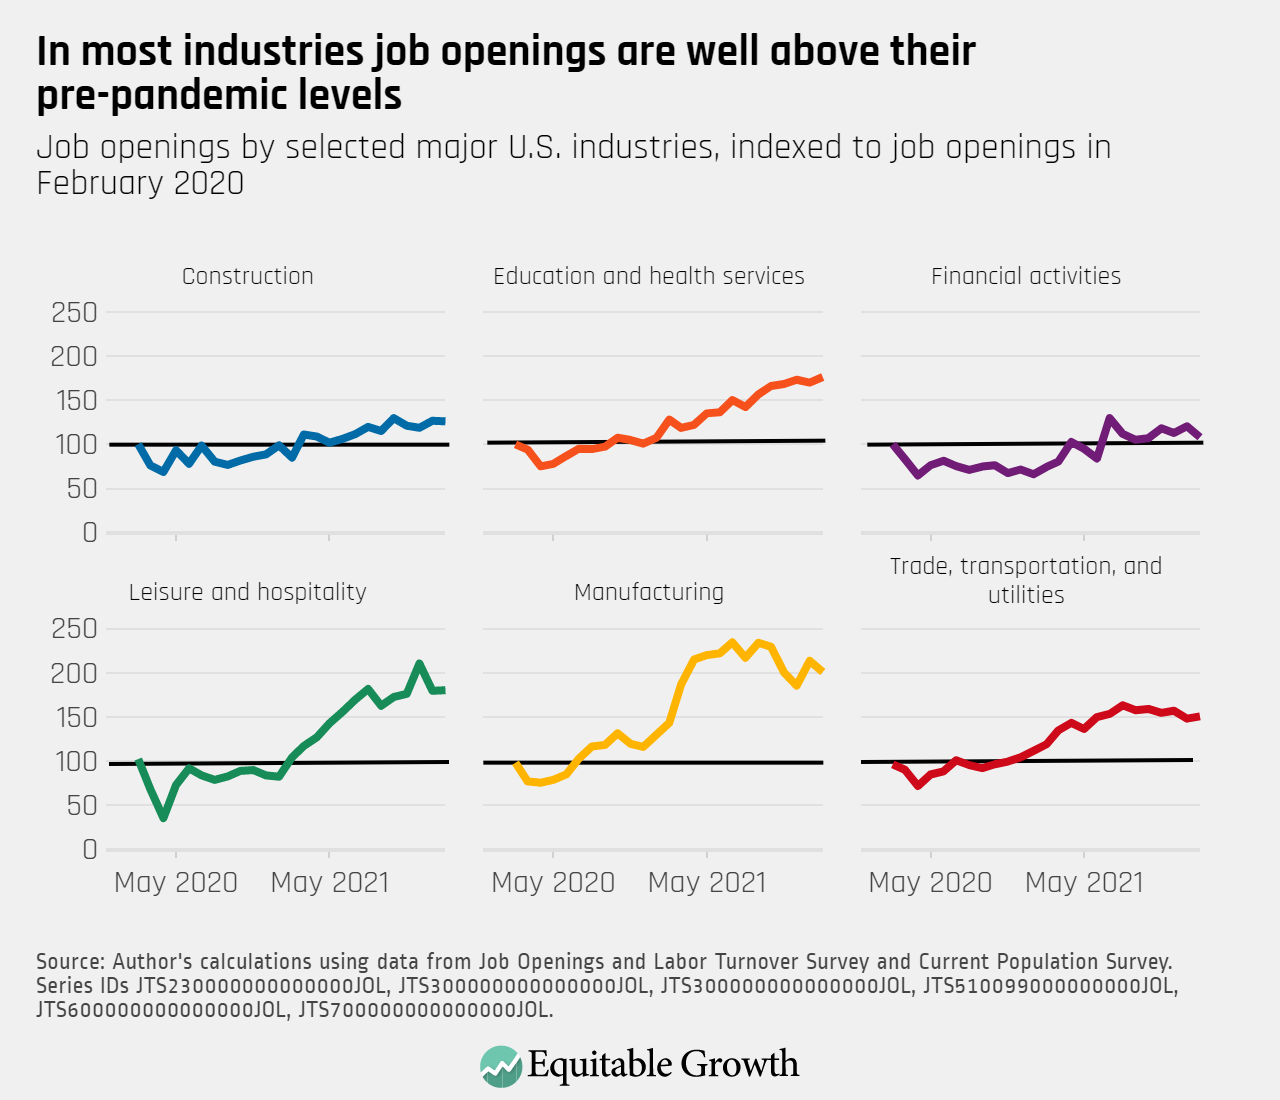
Even with some declines in the number of job openings in sectors such as financial services and manufacturing, job openings remain elevated in many major industries compared with pre-pandemic levels.

Job openings by selected major U.S. industries, indexed to job openings in February 2020
Connect with us!

Explore the Equitable Growth network of experts around the country and get answers to today's most pressing questions!

Get in Touch