Policymakers at the state and federal levels of government in the United States who are steeped in the nation’s Unemployment Insurance system are wellaware that many unemployed workers fail to access this critical income support program. Since the Great Recession of 2007–2009, attention on the demographic disparities in accessing these joint federal-state programs has grown. Research consistently finds that members of marginalized racial and ethnic groups and people with lower levels of education and income are far less likely to tap into Unemployment Insurance when they lose their jobs through no fault of their own than their more-advantaged counterparts in the U.S. workforce.
These problems faced by marginalized workers when dealing with the nation’s Unemployment Insurance system undermine U.S. economic growth and prosperity. A key role of the UI system during a recession is to provide income support to individuals who have lost employment, automatically reducing the severity of the recession. If Unemployment Insurance does not reach these individuals, then disadvantaged communities and the economy as a whole suffer. Yet policymakers and academics alike debate the reasons why these marginalized groups of U.S. workers are less likely to receive Unemployment Insurance when they lose their jobs.
Some say it’s because low-income workers have less incentive to apply for Unemployment Insurance since the income support they receive if they successfully apply is too meager. Others argue that differences in eligibility status for the income support program, due to the kind of jobs lost by marginalized workers is the problem. And still others say union membership is pivotal in determining which workers tap the UI system. Finally, structural disparities in the design of the UI system mean that low-earning, gig, and seasonal jobs are often excluded from UI eligibility, disproportionately excluding disadvantaged workers.
Much attention has been paid to how the dramatic COVID-19 recession of 2020 and ensuing economic recovery sorely tested the nation’s Unemployment Insurance system. But changes to the UI system’s eligibility criteria enacted by the U.S. Congress in response to the crisis also made it far easier for marginalized racial and ethnic groups and people with lower levels of education and income to gain access to this key income support program amid the sharpest rise in unemployment since the Great Depression more than 70 years ago.
Were these changes to eligibility requirements enough to erase the demographic disparities that have plagued the UI system for so long? My new working paper with Hesong Yang at the University of Illinois Urbana-Champaign, “Understanding Disparities in Unemployment Insurance Recipiency,” examines these disparities in UI recipiency and the policy experiment that occurred when pandemic-era UI programs granted eligibility to workers who did not satisfy traditional UI eligibility criteria. We investigate whether these changes, in addition to increases in UI income support to all workers, were enough to close disparities in access.
We conclude from our analysis of pre- and post-COVID-19 recession data that even with greater access to Unemployment Insurance before and after the recession, members of disadvantaged demographic groups continue to be less likely to access this income support program than their more-advantaged counterparts. Specifically, we find:
Black and Latino workers receive Unemployment Insurance at lower rates than White non-Latino workers.
Younger workers access Unemployment Insurance at lower rates than older workers.
Less-educated workers are less likely to apply for Unemployment Insurance than workers with higher levels of education.
Heterosexual workers are more likely to access Unemployment Insurance than lesbian, gay, and bisexual workers.
Citizens access Unemployment Insurance at higher rates than noncitizens.
People who are highly affected by stress are less likely to receive Unemployment Insurance than people who are less affected by stress.
Union members are more likely to receive Unemployment Insurance than nonunion members.
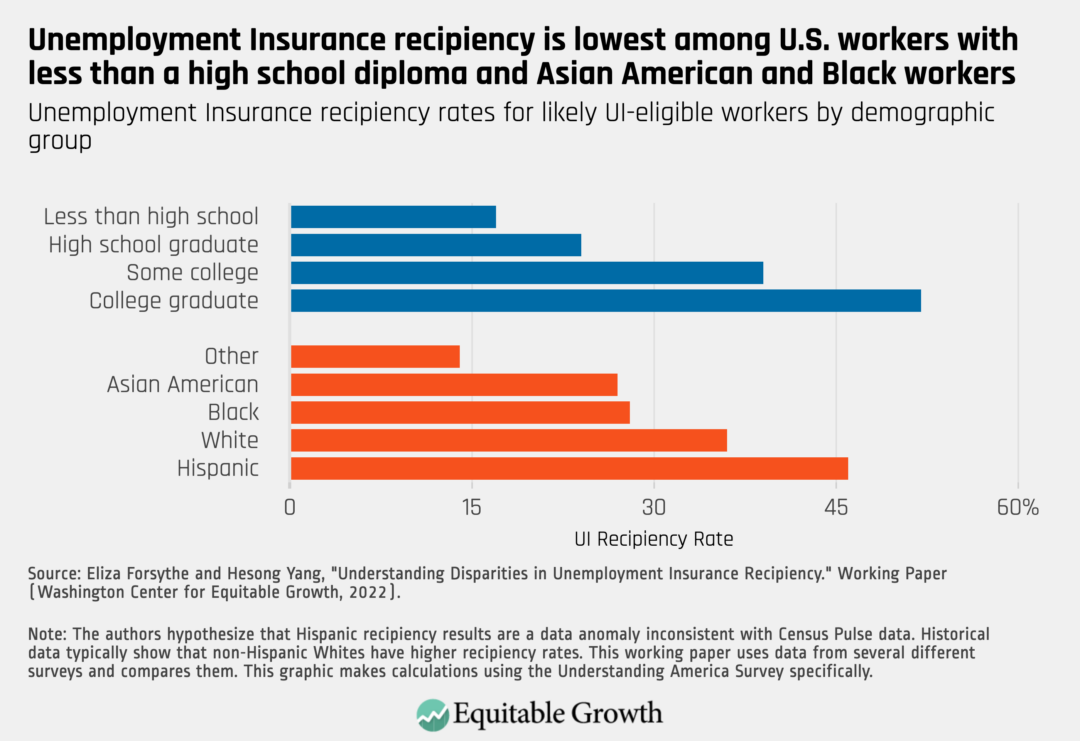
Crucially, many of these groups that are less likely to receive Unemployment Insurance are the same groups that were more likely to lose work during the pandemic. Thus, disparities in access to UI benefits further exacerbate inequalities in the labor market. (See Figure 1.)
Figure 1
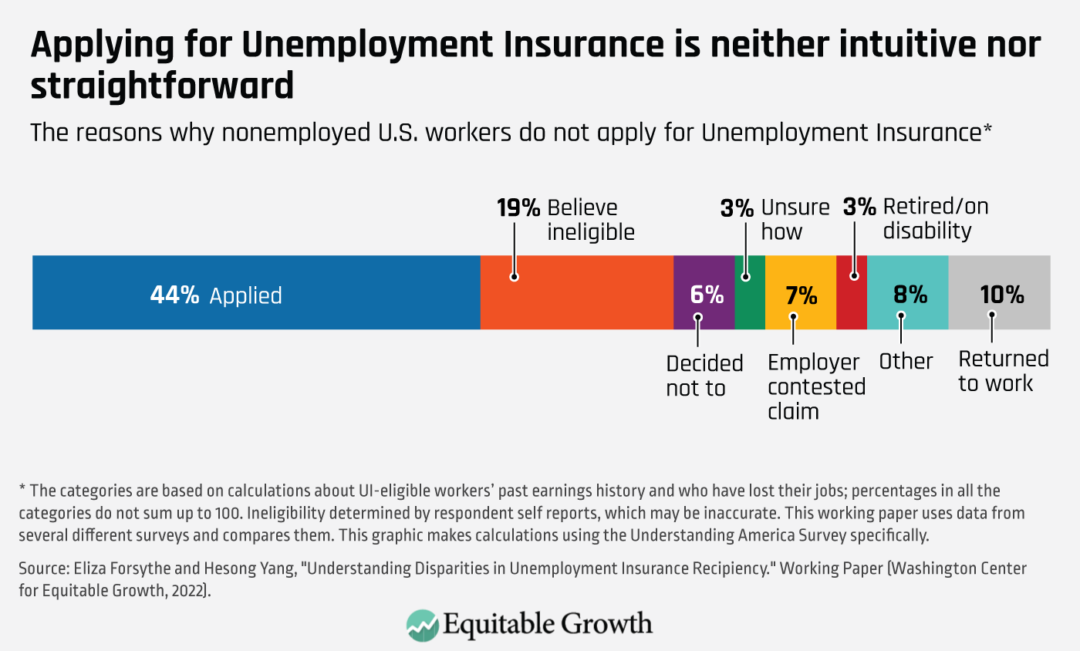
We find in our research that the two greatest barriers for workers to access Unemployment Insurance are incorrect information about their eligibility and uncertainty about how to apply for this key income support—at one of the most critical times in workers’ livelihoods. For all demographic groups, incorrect beliefs about eligibility are the key reason eligible individuals did not apply, with a smaller role for being unsure how to apply, in particular for younger workers and those without a high school degree.
In our analysis, we are careful to focus on individuals who are very likely to be eligible for UI benefits. Thus, these mistaken beliefs about ineligibility are largely incorrect. We find a similar pattern both before and during the pandemic, indicating that poor knowledge of the UI system is an enduring issue.
These findings are important as policymakers in Washington and in statehouses around the country assess the pandemic UI programs and look toward longer-term structural reforms. Our findings suggest expanding eligibility and increased benefit levels are insufficient to reach all eligible workers. Rather, states need to be more proactive in identifying potentially eligible workers and providing them with information and assistance. (See Figure 2.)
Figure 2
The U.S. Department of Labor’s recent pilot program to provide UI “navigators” to help potentially eligible workers navigate the UI system is an important step in the right direction. I encourage states to continue to innovate in finding ways to identify potentially eligible workers and target information and assistance to these individuals. Such policies offer an opportunity to target assistance to disadvantaged groups and to narrow disparities in UI receipt.
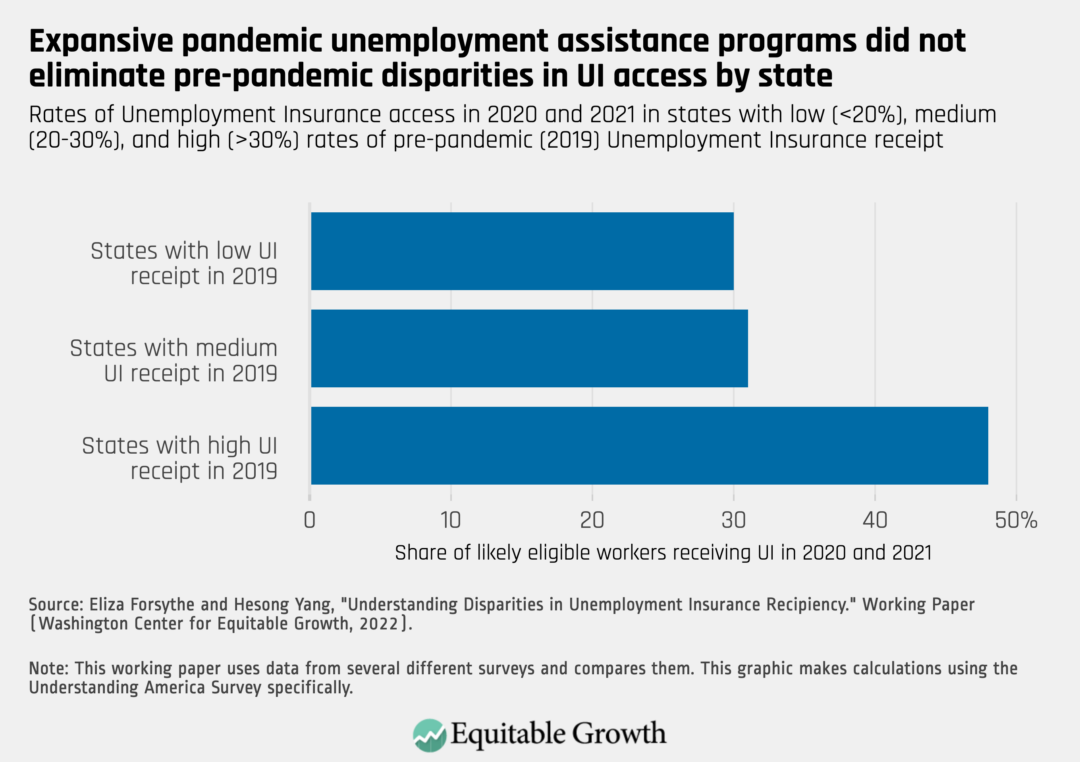
Although we document that states with historically low UI recipiency rates continue to have lower recipiency rates during the pandemic, these state differences are unable to explain the differences across demographic groups. Instead, disparities in UI recipiency are a problem for all states, even those that are more successful at providing high levels of access to benefits overall. Thus, all states should work to improve equity in their UI systems, a perspective that has been embraced by the U.S. Department of Labor. (See Figure 3.)
Figure 3
In short, this paper shows that even with the loosened eligibility requirements and increased benefit levels during the COVID-19 pandemic, workers from disadvantaged demographic groups were less likely than workers from other groups to access Unemployment Insurance. For our nation’s UI program and other parts of our social infrastructure tied to employment to work effectively and efficiently for all workers, we must make sure that all workers are aware of the program and can apply for it easily.
— Eliza Forsythe is an assistant professor of economics at the University of Illinois Urbana-Champaign.
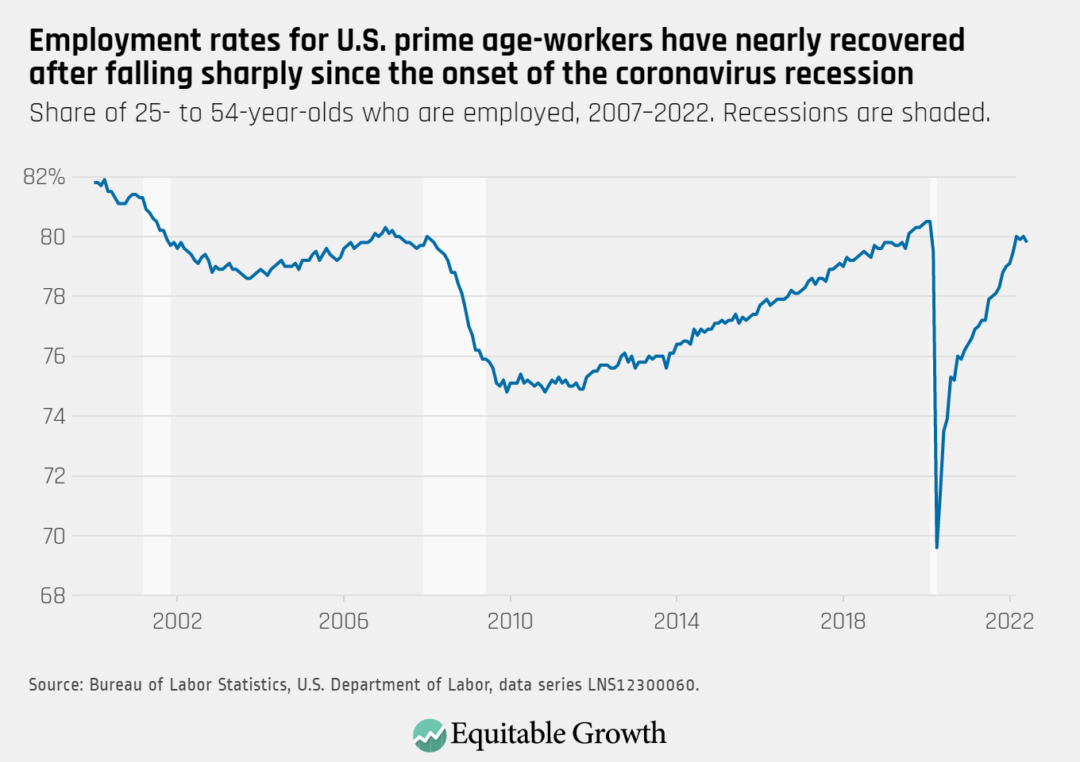
On July 8, the U.S. Bureau of Labor Statistics released new data on the U.S. labor market during the month of June. Below are five graphs compiled by Equitable Growth staff highlighting important trends in the data.
Total nonfarm employment rose by 372,000 in June, and the employment rate for prime-age workers decreased slightly to 79.8 percent.
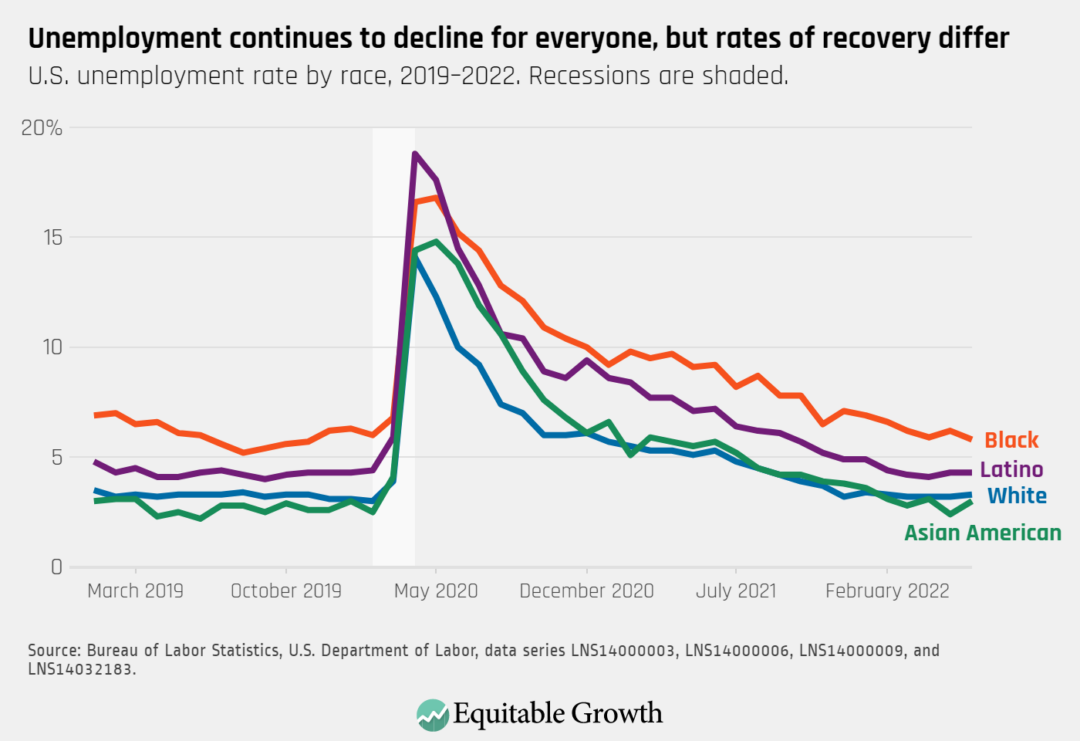
The unemployment rate stayed at 3.6 percent again in June, and remains higher for Black workers (5.8 percent) and Latino workers (4.3 percent) compared to White workers (3.3 percent) and Asian American workers (3.0 percent).
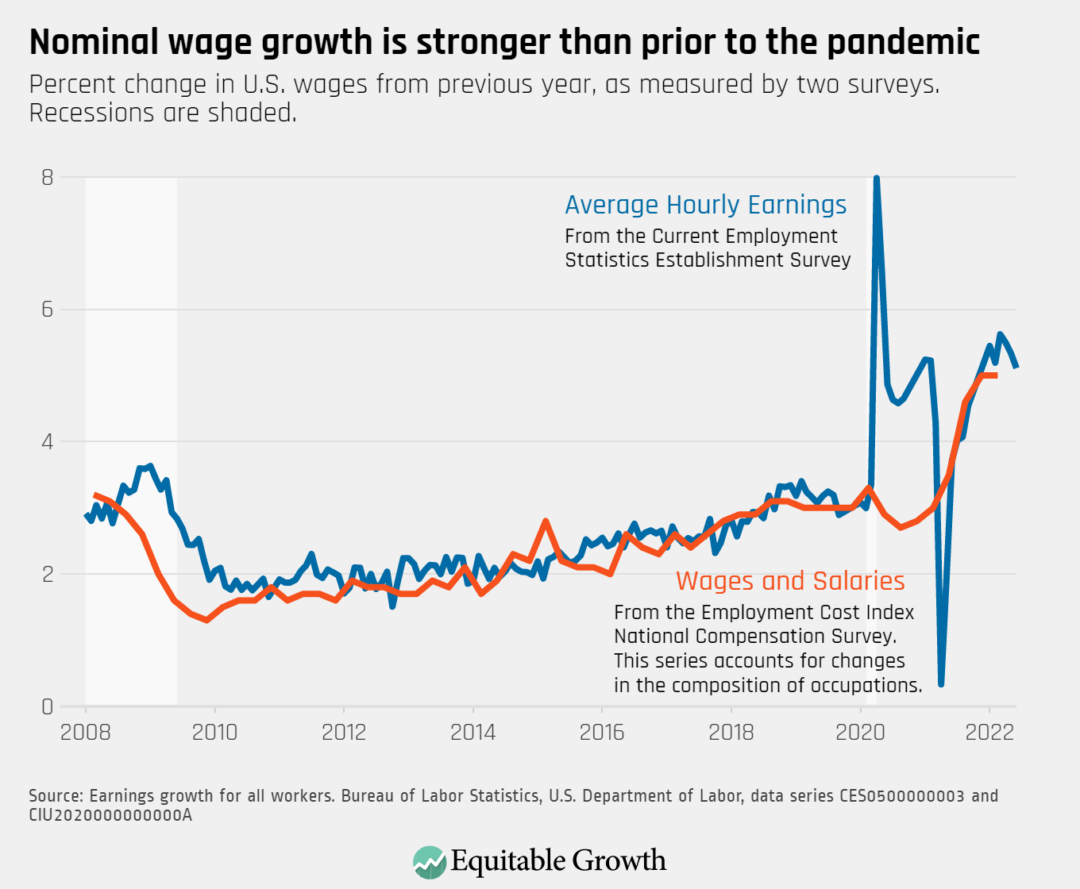
The rate of growth for average hourly earnings slowed in June to 5.1 percent over the previous year, down from 5.3 percent in May.
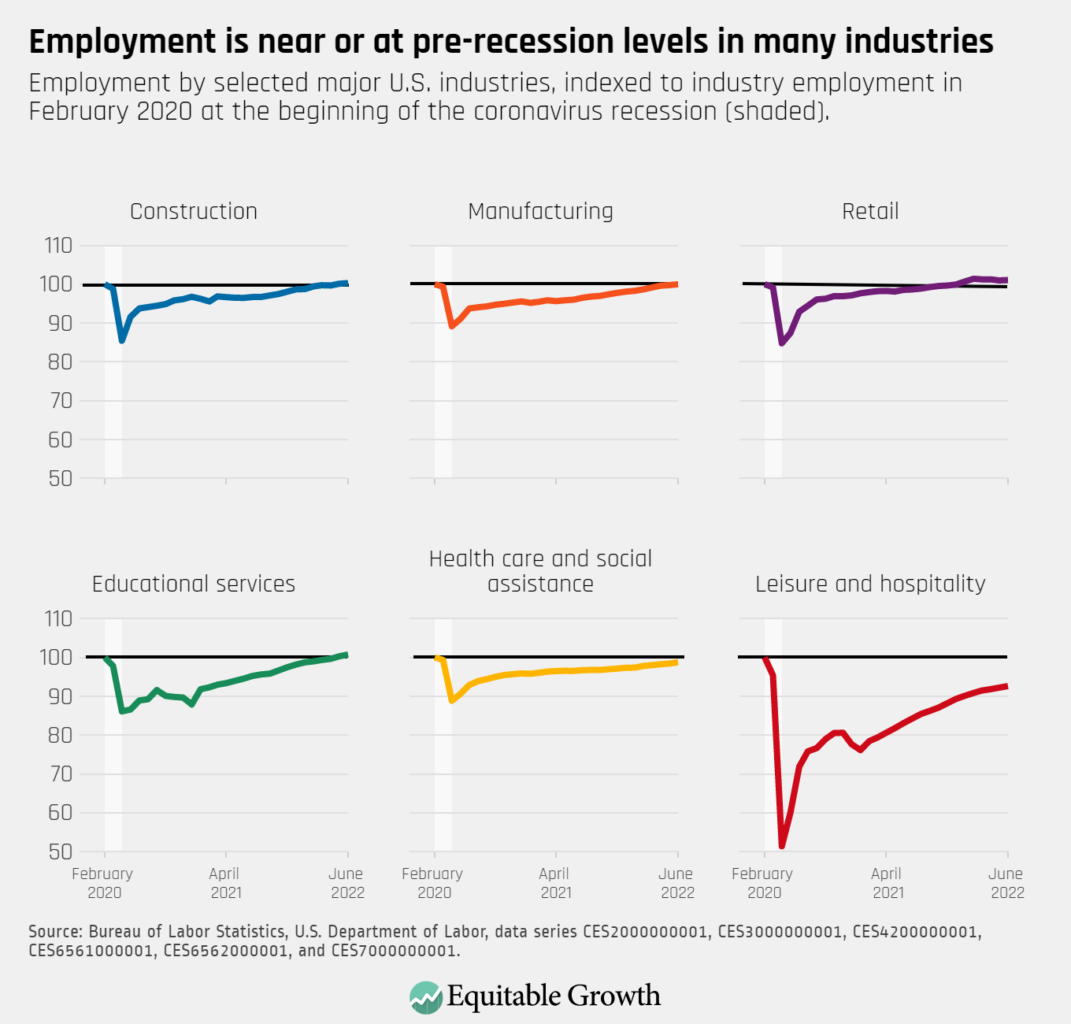
Employment in construction, manufacturing, retail, and educational services is now back to or surpassing pre-pandemic levels, but employment in leisure and hospitality has yet to fully recover.
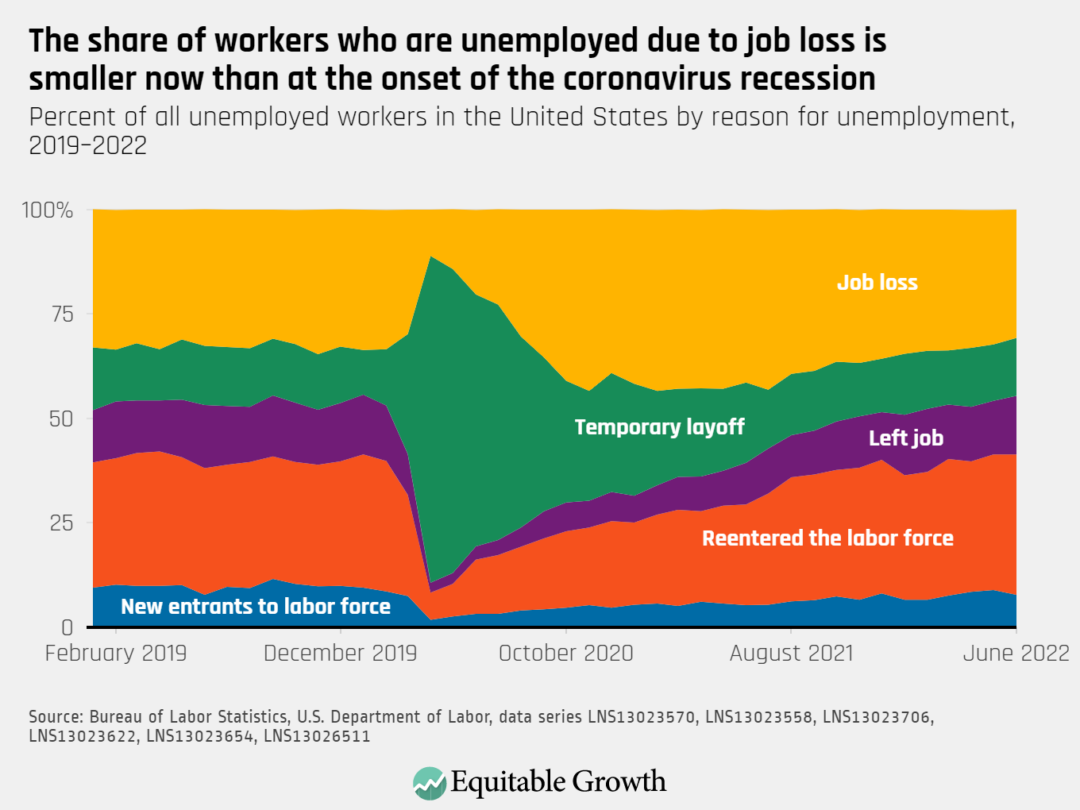
The number of unemployed workers remained steady in June. The share who are unemployed due to job loss fell to 30.7 percent, and 13.9 percent are on temporary layoff; 14.0 percent left their jobs, 33.6 percent are re-entering the labor force, and 7.8 percent are new entrants.
Statistics Canada, the umbrella agency for national statistics in Canada, is the first statistical agency in the world to release subannual data on how economic growth is distributed among rich and poor households. In January of this year, it released a quarterly dataset of these distributional statistics for the first quarter of 2020 through the third quarter of 2021 called the Distributions of Household Economic Accounts, or DHEA. Then, in April, it released new statistics for the fourth quarter of 2021. Statistics Canada plans to continue releasing these quarterly snapshots on a one-quarter lag.
The production of these statistics at a quarterly frequency with relatively little lag is a watershed moment for the worldwide effort to produce more comprehensive and useful statistics on income inequality. For decades, reporting on income inequality has been dominated by the production of opaque “Gini coefficients,” which are difficult for nonspecialists to understand and are often constructed using incomplete measures of income.
This new vintage of inequality statistics will be easier for nonspecialists to interpret, while also offering more comprehensive measures of income. These data build on the pioneering work of Joseph Stiglitz at Columbia University, Amartya Sen at Harvard University, and Jean-Paul Fitoussi at the Institut d’Etudes Politiques de Paris—an expert group at the 38-member-nation Organisation for Economic Co-operation and Development on distributional national accounts—in their “Report by the Commission on the Measurement of Economic Performance and Social Progress,” as well as the many economists who have participated in the WID.world project to create comparable metrics of inequality for a large number of countries.
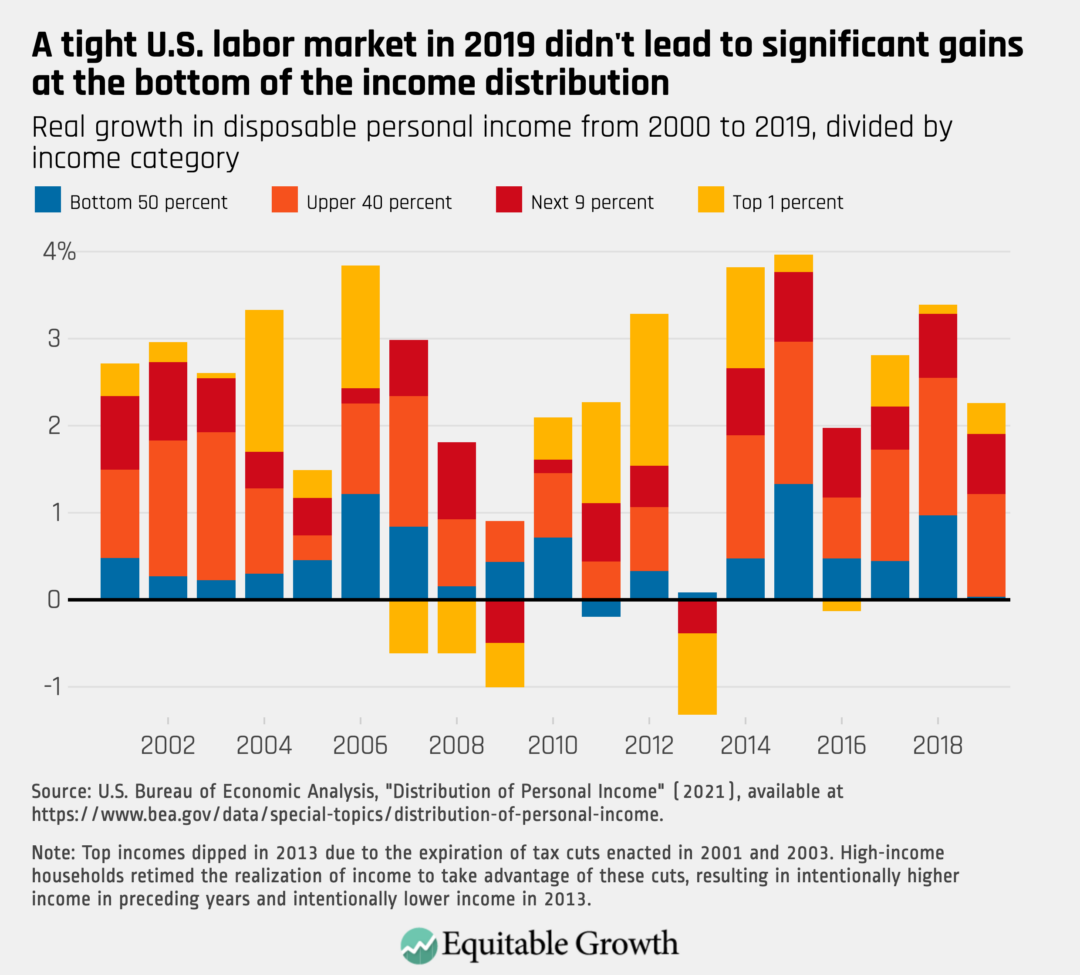
The U.S. version of these statistics, which does not currently offer subannual estimates and is released on a 2-year lag, provides simple answers to questions such as “What share of income is earned by middle-income Americans?” or “What percentage of annual growth accrued to the richest 10 percent of households?” The chart below shows how aggregate economic growth was divided in each year between the lowest-income half of U.S. households, the upper-income 40 percent above that, and the richest 10 percent of households. (See Figure 1.)
Figure 1
A number of other countries are also beginning to produce these statistics, mostly in an experimental capacity. Reducing the amount of lag in the production of these statistics and increasing the frequency of their release is the next frontier in inequality statistics. Statistics Canada’s example could provide a template to produce inequality statistics that provide up-to-date guidance for the public, businesses, and governments to act on.
In this column, I describe how Statistics Canada produced these data and detail some remaining caveats. Notably, Statistics Canada also produces distributional statistics for consumption and wealth, but I focus only on income here.
Overview of datasets and methods used to create Canada’s DHEA
A key advantage Statistics Canada has over the U.S. statistical agencies is that they start with their Social Policy Simulation Database. The SPSD is a high-quality synthetic dataset based on a blend of survey and administrative data that Statistics Canada has maintained in some form since 1990. It is primarily based on four data sources:
These data sources are blended, and disclosure avoidance techniques are applied to ensure privacy.
The SPSD is publicly available and comes packaged with a simulation program that can be used to look at the impacts of various policy options on Canadian households. Analysts can simulate different kinds of tax changes, for example, or changes in levels of social spending using the simulation program.
This database is fairly different from what the U.S. Bureau of Economic Analysis has access to in the United States. There is no current synthetic dataset that blends administrative and survey data that is widely available to agencies and other researchers. This may change soon, as the U.S. Census Bureau is currently working on some large data blending projects, as well as disclosure avoidance strategies that may make blended synthetic data files available.
Nor can BEA start with confidential administrative data, such as IRS tax returns, because the tax code specifically prohibits this sharing. It is a serious flaw in the U.S. tax code that our economic statistical agencies are prohibited access to these data, which would allow them to construct more innovative and ambitious statistical products that could be informative for the public. Consequently, BEA starts with one part of the Census Bureau’s Current Population Survey, the Annual Social and Economic Supplement, which is somewhat comparable to the Canadian Income Survey.
Statistics Canada follows the lead of the OECD expert group on distributional national accounts, as does BEA in the United States. The aggregate income concepts targeted by each agency are a bit different, but both come relatively close to reproducing the System of National Accounts’ definition of disposable income (BEA’s statistics are available for both personal income and disposable personal income).
Because both methods are grounded in the OECD approach, they have some core similarities. Both make some use of a technique called scaling, for example, to ensure that aggregate income in the microdata match aggregate income in the national accounts. This approach has been criticized, but more research is necessary to determine exactly why these aggregates disagree and how to correct for discrepancies. For now, scaling is the best answer we have. Statistics Canada also makes adjustments to the SPSD data to ensure compatibility with System of National Accounts’ income definitions. These include deriving imputed rent estimates and adjustments for tax-sheltered income.
Methods used in the subannual DHEA
Statistics Canada goes beyond any other country in offering subannual distributions. The agency began producing these in response to demand from the public and government officials to better understand the effects of the COVID-19 pandemic. For the most part, the datasets used to create the SPSD are available only at annual frequency, so statisticians had to get a little creative to provide subannual measures.
An easy way to create subannual distributions is to take existing distributions of income in wages, business income, and other income categories and simply apply them to new national accounts aggregates. This can be an inaccurate approach. In this approach, if the first quintile of households by income earned 10 percent of wage income in the previous year, statisticians would simply assume this distribution continues to apply in current-year quarters, but economists know that these distributions change, so this is not generally going to produce very accurate results.
If agencies want to construct accurate subannual estimates of household income, then it is important for them to try to redistribute at least some income sources on a subannual basis. In other words, they must find a data source that can be used to make a new estimate of how some sources of income are spread across the income distribution. As I have previously explained, the vast majority of income for the lower 90 percent of households comes from wages and government transfers. So, these are the most important categories of income to redistribute.
Statistics Canada’s solution is very close to the one adopted by the website Realtime Inequality. Realtime Inequality is a project from University of California, Berkeley economists Thomas Blanchet, Gabriel Zucman, and Emmanuel Saez that reports distributional measures of growth in the United States on a quarterly cadence. Both Statistics Canada and Realtime Inequality redistribute government transfers using rules-based simulation. That is, they look at known data on households, such as income, household size and composition, and other relevant information, and use those criteria to determine whether or not the household is eligible for government transfers, such as the stimulus checks issued by the U.S. government during the pandemic.
For wages, another data source is necessary. Statistics Canada uses the monthly Canadian Labour Force Survey. This survey asks respondents a number of questions about employment status and earnings from employment. Statistics Canada uses the responses to these questions to simulate the number of weeks worked and wages for individuals each quarter.
Additionally, the Labour Force Survey asks questions about respondents’ business income. This allows Statistics Canada to redistribute that category of income as well. Unfortunately, in the United States, there are no similar sources of high-frequency business income data to draw on.
Realtime Inequality distributes wages using the Quarterly Census of Employment and Wages. The QCEW does not provide disaggregated data on the wages of particular employees, but it does report out the total money spent on wages in highly disaggregated cells. Pioneering work by Byoungchan Lee of the Hong Kong University of Science and Technology demonstrates that the QCEW can be used to proxy for the distribution of income.
For other sources of income, among them interest and dividends, both Statistics Canada and Realtime Inequality use old, known distributions mapped onto current quarter aggregates. These sources of income account for relatively small percentages of household income outside the top 10 percent of households, making them less important as contributors to inequality.
Implications for the methods of disaggregating U.S. economic data
One significant caveat is necessary. To date, Statistics Canada has not released a public analysis of the accuracy of their method. Subannual estimation of inequality necessarily relies on a modeling approach that may make these estimates less accurate. So-called nowcasting techniques, such as the one described above, require revisions when more accurate annual data are released.
Until that analysis is released, some caution is warranted. The Realtime Inequality website, which uses a similar approach to nowcasting, has shown that the approach can be relatively accurate. In their methods paper, the creators of Realtime Inequality show that they only rarely make errors in the direction of growth. That is, they very rarely find that income for a particular income group—say, the bottom 50 percent—is shrinking when it is, in fact, growing. This is an encouraging sign for the methodology, but more error analysis is necessary.
Statistics Canada may have some advantages that are unavailable to the U.S. Bureau of Economic Analysis. Canada’s Social Policy Simulation Database provides blended administrative and survey data to use as a base for the statistics. The U.S. Bureau of Economic Analysis has no similar starting point and begins instead with the Annual Social and Economic Supplement to the Current Population Survey. The Realtime Inequality team starts with IRS tax data. It is not entirely clear how these differing data sources affect accuracy. More work is necessary to better understand why all these data sources fall short of national income aggregates.
In short, considerable research is still necessary. In 2021, BEA issued a report on the feasibility of creating quarterly distributions. At the time, no one had demonstrated a working prototype of quarterly reporting using current distributions of government transfers and earnings. BEA did not investigate the possibility of using the QCEW data or another dataset to make those redistributions.
In light of continued interest from policymakers and proof of concept from both Realtime Inequality and Statistics Canada, it would be appropriate for BEA to revisit this decision. A prototype dataset blending existing BEA data with QCEW data would provide an opportunity to test the accuracy of more timely predictions and decide whether they meet the necessary standards of national statistical reporting.
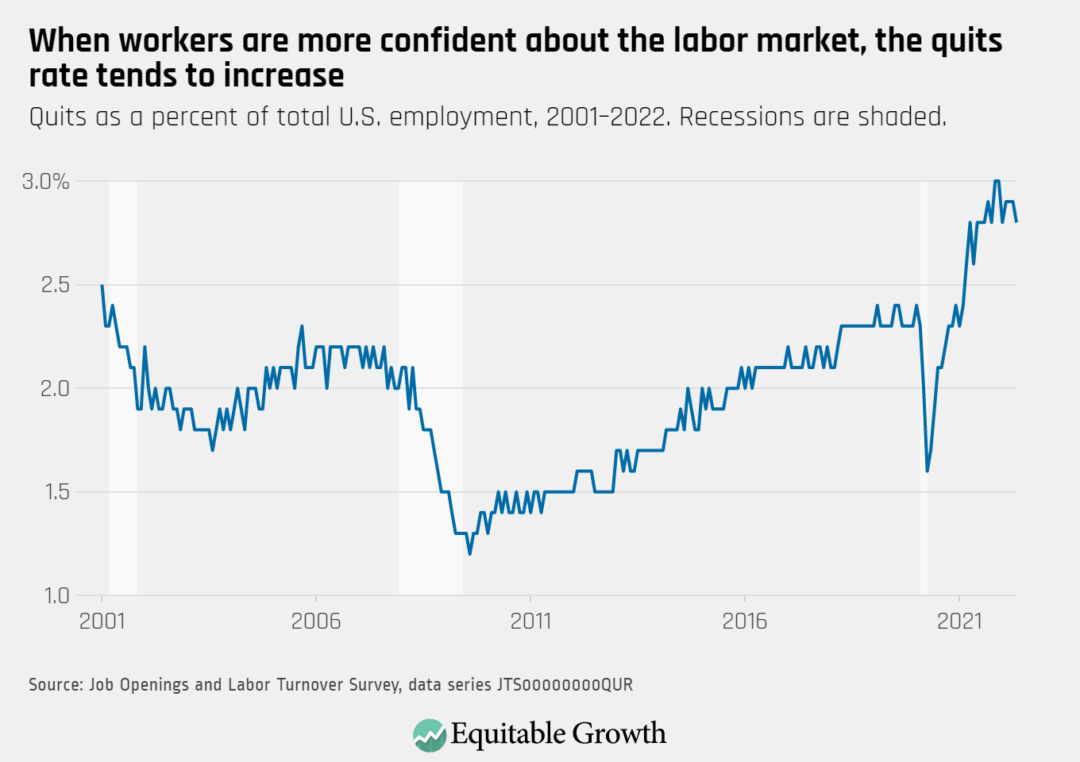
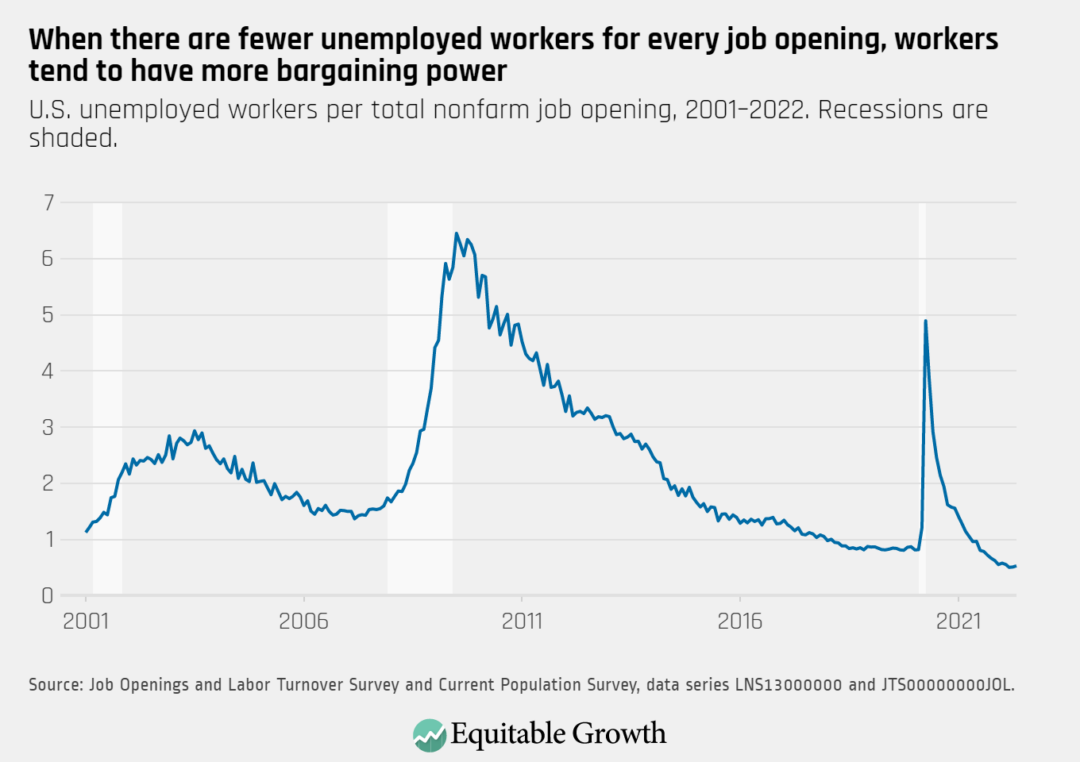
Every month the U.S. Bureau of Labor Statistics releases data on hiring, firing, and other labor market flows from the Job Openings and Labor Turnover Survey, better known as JOLTS. Today, the BLS released the latest data for May 2022. This report doesn’t get as much attention as the monthly Employment Situation Report, but it contains useful information about the state of the U.S. labor market. Below are a few key graphs using data from the report.
Quits have tempered from their recovery peak, declining slightly to 2.8 percent in May, but remain well above pre-pandemic levels.
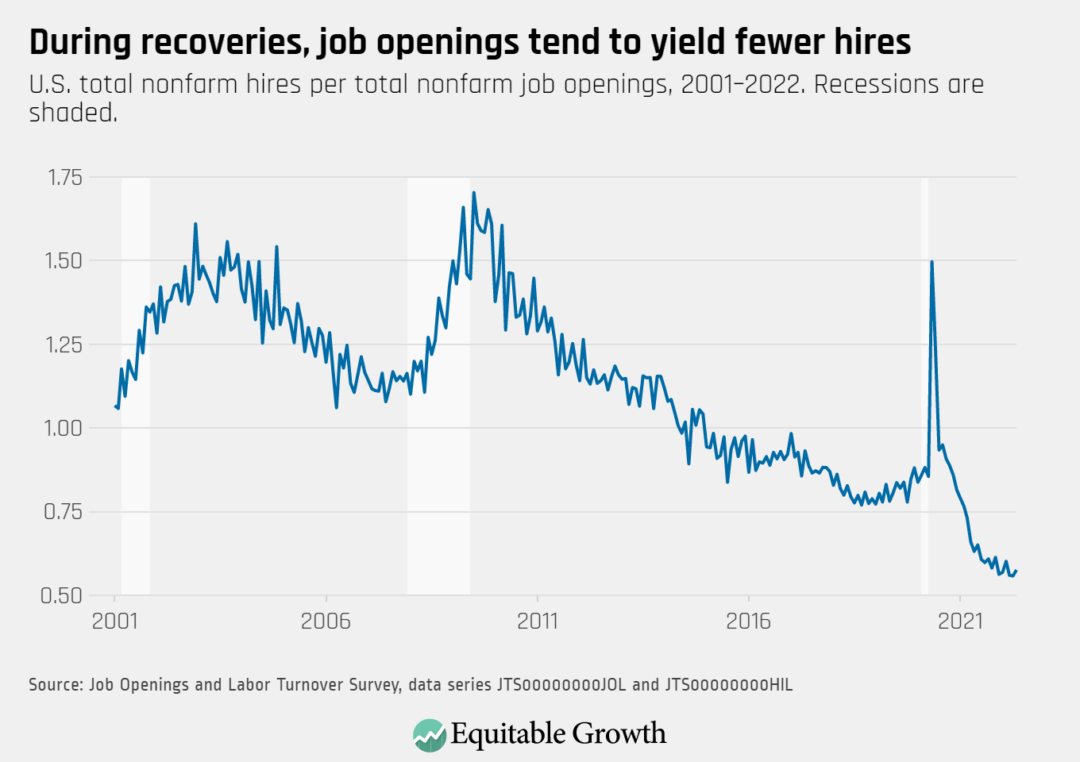
Job openings decreased to 11.3 million in May as total hires remained at 6.5 million over the month.
The ratio of unemployed workers-to-job openings increased slightly to 0.53 in May, potentially signifying a plateau of this rate following a rapid tightening of the labor market in the recovery.
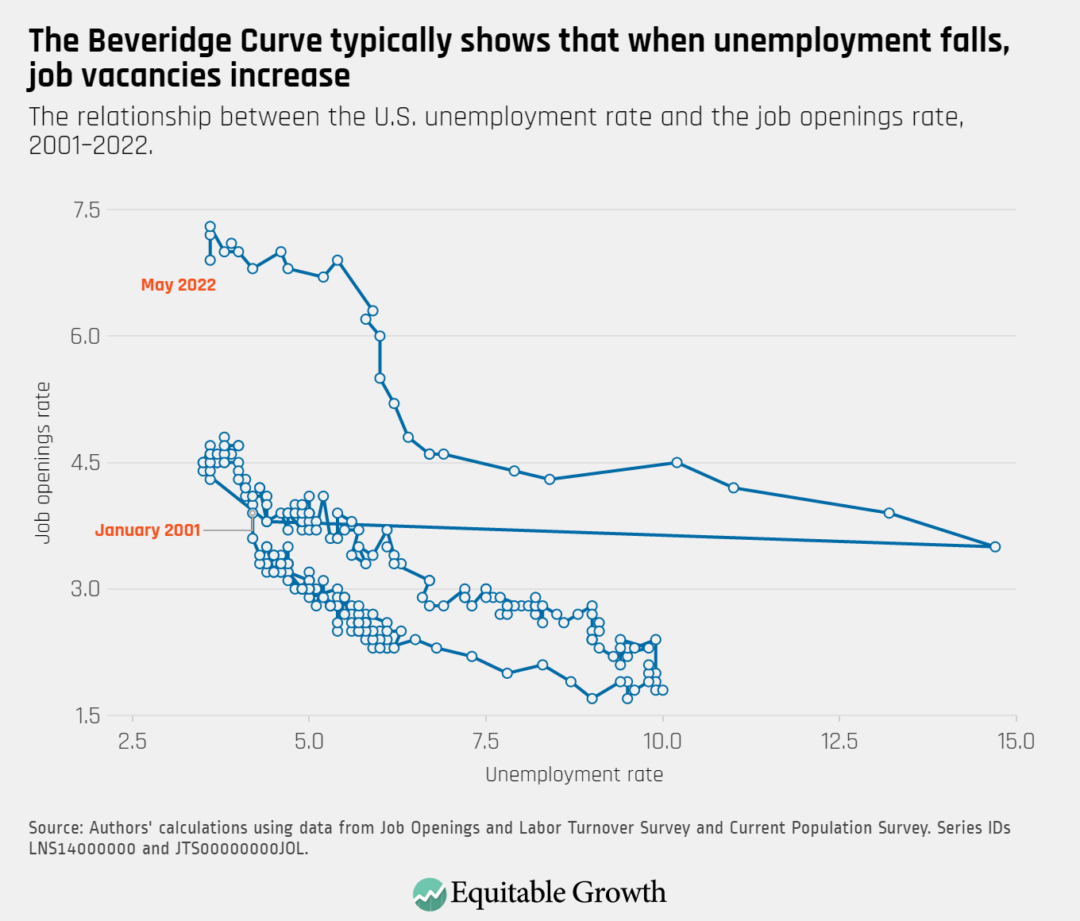
The Beveridge Curve moved downward in May as openings declined and unemployment remained steady, but remains outside its typical cyclical range.
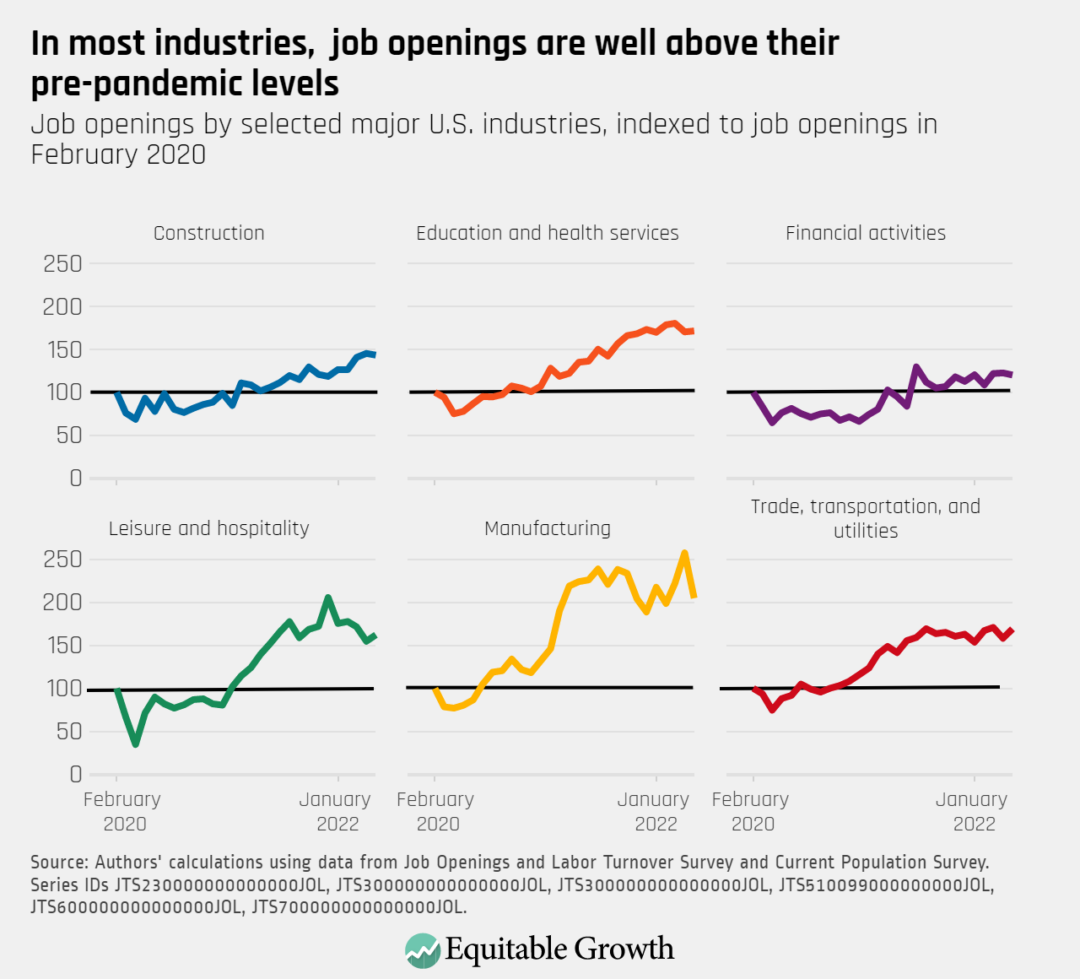
Job openings remain above pre-pandemic levels in most sectors, but openings decreased significantly in manufacturing in May.
For those U.S. workers fortunate enough to have access to it, paid sick leave is a vital tool for protecting both the public’s health and their own economic stability when an illness strikes. Under most sick leave policies, including those voluntarily provided by employers, workers accrue paid time off as they work—typically 1 hour of sick leave for every 30 hours worked—which they can use to cover short periods away from their jobs if they or a loved one falls ill.
Without this benefit, many workers are forced to choose between going into work sick, leaving their loved ones who are in need of assistance alone, or forgoing a necessary paycheck to recover safely at home. Unfortunately, millions of U.S. workers must face these difficult choices regularly. Unlike workers in nearly all economically comparable nations, U.S. workers have no national guaranteed sick leave.
The United States’ patchwork approach to paid sick leave—made up of state or city mandates, as well as those employers that voluntarily provide this benefit—is increasingly inconsistent with a growing body of literature on the relatively low costs of providing such leave, and the high public health and economic benefits of doing so, including my new working paper on one overlooked perk of this benefit: reduced job turnover for small businesses.
Below, I detail my research findings and the implications for paid sick leave policy in the United States. First, though, let’s turn to the proven health benefits of sick leave for both workers and the public.
Paid sick leave protects workers’ health and the public
Workers without sick leave, many of whom earn low wages, are 1.5 times more likely to go to work while sick. They also are more likely to report receiving threats from their employers for leaving work when sick and have higher levels of psychological distress, relative to workers who can take paid sick leave when they need it. Policies that guarantee access to this workplace benefit can alleviate these challenges and others. Research shows that access to paid sick leave is linked to lower rates of absenteeism and lower levels of psychological distress and occupational injury.
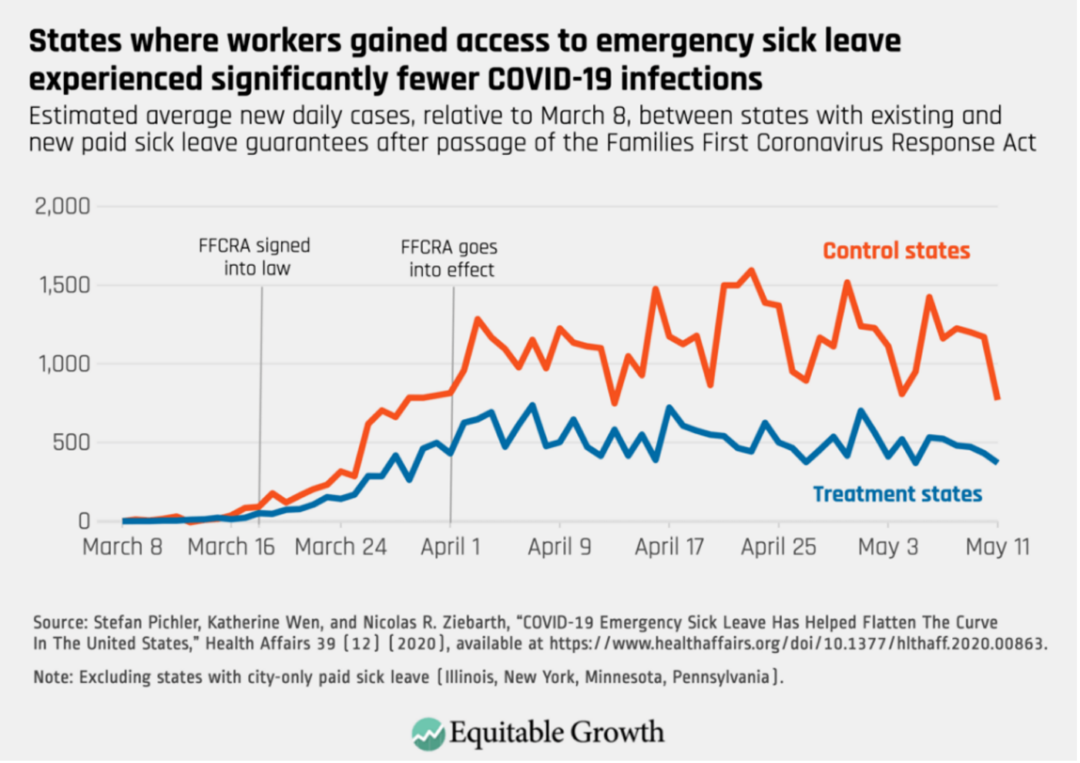
Moreover, sick leave policies protect the public’s health. Research shows reductions in the transmission of influenza-like illness following the implementation of paid sick laws. During the early phase of the COVID-19 pandemic, for example, access to emergency sick leave through the federal Families First Coronavirus Response Act was associated with a significant reduction in COVID cases in states that previously did not have a sick leave guarantee. (See Figure 1.)
Figure 1
Paid sick leave policies benefit employers and employees alike by reducing turnover
In addition to the public health benefits associated with paid sick leave, these programs also have economic benefits both for workers and their employers by reducing job turnover, which can be costly to both firms and workers. A recent study by the University of California, Santa Barbara’s Pete Kuhn and Lizi Yu of the University of Queensland shows employers face many expenses associated with employee turnover, such as the recruitment and training of new employees, short staffing, and low employee morale surrounding departures—all of which affect a firm’s productivity. For workers, job loss or churning through jobs is linked to adverse health outcomes, economic insecurity, income volatility, and, for working parents, adverse behavioral outcomes among their children.
My recent working paper builds on the literature of job turnover, as well as the research on paid sick days. I examine a paid sick leave policy implemented in Seattle in 2012 to determine its impact on workers’ job turnover. While there is considerable research on paid sick leave policies and employment or earnings levels, there have been relatively few studies that look at the effects of local laws on turnover.
I find that Seattle’s paid sick leave policy reduced job turnover by 4.7 percent for workers earning low wages in small firms mandated to comply with the law. Critically, these reductions in job turnover were not accompanied by losses in employment or earnings, suggesting that employers did not pass the costs of the policy down to their workers in the form of earnings reductions or job losses.
Including small businesses in paid sick leave policies is an effective way to expand access and reduce turnover costs
While I find that Seattle’s ordinance led to modest declines in turnover for workers earning low wages at small firms, I also show that the broader local labor market was unaffected, positively or negatively, by the ordinance. The reductions in turnover were concentrated among low-wage jobs in small firms because these workers were less likely to have access to paid sick leave prior to the policy’s implementation—highlighting the importance of targeting public policies toward businesses less likely to provide such fringe benefits.
Small firms are less likely to offer paid sick leave relative to large firms, in part due to employer concerns that the benefit may be too costly. Policymakers, in turn, often exempt small employers from these policies, severely limiting the intended impact of the policy change. This leaves low-wage workers at small firms unprotected, as they often lack the savings, assets, or access to credit required to buffer against earnings losses from missed work.
Yet research shows that small businesses are increasingly supportive of paid leave policies. A new working paper by Ann Bartel at Columbia University’s Graduate School of Business and her co-authors finds that support for paid leave among small firms with fewer than 100 employees has grown during the pandemic. Their research documents that nearly 71 percent of small businesses supported paid sick leave policies in the fall of 2020, compared to just below 62 percent in the fall of 2019.
In my own work, too, I find that by reducing job turnover, paid sick leave could save these small employers money. My back-of-the-envelope calculations show that Seattle’s sick leave policy has the potential to save employers roughly $2,300 per year in turnover costs, while prior research shows the costs of implementing these programs are minimal. Small firms thus need not worry too much about the added costs and should instead focus their attention on the savings they will reap through reductions in turnover and employing a healthier workforce.
Other research corroborates the minimal negative impact of paid sick leave on employment and earnings across the broader U.S. economy. Evidence from survey and administrative data, for instance, finds that city- and state-level paid sick leave policies—which includes Seattle’s sick leave policy—had minimal effects at all on aggregate employment and earnings in the affected geographies.
Conclusion
My latest research joins a growing body of literature showing that there is a better way to support sick workers and their employers than the nation’s current patchwork system. As policymakers at the local, state, and federal levels look to strengthen their economies amid the ongoing COVID-19 pandemic—and guard against the next public health crisis—they should consider paid sick leave guarantees as a low-cost, high-reward policy proven to protect workers’ economic security and health of the public, as well as the broader U.S. economy.
President Joe Biden, in November 2021, signed the Infrastructure Investment and Jobs Act into law, providing $1.2 trillion in new government investments to create millions of jobs, increase U.S. economic competitiveness abroad, and help address the climate crisis. The multiple provisions of the law are now or will soon:
Create hundreds of thousands of jobswithin the transportation sector, with investments in passenger and freight rail, bridges, roads, airports, ports, and public transit
Guarantee safe drinking water by eliminating the nation’s lead-tainted service lines, especially in disadvantaged communities that need refurbishing the most
Reduce supply chain bottlenecks to help ease inflation and lower the cost of goods and services
Build a national network for electric vehicle charging stations
Manufacture solar panels, wind farms, batteries, and electric vehicles to help address climate change
Make high-speed internet affordable and accessible
These much-needed investments are not only delivering significant macroeconomic benefits now, and will continue to do so well into the future, but also potentially addressing longstanding economic inequalities. Indeed, the new infrastructure investments and the jobs created by these investments can reduce these inequalities, increase unionization, and address climate change because they rest on sound economic principles.
In this issue brief, we demonstrate why the Infrastructure Investment and Jobs Act of 2021 and its focus on equitable growth is good economics. First, we outline the ways in which the law helps to address urgent needs currently facing the United States. Next, we discuss how the law’s focus on equity, unionization, and climate are crucial for a healthy economy with strong, stable, and broadly shared growth. We conclude by discussing the impact the law can have on addressing inequalities in our economy and share recommendations for a path forward.
The Infrastructure Investment and Jobs Act addresses urgent needs
The passage of this law in November 2021 signaled a commitment by the federal government to reinvigorate physical infrastructure in the United States. The bulk of the investments are going toward roads and bridges, power systems, railways, broadband, water systems, and public transit. The deterioration of the nation’s physical infrastructure is well-documented. Following World War II, the United States made public investments to build an interstate highway system, airports, a network of waterworks, and expanded port facilities and other infrastructure that significantly boosted the country’s economic output. Much of this infrastructure is now in critical need of repair.
Take roads, for example. According to the latest research from the American Society of Civil Engineers, almost half of U.S. roads are in poor or mediocre condition due to wear and tear. Research indicates this deterioration costs motorists nearly $130 billion each year in extra vehicle repairs and operating costs.
Water infrastructure is another example of an area badly needing investment. Neglected and old water infrastructure poses a serious public health risk, with some estimates showing that up to 10 million U.S. households and 400,000 schools and child care centers lack safe drinking water. This lack of clean drinking water disproportionately affects Black, Latino, and Indigenous individuals.
In addition to improving older infrastructure, expanding infrastructure such as broadband is imperative. Some estimates indicate that 30 million people in the United States live in areas where broadband infrastructure is inadequate. According to the latest data from the Organisation for Economic Co-operation and Development, the United States has the second-highest broadband costs among the 35 developed OECD countries studied.
Disparities in access to quality broadband infrastructure are pronounced. Research by the U.S. Department of Housing and Urban Development finds a strong association between household income and in-home connectivity—a pattern that persists across both rural and urban communities. The study finds that, overall, two-thirds of U.S. adults ages 18 and older had access to broadband internet in their homes, but just 41 percent of adults with household incomes of less than $20,000 had access, while 90 percent of adults with household incomes higher than $100,000 had access.
Moreover, a report by Dominique Harrison of the Joint Center for Political and Economic Studies finds that in rural counties in the Southern region of the country with populations that are at least 35 percent Black, 38 percent of Black residents in these areas lack home internet access. This is nearly double the rate of White residents in the same counties. The consequences of not having internet access are severe. Students need broadband to access the internet to do homework and apply to colleges. Working families need it to apply for jobs and to more easily access various government services, and seniors are increasingly reliant on broadband accessibility to connect to the growing world of telehealth.
There are macroeconomic benefits to the new investments happening or starting to happen because of the Infrastructure Investment and Jobs Act as well. Investments in infrastructure generally tend to yield a high rate of return, meaning increases in public investments in infrastructure significantly result in increased output and productivity. It is well-documented that infrastructure investments have large multipliers—that is, a proportionally higher increase in Gross Domestic Product for every dollar increase in investment—with infrastructure spending having substantially higher multipliers than other fiscal interventions, such as tax cuts.
In particular, Mark Zandi and Bernard Yaros of Moody’s Analytics write that at the apex of economic growth generated by the new infrastructure investments in 2023, real GDP is forecast to increase 2.9 percent, compared to 2.3 percent if only the American Rescue Plan (which was passed in March 2021) had been passed into law. Zandi and Yaros also project that in the long term, the U.S. economy receives a bump in productivity growth due to the increase in the stock of public infrastructure. Recent projections made by the Congressional Budget Office, which take the Infrastructure Investment and Jobs Act into account, suggest productivity will increase 1.5 percent on average over the next decade.
The Infrastructure Investment and Jobs Act also encompasses the important need to address economic inequity, unionization, and climate in any large job-creation efforts in the United States. Each of these issues cannot be easily separated from one another. In fact, these components frequently intersect, forming a matrix that provides a more comprehensive picture of economic growth and well-being. We next examine why these components matter and how they contribute to building an economy with broadly shared growth.
Economic equity, unionization, and climate
The investments that the Infrastructure Investment and Jobs Act makes to reduce economic inequalities, increase unionization, and address climate change rest on sound economic principles. We outline some of the ways the law addresses these three pillars and examine how these pillars are important for promoting strong, broadly shared economic growth.
One of the ways the law helps to ameliorate inequalities in the U.S. labor market is by mandating that the “overwhelming majority” of the funds will be subject to Davis-Bacon requirements. These requirements ensure that contractors pay workers on construction projects—in which the new funding makes major investments—a prevailing wage, so that local wages, labor markets, and workers won’t be undercut. While there are limitations to this approach, as we discuss below, it is nevertheless one tool to raise the wage floor and, similar to minimum wage increases, can address gender and racial inequalities and wage divides.
These public investments also focus on tackling climate change, such as $7.5 billion in investments to build out a national network of electric vehicle chargers in the United States. These kinds of investments will result in the creation of green manufacturing jobs. As one of the co-authors of this issue brief testified before the Joint Economic Committee, economic research demonstrates the importance of investments in green energy.
For instance, Columbia University economist Joseph Stiglitz, alongside other colleagues, argues that renewable energy and energy efficiency investments typically have high multipliers, delivering even greater returns over time. They also tend to create more jobs, compared to fossil fuel investments, including ones that can’t be taken offshore, such as those in home energy retrofitting. Further, recent research from Ioana Marinescu of University of Pennsylvania and E. Mark Curtis of Wake Forest University suggests there is a pay premium for green jobs, especially for green jobs with a low educational requirement.
Moreover, according to recent research from Heidi Garrett-Peltier, an economist at the University of Massachusetts Amherst, for every $1 million invested in renewable energy or energy efficiency, almost three times as many jobs are created than if the same money were invested in fossil fuels. Investing more money in the fossil fuel industry will not address high and growing unemployment rates. Indeed, the Federal Reserve is not even requiring companies to keep workers as a condition for getting loans in the fossil fuel industry.
Leah Stokes and Matto Mildenberger, both assistant professors of political science at the University of California, Santa Barbara, highlight that many U.S. unions maintain strong ties to carbon-intensive industries, such as auto manufacturing or heavy industry. By contrast, many jobs in the clean energy sector—from clean energy deployment to electric vehicle manufacturing—remain nonunionized.
In part, this pattern reflects the decline in union participation across new U.S. industrial sectors. In order to address labor market disparities—such as gender andracial wage divides—government funding for clean energy projects should prioritize unionized jobs. Indeed, with funds dedicated to infrastructure projects that can help create unionized jobs, the 2021 infrastructure investment law takes a step in the right direction to increasing worker bargaining power.
The benefits of prioritizing unionized jobs for creating broadly shared growth cannot be understated. Unions are shown to have an inverse relationship with income inequality. Moreover, while union members have higher wages than their nonunionized peers—what researchers call the union wage premium—organized labor may create conditions that make all workers better-off. Strong unions are able to set job-quality standards that nonunion businesses have to meet in order to compete for workers, which is known as the spillover effect.
Unions play an important role in addressing racial inequality. Even though the majority of union members were White and male during the height of the U.S. labor movement in the mid-20th century, organized labor strongly supported redistributive public policies that contributed to narrowing racial and gender pay gaps. Research shows, for example, not only that there is a larger union wage premium for Black workers, but also that unions reduce racial animosity among workers.
There are other ways these new investments address racial equity. In addition to investments in both water and broadband infrastructures discussed above, there are investments to clean up Superfund sites, which are contaminated sites caused by hazardous waste being dumped, left out in the open, or otherwise improperly managed. These sites include manufacturing facilities, processing plants, landfills, and mining sites. Investments in cleanup efforts will benefit Black and Hispanic communities, which, compared to predominantly White communities, are located disproportionately within 3 miles of a Superfund site.
Or consider the hundreds of thousands of new jobs that will be created over the course of a decade, alongside the quality—not just the quantity—of those jobs. Research by Kate Bahn of the Washington Center for Equitable Growth and Mark Stelzner of Connecticut College shows that characteristics specific to race and gender, such as the lower levels of wealth in Black and Latino households and increased household responsibilities for women, make workers of color and women more susceptible to exploitation by employers, with Black women and Latina workers facing both race and gender penalties and thus being exploited even further.
These hurdles reduce worker power by restricting workers’ ability to seek other, better-paying, and more interesting jobs, which gives employers more power to reduce wages for these particular groups of workers. Research conducted by one of the co-authors of this issue brief demonstrates that Black women experience a “double gap,” which is the reinforcing confluence of the gender wage gap and the racial wage gap. The double gap helps to explain why Black women workers earn the least in wages, on average, compared to their working counterparts among White men, White women, and Black men. The double gap costs Black women workers approximately $50 billion in involuntarily forfeited earnings—a large and recurring annual loss to the Black community.
For decades, the prevailing wisdom in policymaking circles was that there is a trade-off between equity and economic growth. This conventional belief argues that reducing economic inequality would require such heavy-handed interference in markets that growth would be stifled. Yet there is mounting evidence that suggests otherwise. For the past near-half century, economic inequality has risen in income and wealth, yet the U.S. economy has not experienced stronger or more sustained economic growth. Advancing economic policies that seek to redress these structural inequalities will benefit all U.S. workers and their families and help promote an economy with strong, stable, and broadly shared growth. Failing to address these inequalities leaves our whole economy vulnerable.
Robert Lynch of Washington College finds that closing racial and gender disparities would have resulted in an increase in U.S. GDP of $7.2 trillion in 2019. According to Lynch, GDP could have totaled $28.6 trillion instead of $21.4 trillion that year. Lynch also finds that federal, state, and local tax revenues would have been $1.82 trillion higher in 2019, while the overall U.S. poverty rate would have dropped from 10.5 percent to 6.6 percent, lifting 12.2 million people out of poverty. What’s more, there would have been a $429 billion improvement in the finances of the U.S. Social Security system in 2019.
Remaining questions and recommendations
The Infrastructure Investment and Jobs Act of 2021 is a historic piece of legislation that makes much-needed investments in traditional infrastructure, yet many of these investments in traditional infrastructure will create jobs in industries traditionally dominated by men. Questions remain about how to ensure the jobs created by this law are equitably distributed and do not leave women, including women of color, at the margins of the U.S. economy yet again.
Black women, for example, experience significant occupational segregation, with five occupations accounting for more than half of all the jobs in which Black women work. This is consistent with a large body of economic literature that shows women, including Black women, tend to be crowded primarily in low-wage occupations. These occupations, in fact, are often low wage precisely because of their association with Black women, especially compared to other occupations that may require similar levels of training or skills but are dominated by White male workers.
Indeed, there exists an overrepresentation of Black women in certain industries and occupations—often in care and service sectors— resulting from myriad factors, including the systemic devaluation of certain kinds of work, discrimination, and uneven occupational integration. In general, the overwhelming majority of domestic workers are women. More than half of domestic workers are Black, Latina, or Asian American and Pacific Islander women, with some studies finding that more than 90 percent of domestic workers are women of color.
Significant questions remain about how the jobs created by the Infrastructure Investments and Jobs Act will be equitably distributed and targeted, given significant levels of occupational segregation within the U.S. economy. It will therefore be imperative to improve pathways for people underrepresented in infrastructure jobs to be able to obtain these jobs, such as creating pathways for women to have construction jobs. Another way forward is by making investments in social infrastructure, such as the care economy, which remains key to overcoming the endemic economic divides across race, gender, and income.
Questions also remain regarding how investments are incorporated into transportation infrastructure more equitably. It’s not clear, for example, how these new investments in transportation infrastructure will affect equitable access to transportation and how increases or decreases in transportation equity will affect growth, since the economic consequences of inequitable transportation options are often borne by low-income people, who are disproportionately people of color. To better understand this question, we need better measurement.
With the significant investments in transportation, it will be important to ensure that inequities in transportation are addressed. These inequities include “transportation insecurity,” a term coined by Alix Gould-Werth of the Washington Center for Equitable Growth, Jamie Griffin of the University of Michigan, and Alexandra Murphy of the University of Michigan, which describes the condition of being unable to regularly move from place to place in a safe or timely manner because of a lack of resources necessary for transportation.
A diagnosis of problems surrounding transportation are only as good as the tools to measure it. In this vein, the U.S. Department of Transportation could adopt the Transportation Security Index, which was also created by the aforementioned scholars. The Transportation Security Index, which is modeled after the Food Security Index, is composed of items that ask respondents about symptoms of transportation insecurity, such as taking a long time to plan out everyday trips, feeling stuck at home, or worrying about burdening others with requests for assistance with transportation. As such, it is an important tool that can be used to determine whether people can get to where they need to go in a safe or timely manner and evaluate interventions that are designed to strengthen the U.S. economy by moving people from a state of transportation insecurity to one of security.
Moreover, while the prioritization of union jobs in the Infrastructure Investment and Jobs Act is an important first step, there are still significant actions worth considering. Current challenges to unionization, such as rulings by the U.S. Supreme Court that have limited the ability of public-sector unions to collect dues, as well as made it more difficult for workers overall to band together and sue their employers for workplace misconduct, calls for new advocacy efforts for legislative remedies to enable more effective unionization.
One such example is the Clean Slate Agenda, which was developed by Sharon Block and Benjamin Sachs of Harvard Law School. They created a series of proposals for structural legal changes that would protect workers and give them the ability to countervail employers’ power. Their recommendations include:
Sectoral collective bargaining that enables unions to negotiate with industries rather than individual firms, increasing organized labor’s power to lift wages, set industrywide standards, and reach agreements that benefit a greater number of workers
Laws that expand and protect workers’ right to engage in collective action, including the creation of funds that allow workers to engage in strikes or walkouts without jeopardizing their financial security
An inclusive labor law reform that places the need to address gender, racial, and ethnic inequalities at its center by extending protections to domestic, incarcerated, and undocumented workers, as well as expanding rights and protections for independent contractors
Other proposals include the creation of labor market institutions, such as wage boards, which set minimum pay standards by industry and occupation and lead to wage gains for those at the bottom and middle of the income distribution. Enacting the PRO Act, which would make it easier for workers to organize into unions, would also curtail employers’ ability to misclassify workers as independent contractors, who do not have the right to unionize under federal U.S. law.
These measures would expand workers’ rights and allow unions to balance power in the labor market, ensuring that the economic gains they create are broadly shared.
Conclusion
The Infrastructure Investment and Jobs Act of 2021 is a major piece of legislation that rests on sound economic principles to help the U.S. economy reach its full potential. By placing greater focus on equity, unionization, and climate, the law and its swath of new investments are a step in the right direction. Yet to achieve strong, stable, and broadly shared growth, further investments and policies, such as those outlined above, are needed.
—Michelle Holder is the president and CEO of the Washington center for Equitable Growth. Shaun Harrison is her research assistant.
The evidence across academic and research disciplines overwhelmingly indicates that disaggregated data help build a more detailed narrative about the varying economic experiences of the U.S. population. While great strides have been made to disaggregate federal data by race, ethnicity, gender, income groups, and other categories, one group has long been excluded: the LGBTQ+ community.
Yet new data from the U.S. Census Bureau’s Household Pulse Survey now make it possible to look at a wider range of issues that the LGBTQ+ community faces amid the ongoing COVID-19 pandemic. The Household Pulse Survey began in April 2020 to monitor the impact of the pandemic and ensuing recession on U.S. households in real time, but it wasn’t until July 2021 that the survey began collecting data on sexual orientation and gender identity, or SOGI. These questions allow for further data disaggregation and a clearer understanding of how the LGBTQ+ community is weathering the pandemic.
This is the first time a federal statistical agency has collected data on an inclusive LGBTQ+ community. While the decennial census asks respondents how they are related to the people living in their residence and reports on same-sex households, this doesn’t fully capture the experiences of the entire LGBTQ+ community. Similarly, in 2019, the Federal Reserve Survey of Household Economic Decisionmaking, or SHED, asked questions on sexual orientation and gender identity, but in 2020, supplemental SHED surveys omitted these questions.
This column takes a deeper look at the SOGI data presented in the Household Pulse Surveys over the past year and discusses the economic hardships and resiliency of the LGBTQ+ community in the United States, including discrepancies in job losses, housing stability, and health insurance coverage.
Discrepancies in job losses for LGBTQ+ workers
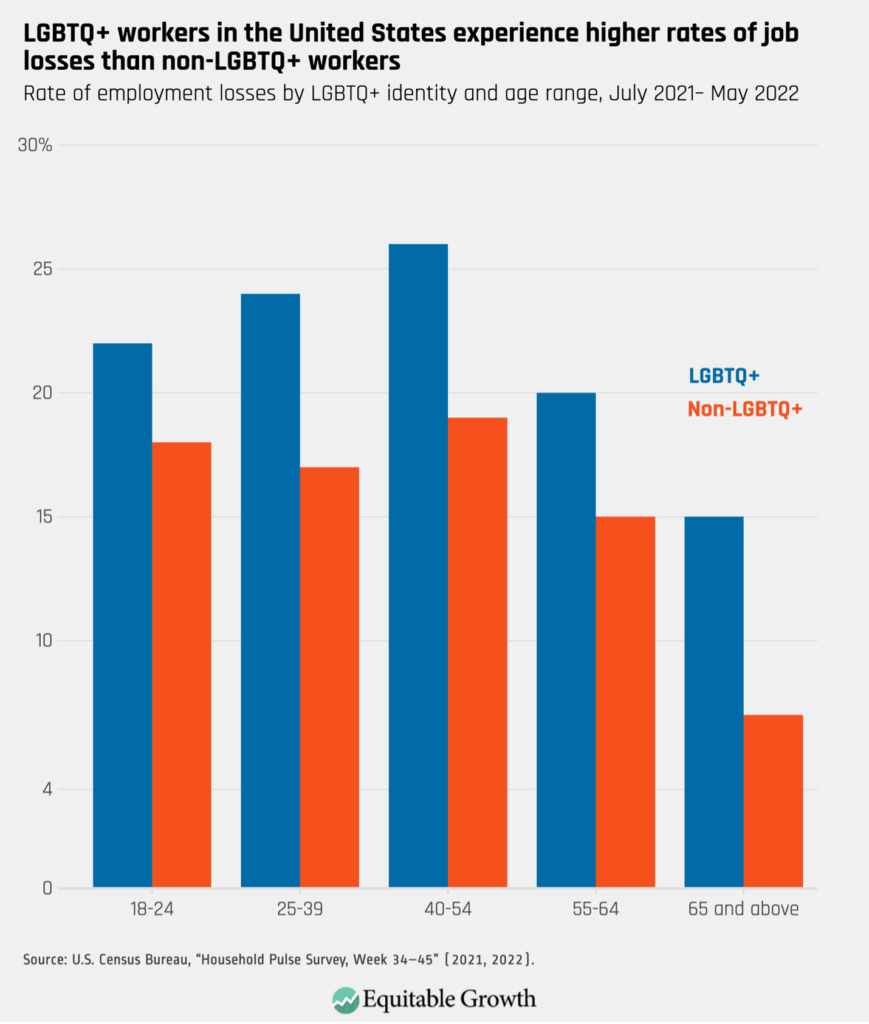
While the pandemic impacts U.S. workers across all demographic groups, the Household Pulse data indicate that LGBTQ+ workers are disproportionately affected, compared to non-LGBTQ+ individuals. Approximately 28 percent of LGBTQ+ respondents said they experienced some form of job loss since LGBTQ+ data collection began last July. Comparably, 18 percent of non-LGBTQ+ respondents reported job loss in the same time frame.
The data indicate that age plays an intersecting role in work-loss experience. LGBTQ+ respondents between the ages of 25 and 39 and 40 and 54 had the highest rates of job losses, while older, non-LGBTQ+ respondents had the lowest rates. (See Figure 1.)
Figure 1
These data are further validated by research from the Movement Advancement Project, which shows that LGBTQ+ individuals with additional demographic intersectionalities face greater rates of job loss. Black and Latinx LGBTQ+ households in the United States experienced higher rates of employment or wage loss, at 60 percent and 71 percent, respectively, between July 2020 and August 2020, compared to non-LGBTQ+ households of all races (45 percent).
While the onset of the COVID-19 pandemic played a significant role in increasing unemployment and decreasing incomes among LGBTQ+ workers, these disparities have been building in recent decades in the United States. Research from 2021, for instance, finds that the lesbian wage premium fell from around 10 percent in 2000 to almost zero in 2018. The Center for LGBTQ+ Economic Advancement and Research, or CLEAR, finds that in 2019, 31 percent of Black LGBT households and 24 percent of Latinx LGBT households reported earning less than $25,000 annually, compared to 24 percent of Black non-LGBT households and 15 percent of Latinx non-LGBT households.
Disparities in employment loss between LGBTQ+ and non-LGBTQ+ workers may also be driven by a large share of LGBTQ+ individuals being employed in industries hardest hit by the pandemic. Analysis by the Human Rights Campaign Foundation, for instance, finds that in 2018, the five industries with the greatest share of LGBTQ+ employees were restaurant and food services (15 percent of LGBTQ+ adults), hospitals and healthcare (7.5 percent), K–12 education (7 percent), colleges and universities (7 percent), and retail (4 percent). These five industries have experienced the greatest disruptions in employment since the onset of the pandemic, which comes on top of the already-low wages widely experienced in three of these industries—hospitality, retail, and K–12 education.
Housing affordability among the LGBTQ+ community
Access to affordable and stable housing has historically affected the LGBTQ+ community, especially LGBTQ+ youth. LGBTQ+ youth make up around 40 percent of all homeless youths, and around 80 percent of young homeless LGBTQ+ individuals say that their homelessness is a result of being forced out of their family homes or running away from their families.
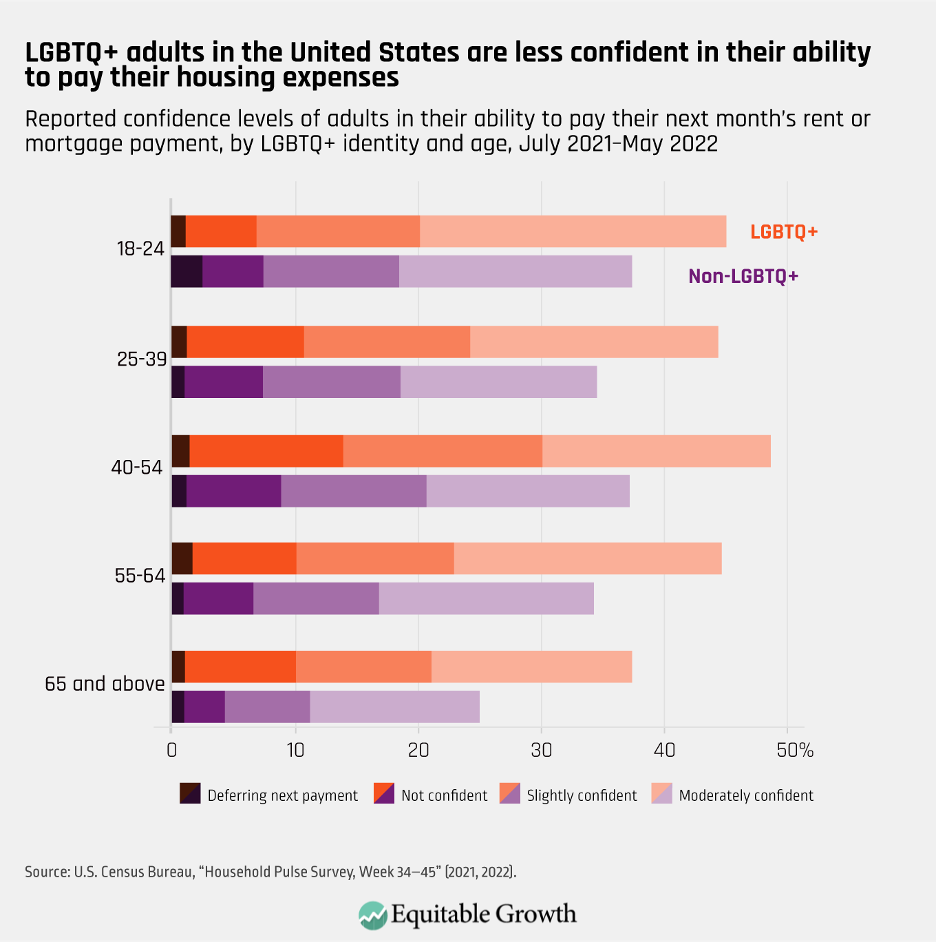
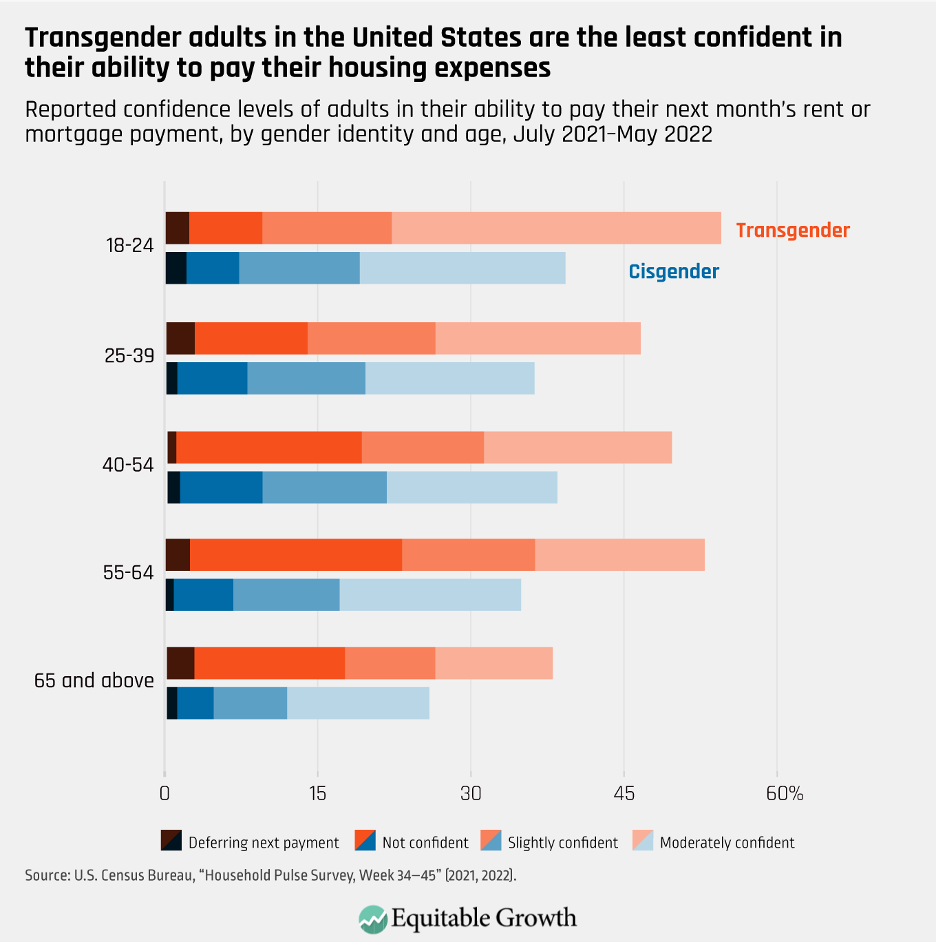
While the Household Pulse Survey does not ask about youth homelessness explicitly, it does collect data on housing affordability of adult respondents. Results show that LGBTQ+ adults of all ages were less confident than non-LGBTQ+ adults in their ability to pay their next month’s mortgage or rent payment, with young transgender adults reporting the least confidence of all groups. (See Figures 2 and 3.)
Figure 2
Figure 3
At the onset of the pandemic, the U.S. Centers for Disease Control and Prevention issued an eviction moratorium, barring landlords from evicting tenants for any reason. In September 2021, however, the Supreme Court struck down the Biden administration’s attempt to extend that moratorium, immediately putting renters across the United States back at risk of eviction.
An analysis of Pulse survey data prior to the Supreme Court’s decision by the Williams Institute, a research organization focused on sexual orientation and gender identity issues, finds that ending this moratorium would disproportionately harm LGBTQ+ individuals. This is because 41 percent of LGBTQ+ people, and 47 percent of LGBTQ+ people of color, rent their residences, compared to 25 percent of non-LGBTQ+ people, according to the analysis.
LGBTQ+ individuals’ access to health insurance
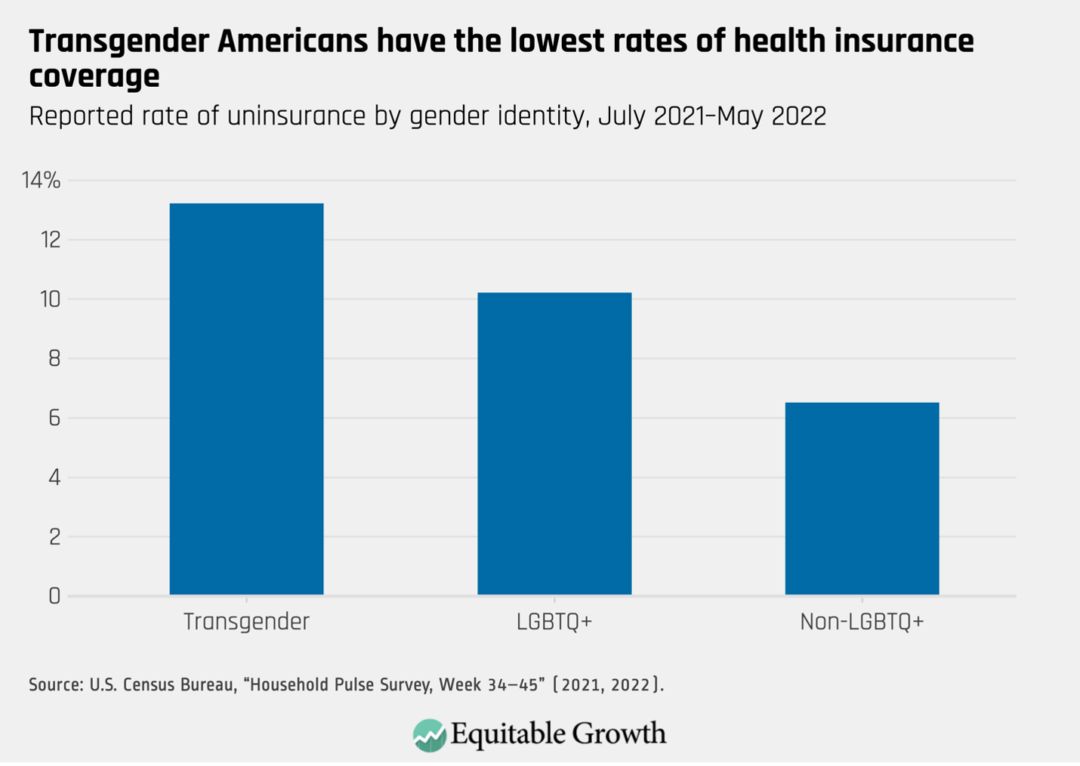
A 2014 study by the Center for American Progress finds that between 2013 and 2014, when the Affordable Care Act was implemented, the uninsured rate of LGBTQ+ Americans with incomes below 400 percent the federal poverty rate fell from 34 percent to 26 percent. The uninsured rate for LGBTQ+ people of all income brackets in the United States remains at 12.7 percent in 2021, compared to 11.4 percent for non-LGBTQ+ people.
Transgender respondents of the Household Pulse Survey report slightly lower rates of public and private insurance, compared to cisgender respondents, indicating that while there has been much progress in improving coverage for LGBTQ+ individuals in recent years, more efforts are needed to improve transgender healthcare coverage. While some of the noise in the survey data can be attributed to the smaller sample size of transgender respondents, it is indicative of the disparities transgender people face in access to quality healthcare. (See Figure 4.)
Figure 4
Many LGBTQ+ workers have lost their employer-sponsored health insurance along with their jobs amid the ongoing COVID-19 pandemic. The U.S. Bureau of Labor Statistics finds that only 42 percent of private-sector employers who laid off workers during the pandemic paid some or all of their workers’ health insurance premiums. Additionally, only 23 percent of workers in the industries with the largest share of LGBTQ+ workers—such as arts, entertainment and recreation, or accommodations and food services—had employer-paid healthcare coverage, compared to 34 percent of the private sector more broadly.
Having little to no health insurance coverage during a worldwide pandemic can have detrimental effects on an individual’s physical and mental health. The Census Bureau’s own analysis of the Household Pulse Survey finds that LGBT respondents reported twice as high rates of experiencing symptoms of anxiety and depression, compared to non-LGBT respondents.
Policy implications and conclusion
In these initial Household Pulse Survey results, there are significant disparities in economic experiences and hardships between LGBTQ+ individuals and non-LGBTQ+ individuals, as well as within the LGBTQ+ community. These data reinforce the importance of federal data collection in accurately tracking the economic well-being of LGBTQ+ populations in the United States.
There is also widespread evidence that shows how disaggregating data by race and gender paints a clearer picture of the economy and holds policymakers accountable for creating broad-based economic growth. Further disaggregating data along LGBTQ+ lines would similarly benefit researchers and policymakers alike.
Legislation such as the LGBTQI+ Data Inclusion Act, which recently passed in the U.S. House of Representatives, would mandate federal agencies to improve data collection and bolster privacy protections for the LGBTQ+ community. This disaggregated data will help create equitable economic growth for the LGBTQ+ community in the United States by clarifying current economic conditions and allowing policymakers to target support programs more effectively.
Methodology
To collect information about LGBTQ+ respondents, the Census Household Pulse Survey asks three SOGI-related questions:
What sex were you assigned at birth on your original birth certificate? Choice of answers: Male or Female.
Do you currently describe yourself as male, female, or transgender? Choice of answers: Male, Female, Transgender or None of these.
Which of the following best represents how you think of yourself? Choice of answers: Gay or lesbian; Straight, that is not gay or lesbian; Bisexual; Something else; I don’t know.
The U.S. Census Bureau then groups all respondents into three categories: LGBT, Non-LGBT, and Other. Respondents who reported a sex at birth that does not match their current gender identity or those who answered that they are gay/lesbian, bisexual, or transgender were assigned to the LGBT category. Respondents whose birth gender matches their current gender and answered that they are straight were assigned to the Non-LGBT group. And respondents who selected “None of these” on the current gender question and either “Something else,” “I don’t know,” or “Straight” on the sexual orientation question were categorized as Other. Respondents whose sex at birth matches their current gender identity but selected either “Something else” or “I don’t know” on the sexual orientation question were also categorized as Other.
For our analysis, we merged the LGBT and Other groups to make one LGBTQ+ category. We assume that respondents in the Other category identify themselves as queer, pansexual, asexual, or other identities or orientations beyond lesbian, gay, bisexual, or transgender. Merging the two groups thus allows us to create an inclusive LGBTQ+ category that represents all members of the community.
Equitable Growth is committed to building a community of scholars working to understand how inequality affects broadly shared growth and stability. To that end, we have created the monthly series, “Expert Focus.” This series highlights scholars in the Equitable Growth network and beyond who are at the frontier of social science research. We encourage you to learn more about both the researchers featured below and our broader network of experts.
With access to abortion in the United States increasingly restricted or banned, and access to contraception under threat in several states as well, research on the links between reproductive care and equity, economic stability, and overall health and well-being is more important than ever. Though reproductive health is often seen as outside the realm of economic research and policy, the reality is that access to these important healthcare and family planning options has vast economic and financial impacts on the lives of people who may become pregnant and their families.
Furthermore, reproductive justice scholarship and activism has long acknowledged the important links between economic disparities and health inequality, as well as pioneered a framework for considering how reproductive health can be affected by other factors, including race, sexual orientation, immigration or disability status, and environmental conditions.
This month’s installment of Expert Focus highlights scholars whose research establishes extensive evidence on the clear ties between access to reproductive healthcare and economic outcomes, as well as scholars who have made significant contributions to our understanding of how reproductive health inequities intersect with racial and gender inequality. After the U.S. Supreme Court’s decision on June 24 to overturn Roe v. Wade, and thus overturn the nationwide right to access an abortion, the implications for the physical and mental health of individuals who may become pregnant are now front and center across the United States, as are the widespread economic and financial ramifications for those people and their families.
The work the scholars featured in this Expert Focus and other scholars—including those featured in past installments of Expert Focus, such as Martha Bailey at University of California, Los Angeles and Adriana Kugler at Georgetown University—are doing to document those impacts should guide federal and state policymakers as they face the post-Roe era in the United States.
One element of this project examines racial disparities. Black women, for instance, are 2.4 times more likely than White women to have an unplanned pregnancy, in part due to racial disparities in the U.S. poverty rate and access to contraception—and the underlying mechanisms driving those disparities. Barber is a collaborator with fellow Equitable Growth grantee Martha Bailey on the M-CARES project, which is exploring how subsidizing reproductive care affects women’s decisions around contraceptive use.
Zakiya Luna
Washington University in St. Louis
Zakiya T. Luna is a Dean’s Distinguished Professorial Scholar in the Department of Sociology at Washington University in St. Louis. Her research focuses specifically on social movements and social change, health and inequality, and human rights and reproduction, with an emphasis on the effects of the intersecting inequalities within and across these areas, including gender and racial disparities. Luna is the author of Reproductive Rights as Human Rights: Women of Color and the Fight for Reproductive Justice, a look at how women of color—and SisterSong in particular, which is the largest national multiethnic reproductive justice advocacy organization—were central to making the reproductive justice movement what it is today and linking the cause of reproductive rights to issues of fair wages, safe housing, job security, and other economic rights. She has written extensively on reproductive justice, and is co-creator and former co-editor of the University of California Press book series Reproductive Justice: A New Vision for the Twenty-First Century, a collection of publications that explores the current reproductive justice landscape and serves as a resource for students and advocates.
Caitlin Knowles Myers
Middlebury College
Caitlin Knowles Myers is the John G. McCullough professor of economics at Middlebury College. Myers’ research examines issues related to gender, race, and the economy, and especially the effects of reproductive policies on people’s professional lives and economic outcomes. Her current work focuses primarily on access to abortion care and the effects of abortion restrictions or burdensome processes, such as traveling to receive care or mandatory waiting periods, on the incidence of abortions.
She also writes extensively in the popular press, academic journals, and for research organizations on the growing body of research reinforcing the economic impacts of access to abortion care for women, what restricting that care would do to women, the U.S. labor force, and the overall economy in the United States, and what a post-Roe era could mean in terms of U.S. abortion access and incidence. Myers was the lead economist on an amicus brief sent to the Supreme Court in the Dobbs v. Jackson Women’s Health Organization case, detailing the economic imperative of not overturning Roe and signed by more than 150 leading economists.
Mayra Pineda-Torres
Georgia Institute of Technology (incoming)
Mayra Pineda-Torres is an incoming assistant professor of economics at the Georgia Institute of Technology. Her research interests are centered on the intersection of health economics, labor economics, and gender economics, with a particular focus on topics related to women and teen well-being and the economic and health impacts of access to reproductive healthcare. Her works in progress include papers on access to abortion care and its effects on inter-partner violence and educational attainment. She also co-authored an article that looks into the effects of abortion mandatory waiting periods on abortion timing and abortion rates in Tennessee.
In addition, she has a working paper with Kelly Jones at American University on the impacts of exposure to TRAP laws during adolescence on teen birth rates and educational attainment. This paper finds that young Black women are particularly affected by TRAP laws. In states with such restrictions, teen births increase by 3 percent compared to states without these laws. The paper also finds that adolescent exposure to TRAP laws has downstream impacts on education for Black women, who are 2 to 6 percent less likely to start and complete college.
Loretta Ross
Smith College
Loretta J. Ross is an associate professor of the study of women and gender at Smith College. Her research interests lie in women’s human rights, reproductive justice, and White supremacy. Ross’ expertise lies in her background as a reproductive justice pioneer and her own personal experience with abortion and unintended pregnancy. She has co-authored three books on reproductive justice—a framework that she co-created with 11 other Black women working within and beyond the pro-choice movement in the 1990s that combines reproductive rights and social justice into one theory of change and centers the voices and experiences of women of color and other marginalized people.
In 1997, she co-founded SisterSong, a Southern-based, women of color-led national reproductive justice collective, to work together to improve institutional policies and systems that affect not just the reproductive health of marginalized communities but also their economic security and well-being. Ross is a sought-after thought leader who speaks often (including before congressional committees) about the impact of restricting access to abortion care on women, and especially women of color.
Equitable Growth is building a network of experts across disciplines and at various stages in their career who can exchange ideas and ensure that research on inequality and broadly shared growth is relevant, accessible, and informative to both the policymaking process and future research agendas. Explore the ways you can connect with our network or take advantage of the support we offer here.
Before the U.S. Supreme Court ruling on June 24 in Dobbs v. Jackson Women’s Health Organization, more than five decades of liberating access to contraception and abortion care had demonstrable effects for women’s economic outcomes in the wake of the previously precedent-setting Supreme Court decisions in Griswold v. Connecticut and Roe v. Wade. These economic outcomes are now under threat.
Women today make up almost half of the overall U.S. labor force, compared to just one-third in 1950, and are the backbone of maintaining family incomes. These outcomes were influenced at least in part by the ability of people to have more autonomy over planning if and when to start a family. Access to reproductive care and control over family planning provided rightful bodily autonomy to people to control their lives and decisions, and enabled more women to participate in the labor force and pursue higher education—and thus earn higher wages and match into jobs that are more fulfilling for them.
Even before the Dobbs ruling, the right to access abortion and contraceptives more broadly—legalized in the early 1970s—faced restrictions in various states and picked up following the 2010 midterm elections that ushered conservatives into power in state legislatures across the country. These restrictions were already limiting women’s economic opportunities based on where they live. After the June 24 Dobbs decision, women’s economic opportunities will only worsen in these states and perhaps be further exacerbated by other attacks on rights and freedoms in the future.
A wide body of research demonstrates that access to reproductive care is fundamental in ensuring economic well-being for women and their families. This research also finds that access to reproductive healthcare is particularly critical for women of color, who face additional economic barriers imposed by structural racism, such as longstanding and widespread occupational segregation.
This factsheet details the existing literature on the economic impacts of access to reproductive care and what restrictions to abortion care or contraception will mean for the U.S. economy and labor force. But these economic consequences laid bare by research are only partial, as bodily autonomy and family planning underlie economic security and well-being in myriad ways throughout the life cycle.
The reproductive care policy landscape until Dobbs
The Supreme Court decisions in Griswold and Roe expanded access to contraception and abortion care, respectively, but the U.S. Congress never passed a law protecting these rights. Now that the U.S. Supreme Court has overturned Roe, state legislatures will be able to decide whether and how people who may become pregnant can access this important reproductive care. Here are some of the consequences:
One in 4 U.S. women—59 percent of whom are already parents and the majority of whom are in their mid- to late 20s—are projected to have an abortion by age 45. That access to abortion is considered a human right by the United Nations’ Office of the High Commissioner on Human Rights. Now, it is not accessible across much of the United States.
Since the Roe v. Wade decision, states across the country have strategically limited women’s access to abortion care through restrictions on the conditions under which women can receive abortion care, including gestational limits that ban abortion after a specific amount of time after conception, mandatory counseling and waiting periods, requirements for invasive ultrasounds, and targeted restrictions of abortion providers, also known as TRAP laws, that are specifically designed to foster the closure of health clinics that provide abortion care, among other restrictions.
Research from the Guttmacher Institute—a nonprofit reproductive health organization—suggests that as many as 26 states are certain or likely to ban abortion in the wake of the Supreme Court’s Dobbs decision overturning Roe. Of those 26 states, 13 have trigger laws, or abortion bans that will automatically take effect once Roe no longer stands.
A recent analysis from Michael Ollove at The Pew Charitable Trusts indicates that several states are also taking aim at access to contraception, such as emergency contraception pills (known as the morning-after pill or Plan B) and intrauterine devices, or IUDs. Many of these state legislatures are also taking steps to limit funding for family planning at reproductive health centers, which could restrict access to contraception, particularly for low-income women, many of whom live in contraception deserts.
Federal legalization of abortion following Roe increased women’s economic opportunities and advancement
Several studies have looked at how the legalization of abortion following the Roe v. Wade decision in 1973 changed economic conditions facing women in the United States. Because abortion was legal in some states and not others prior to Roe, economists have been able to leverage this “natural experiment” of comparing women who had access prior to 1973 and those who did not to understand how expanding bodily autonomy through access to abortion care had subsequent economic impacts on their well-being. Specifically:
A study by Caitlin Knowles Myers at Middlebury College and the Institute for the Study of Labor details the effects for young women of both abortion and contraception access, both of which were expanded in the early 1970s. She finds that it had a significant impact on the ability of people to control their family planning decisions, which allowed them to have higher career aspirations and goals, as well as plan better for their futures.
A study by the late economist Marshall H. Medoff of California State University, Long Beach finds that though White women have the greatest absolute levels of abortion across the country, disproportionately more Black and Hispanic women seek abortion services.
Other research examines the disproportionate economic effects that abortion expansion has on women of color. Specifically:
A study by Ali Abboud at The Ohio State University finds that access to abortion before age 21—prime years for investing in human capital, such as higher education and other skills building—delays the age at which women give birth to their first child by at least 6 months, on average. Abboud examines the effects on labor market participation of that delay, finding that wages significantly increase for women as a result of the ability to control when they start a family—and, in particular, Black women see a 10 percent increase in earnings.
A study from Joshua Angrist at Hebrew University and William Evans at the University of Maryland, College Park finds that reforms to abortion restrictions that expanded access to care led to increased rates of education and schooling among Black women, as well as fewer teen pregnancies and nonmarital births.
Subsequent restrictions of access to abortion care limited women’s economic well-being and reduced access to opportunities
Several studies document the economic consequences for women of being denied an abortion due to gestational limits by comparing women who are forced to carry a pregnancy to term and otherwise-similar women who are able to access abortion care. Specifically:
Sarah Miller at the University of Michigan and her co-authors find that women’s economic trajectories are similar prior to becoming pregnant, but those women who are not able to get an abortion experience a large increase in financial distress for several years following the denial. The co-authors also find that being denied an abortion increases the likelihood of negative public records, such as bankruptcy and eviction, by up to 81 percent, compared to women from similar financial backgrounds who are able to get an abortion.
The Turnaway Study similarly finds that being denied an abortion leads to a higher chance of being in poverty up to 4 years later and a lower likelihood of having positive personal life goals in the coming year.
A study by Diana Greene Foster at the University of California, San Francisco and others finds that women denied abortion care are less likely to be employed full time 6 months after the denial and more likely to access income support programs.
Policy conditions that make it more difficult to access abortion care also shape women’s economic outcomes in those states, which helps us understand the potential impact of bans on abortion. For instance, various studies looking into the effects of TRAP laws find many negative outcomes for women, particularly women of color. Specifically:
Research by one of this factsheet’s authors, Kate Bahn, with Adriana Kugler, Melissa Holly Mahoney, and Annie McGrew shows that these regulations actually trap women into bad jobs. We find that women in states with TRAP laws are 7.6 percent less likely to go into higher paid occupations than women in states without TRAP laws, controlling for factors such as education, age, industry, and other factors that economists typically think impact occupational mobility.
Other research by Kelly Jones of American University and Mayra Pineda-Torres, incoming at the Georgia Institute of Technology, looks at how TRAP laws affect women’s education and future income, finding that young Black women are especially impacted by these abortion restrictions, while White women are relatively unaffected. The co-authors find that Black women who are exposed to TRAP laws between the ages of 15 to 23 have lower college completion rates by between 5 percent and 11 percent and lower future family incomes by between 3 percent and 6 percent, compared to similar women who are not exposed to TRAP laws. This is because reduced access to abortion care increased early births among Black women.
The passage of the Texas TRAP law, HB2, in 2013, which imposed onerous restrictions on abortion clinics, and the subsequent repeal of components of this law in the U.S. Supreme Court case Whole Woman’s Health v. Hellerstedt in 2016, drastically changed the landscape of health clinics that offer abortion care in Texas. Closure of clinics across the state increased the distance many women had to travel in order to access abortion care. In one study by Jason Lindo at Texas A&M University, Caitlin Knowles Myers at Middlebury College, and Andrea Schlosser and Scott Cunningham at Baylor University found that going from 0 to 50 miles distance to a clinic to 50 to 100 miles to a clinic reduced the abortion rate by 16 percent.
Overall, the effects of abortion restrictions will be felt most strongly by low- and middle-income women and women of color in particular. As the Economic Policy Institute’s Asha Banerjee writes, “Many of the states with preexisting abortion bans held at bay by Roe are also states that have created an economic policy architecture of low wages, barely functional or funded public services, at-will employment, and no paid leave or parental support.”
But it’s not only abortion restrictions that have huge long-term impacts on women’s engaging in the economy. Being forced to carry an unwanted or unplanned pregnancy to term also imposes direct and immediate financial costs on those who become pregnant and their families. Specifically:
The Economic Policy Institute’s Banerjee notes that women often face professional penalties, including pay cuts—and even get fired—for becoming pregnant.
Most U.S. workers do not have access to paid parental leave, meaning many have to rush back to work before fully recovering from giving birth to avoid losing their jobs or falling into debt. And that’s to say nothing of the enormous financial burden of maternity care and raising a child in the United States.
Increased accessibility of abortion care improves women’s outcomes
While many studies look at the effects of restrictions to abortion, there is also a body of research that explores expanded access to abortion care through reducing direct costs to individuals. While federal funds cannot be used to reduce costs and increase access to abortion care, due to the Hyde Amendment passed in 1976, direct costs to patients are variable based on decreasing cost through expansion of services—more supply of providers leads to a reduction in prices—as well as state-level dedicated funding to increase access to abortion care. Specifically:
A study by Elizabeth Ananat at Duke University and her co-authors looks at the effects of a decrease in the cost of abortion on various outcomes in young adulthood. Looking at changing costs from the 1960s through 1970s, as states legalized abortion and then federally after the Supreme Court legalized abortion in 1973, the co-authors find that lower costs for the procedure increased the likelihood of college completion, reduced the rate of access to social insurance and income support programs, and lowered the odds of being a single parent.
Bahn’s research with her co-authors finds that Medicaid funding for abortion care, available in 16 states from dedicated state-provided funding sources, improves women’s economic outcomes. Women who live in states with Medicaid funding for abortion are more likely to change occupations year-over-year, which is linked to higher earnings and better job matches, compared to women who live in states that do not have public insurance funding for abortion care.
Research mentioned above by CSU Long Beach’s Medoff finds that Medicaid funding for abortion was particularly critical to Latinas, whose demand for abortion care is more sensitive to access to insurance coverage for abortion care through Medicaid. These women workers already face significant intersectional wage gaps, further exacerbating economic inequality.
Contraception gives women more security over their economic futures
Contraception is also an important part of family planning and reproductive care, and expanded access to birth control was a huge factor in boosting women’s economic security. Specifically:
The seminal study in 2002 by Claudia Goldin and Lawrence Katz at Harvard University on the birth control pill finds that it had a direct positive effect on women’s long-term career investments, evident in women’s increasing ability to access graduate and professional degree programs, such as law and medical school. The two authors also find that it had an indirect effect: “all individuals could delay marriage and not pay as large a penalty,” which, the authors explain, leads to better matches for women who pursue their careers.
Another important study in 2006 by Martha Bailey, then at the University of Michigan and now at the University of California, Los Angeles, examines women’s labor force participation as a result of “contraceptive freedom.” She finds that access to the pill increased the number of women in the paid labor force, as well as the number of hours those women worked, because it reduced the likelihood of first births occurring before women turned 22. Bailey writes that her findings suggest that access to birth control before age 21 accounts for 3 percentage points of the 19 percentage point increase in labor force participation rates, and 370 hours of the 450-hour increase in annual work hours among women from 1970 to 1990.
Further research from Bailey and her co-authors Brad Hershbein at the University of Michigan and Amalia Miller at the University of Virginia finds that this increase in labor force participation rates gave women the chance to invest in new career paths and reduced the gender wage gap.
Conclusion
Economics research on the initial federal legalization of abortion, subsequent changes to accessibility of abortion care, and the broad dissemination of contraception demonstrates the link between reproductive care and economic opportunity for workers. People who can get pregnant face both direct costs, when services become more expensive to secure and unintended pregnancy leads to financial burdens, as well as indirect costs, when it becomes more difficult and uncertain to invest in one’s education and careers in the future.
These costs intersect with other forms of economic marginalization. Research shows that access to reproductive healthcare is particularly critical to women of color. Bodily autonomy is a fundamental human right and the foundation of any individual being able to fully engage in the economy. The U.S. Supreme Court’s June 24 ruling in Dobbs directly threatens all of these economic gains made by women in the United States over the past five decades.