Following nationwide protests across the United States in 2020 against police brutality, the push for federal recognition of Juneteenth gained momentum, with the U.S. Congress enacting legislation in the summer of 202l declaring June 19th a national holiday. The first anniversary of the federal holiday, celebrated on June 20 this year, is a moment for all Americans to honor the emancipation of enslaved African Americans following the end of the Civil War more than 150 years ago.
But Juneteenth also is an opportunity to take stock of congressional and state government efforts to account for the consequences of pervasive institutional racism before and after 1865 and evident still today. After all, the results of the brutal exploitation of enslaved African Americans to the systematic oppression in the Jim Crow South to today’s institutionalized racism are still evident in the disparate access to and outcomes in income, wealth, education, healthcare, jobs, housing, and criminal justice for so many Black workers and their families.
There is one initiative in Congress to establish a commission to study the effects of slavery and discriminatory policies on African Americans and recommend appropriate remedies, including reparations. Some cities and states are also working to address the need for reparations through piecemeal programs and initiatives. California’s Task Force to Study and Develop Reparation Proposals for African Americans, for example, recently released its nearly 500-page report that says its findings have nationwide implications for the way the United States addresses reparations. And there are several more ways in which reparations could be handled by policymakers at the state and local levels.
Before examining those two reparations proposals, however, it’s first imperative to detail briefly why pervasive wealth inequality—the most telling consequence of the history, legacy, and enduring presence of systemic racism—persists for most African Americans. The reason: Over the course of U.S. history, the accumulation of wealth by the vast majority of generations of Africans Americans was categorically illegal (pre-1865) and then systemically and violently inhibited (post-1865) by Jim Crow laws, the exclusion of agricultural workers and domestic helpers from New Deal reforms, and sweeping housing-market redlining, among many other forms of institutional racism.
All of these barriers to opportunity to earn and save severely inhibited the accumulation of wealth in Black communities across generations. Indeed, government policy has created or maintained hurdles for African Americans who attempt to build, maintain, and pass on wealth. The share of wealth of African Americans is considerably lower than their percentage of the nation’s population, with Black Americans accounting for about 12 percent of the nation’s population but possessing only about 2.6 percent of the nation’s wealth.
This translates into a condition in which the average Black U.S. household has a net worth that is $800,000 lower than the average White household’s net worth. This wealth divide matters because it’s such a critical index of the cumulative effects across generations of racial injustice in the United States.
There are many people in the United States who consider the Civil Rights era of the 1960s as resolving the blatant racial discrimination in U.S. politics and society. Yet the post-Civil Rights period is marked to this day by housing discrimination, mass incarceration, and economic inequalities resulting from the intergenerational effects of White supremacy. What’s worse, calls for teaching this history and its legacy so that more Americans of all races and ethnicities understand the situation today are often met by political assaults from White Americans, particularly in the South, under the guise of combatting “critical race theory.”
This is another reason why reparations need to be on the table for discussion among economists and policymakers alike—documenting why reparations are called for is an important step in educating the broader U.S. public about the need for, as well as the benefits to, not just African Americans but the broader U.S. economy, too. Reparations, broadly understood, would be a program of “acknowledgment, redress, and closure.” It is not enough to merely recognize that Black Americans have suffered historical harm. There also must be steps taken to eliminate the effects of this harm.
Reparations would require the federal government to compensate for the effects of structural racism. The U.S. House of Representatives has a bill, H.R. 40, under consideration, with 196 co-sponsors and only 218 votes needed to pass. H.R. 40 would establish a 15-member commission to study the effects of slavery and discriminatory policies on African Americans and recommend appropriate remedies, including reparations.
More immediately, there is the already-completed study by California’s Task Force to Study and Develop Reparation Proposals for African Americans. This recently released, nearly 500-page report has nationwide implications for the way the nation addresses the consequences of systemic racism, including a proposal for reparations. Indeed, highlights from the report are a must-read on this first anniversary of Juneteenth as a federal holiday.
The California task force hopes to complete its second stage of research on how to create a reparations program sometime in 2023. And perhaps by the end of the current 117th Congress, the U.S. House of Representatives will have passed legislation enabling a federal study and set of recommendations—though chances of full congressional enactment are unlikely.
Indeed, politics and the many legislative and administrative layers that come along with enacting and interpreting legislation more broadly continue to stand in the way of a reparations program at the state and federal level because expanding voter suppression laws are making it more and more difficult to build the political power to address race-based economic inequality.
That’s why the Juneteenth holiday—the historic and symbolic representation of African American’s liberation from institutionalized and legislative slavery and oppression—is so important to the nation’s future. While the historical legacy of Juneteenth shows the value of never giving up hope in uncertain times, the day should also remind the nation that even decades later, we still have work to do.
The Labor and Employment Relations Association recently held its 74th annual conference, gathering hundreds of presenters and attendees virtually from across industries, and including participants from labor, management, government, advocacy, and academia. From June 2–5, there were more than 80 sessions covering various aspects of the U.S. labor market, its dynamics and challenges, and how workers are navigating these unusual circumstances amid the ongoing coronavirus pandemic.
Given recent unionization drives in the United States, from Amazon.com Inc. warehouses to Capitol Hill staffers, the theme of this year’s event was especially prescient. Centered on worker power and voice in the workplace, LERA chose “Elevating Voice and New Voices in the Workplace and Beyond” as the event’s focus. The agenda highlighted the critical role of employee voice in the workplace and the ongoing need to empower and support that voice for workers, particularly those who have been historically marginalized.
Members of our network, as well as Equitable Growth staff, were featured in at least a dozen different plenaries, panels, and paper sessions. Below, we highlight some of the key moments, as well as panels and papers that caught our interest over the course of the 4-day event.
Former Equitable Growth President and CEO Heather Boushey, now at the White House Council of Economic Advisers, spoke in a plenary session with Equitable Growth grantee Ioana Elena Marinescu. The session, moderated by AFL-CIO chief economist Bill Spriggs, a professor at Howard University, focused on how antitrust law can be used to address wage suppression and inequality.
Boushey detailed the Biden administration’s work to boost competition across the U.S. economy using a whole-of-government approach—a proposal that was recommended in an Equitable Growth antitrust report co-authored by several competition policy experts. She also brought up President Biden’s commitment to strengthening worker power and the importance of unions for workers to be able to collectively bargain and thus provide a counterweight to highly concentrated power of employers.
Marinescu discussed her work on the impact of employer concentration on wages, noting that the assumption in economics that workers are paid roughly what they are worth is not always correct. In fact, she said, “when workers have fewer employers [who] they can turn to for jobs, you see lower wages in that market”—a trend derived from monopsony power, or high concentration of employers in a labor market.
Another panel session focused on worker resistance and labor shortages across the United States, including how unions and worker resistance play a role, featured grantee Ruth Milkman of the City University of New York Graduate Center. Panelists discussed the challenges facing the modern U.S. labor movement, such as scaling it to its former levels of membership, the impact of the 2018 West Virginia teacher strikes and the Red for Ed movement, and why worker shortages are good for labor.
Milkman specifically noted how the so-called Great Resignation in the wake of the COVID-19 recession is a “misnomer” because what’s actually happening is workers are “taking advantage of the labor shortage to look around and get jobs that they prefer to the ones they might have had in the past.” She cautioned analysts to keep an eye on whether this period of heightened worker power will result in long-lasting changes.
Equitable Growth’s Sam Abbott, our family economic security policy analyst, chaired a session on the care economy and its policy implications. Several Equitable Growth grantees presented their research. The University of Maryland’s Corey Shdaimah detailed her co-authored research with Elizabeth Palley at the School of Social Work at Adelphi University on early childhood care providers. The University of Chicago’s Julia Henley summarized her research on the pandemic and home-based child care providers. And Syracuse University’s Emily Wiemers presented her research on the long-term impacts of COVID-19 on care outcomes for high-need older adults.
Several Equitable Growth grantees also participated in a panel on the challenges of collective bargaining in the United States. Duke University’s Matthew S. Johnson discussed his co-authored research on trade competition and the decline in unionizations. Anna Stansbury from the Massachusetts Institute of Technology detailed her research on whether firms have incentives to comply with labor standards laws. In addition, attendees heard about co-authored research by Columbia University’s Suresh Naidu on why unionization rates in the United States have declined. Grantee Ihsaan Bassierof theUniversity of Massachusetts Amherst served as one of two discussants for the session.
Grantee Nathan Wilmers from MIT chaired a session on using data to study work and the labor market. His research was presented by co-author Carly Knight of New York University, who explained their study on why firms adopt new managerial ideologies and strategies using historical data from 1935–2005.
In a “LERA Best Papers” session, grantee Peter Fugiel of the University of Illinois at Urbana-Champaign presented his research on schedule unpredictability, looking at the prevalence of this scheduling practice across the U.S. labor market. His findings suggest that scheduling unpredictability is common in many sectors beyond those that are typically targeted by Fair Workweek laws, such as in retail and fast food chains.
Several other sessions caught our eye, speaking directly to our research and policy priorities:
“LERA Plenary: Financialization, Corporate Governance, and Labor.” This plenary session highlighted a major theme of the event—the growing effects of financialization on workers and the U.S. economy and the importance of worker voice in mitigating these harms. Panelists, including Lenore Palladino of University of Massachusetts Amherst, discussed themes such as worker voice and greater workplace democracy as countervailing forces to financialization, including pressure from shareholders to increase profits instead of investing in workers or workplace safety, and the history and impacts of stock buybacks. The panelists also touched upon the racial justice elements of financialization, including how corporate equity is predominately held by wealthy White households, thus driving racial wealth divides.
“Pay Equity Laws: Intended, Unintended, and Unpursued Consequences for Tackling Gender Wage Gaps.” This panel session looked at a slate of pay equity laws, including banning salary history questions, prohibiting pay secrecy policies, and mandating companies to report pay data to overcome gender wage divides. One study by Laura Adler at Harvard University found that salary history bans resulted in companies asking about salary expectations, and that women were more penalized than men for stating higher expectations. Another panelist’s study found that Black and White women are more likely to work in places that ban salary sharing, compared to Latina women.
“Preparing Hospitality Workers and Workplaces for the Future of Automation.” This panel session looked at the rise of algorithmic management applications in the hospitality industry, including hotel housekeeping. Panelists presented initial findings from a multi-year study that will develop mechanisms for worker input into the design and deployment of these technologies, reducing disruptions to workflow, boosting worker autonomy, and opening pathways for addressing any workplace issues.
“Job Quality in the Restaurant Industry: An Examination of Human Resource Practices and Outcomes in Fast Food Chains.” This symposium session explored how franchising affects wages and other job-quality factors in the restaurant industry, and specifically looked at management practices. One study co-authored by Rosemary Batt of the Cornell University IRL School looked at the effects of unpredictable scheduling practices on turnover amid the COVID-19 pandemic, finding that unstable schedules exacerbated the rates of turnover in fast food restaurants.
The 2022 Labor and Employment Relations conference was an important opportunity for Equitable Growth to expand our network of interdisciplinary scholars and to learn about cutting-edge research on the relationship between worker power, the labor market, and inequality during critical period of resurgence for the U.S. labor movement. We look forward to future collaboration and participation with LERA and the many participants and speakers we heard from over the weekend.
The recovery in the U.S. labor market continued in May, with 390,000 jobs added and the unemployment rate holding steady at nearly its pre-pandemic level at 3.6 percent, according to the Bureau of Labor Statistics Employment Situation Summary released today. After 12 consecutive months of adding more than 400,000 jobs per month, that level decreased slightly last month, but continues to be above the pace of job growth pre-pandemic. And while earnings growth has averaged 5.2 percent over the past year, the annualized 3-month moving average for March to May was 4.5 percent compared to 4.8 percent for the prior three months.
In short, the jobs recovery amid the economic impact of the pandemic has been remarkable, but gains have been uneven and it is unclear whether continued fast-paced gains will continue.
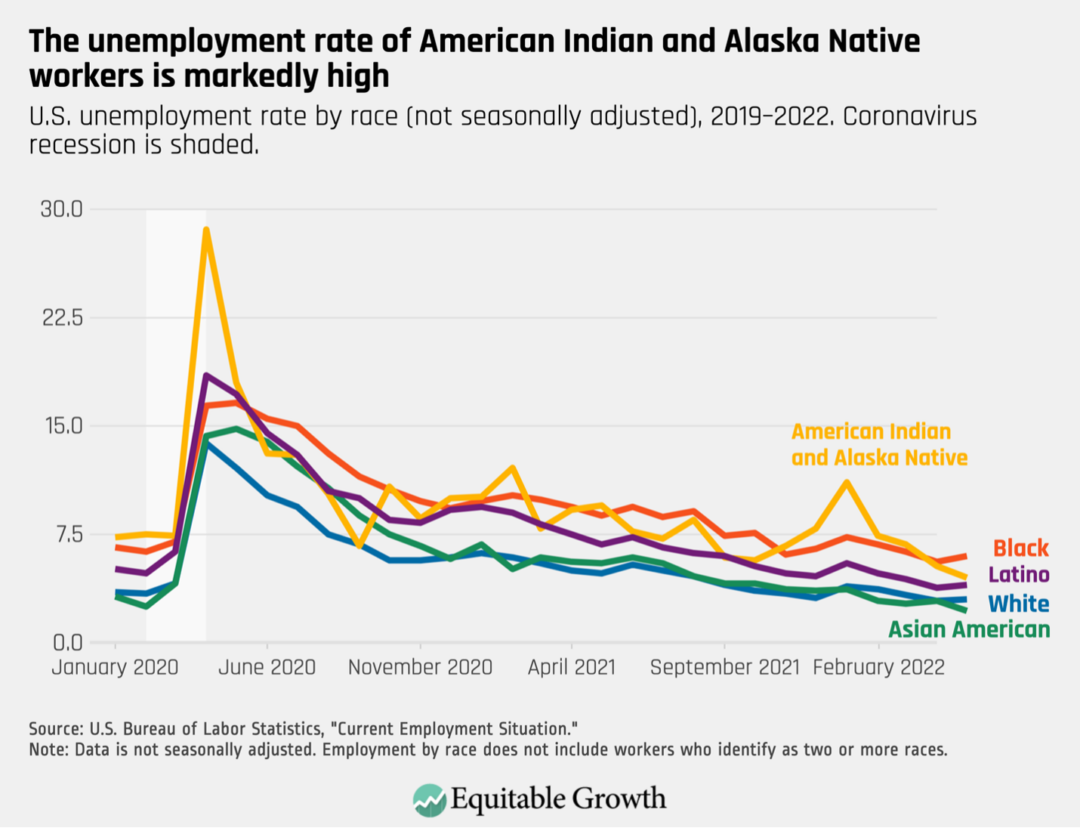
A slowing pace of recovery could also mean that the persistent disparities experienced by workers who face historical barriers to opportunity will likely be more difficult to overcome without the tailwind of a tight labor market. The non-seasonally adjusted unemployment rate for Black workers, at 3.0 percent, is nearly twice that of White workers, at 6.0 percent. American Indian and Alaska Native workers are facing an unemployment rate of 4.5 percent while Latino workers, who were among the hardest hit in the pandemic, are facing an unemployment rate of 4.0 percent. (The Bureau of Labor Statistics began publishing monthly data on American Indian and Alaska Native workers in February 2022, but does not report that data on a seasonally adjusted basis.)
The unemployment rate for Asian American workers is lower than the rate for White workers, at 2.2 percent. But our analysis of the April jobs report noted that Asian American workers experience significantly elevated levels of long-term unemployment compared to other workers.
Each of these realities demonstrate how market forces alone are not sufficient to resolve long-standing labor market inequalities. (See Figure 1.)
Figure 1
The jobs market today for young workers presents its own unique challenges and opportunities. With end of the school year, and with high school and college graduations now in train, many young workers are entering the job market at an unprecedented time.
The unemployment rate of workers ages 16 to 19 was 10.4 percent in May, up from 9.6 percent one year prior, but remarkably low compared to the historical average. The most recent Job Openings and Labor Turnover Survey from April released earlier this week found that there are 11.4 million job openings, a slight decrease from one month prior but above historical averages. As young workers may be finishing their school years, these conditions could have long-lasting impacts on their economic security.
Recession scarring for younger workers
A body of economics research finds that entering the U.S. labor market during a recession has impacts on young workers that can last long after the recession has abated. The long-run effects of an economic shock is known in economics as “hysteresis,” which describes negative effects that persist past the event causing the shock. Research by Kevin Rinz of the U.S. Census Bureau found that during the Great Recession of 2007–2009, younger workers recovered their levels of employment more quickly than other generations, but they faced both large and persistent earnings losses for up to 10 years following the initial shock.
Workers cannot choose when they were born, but the precise timing of their initial entry into the labor market has long-term impacts. Jesse Rothstein of University of California, Berkeley, finds that college graduates who entered the labor market during the end of the Great Recession in 2009 through the initial tepid recovery into 2011 had lower employment and earnings by 2017 compared to college graduates who entered the labor market immediately prior to the recession or post-2012.
What’s more, hysteresis is an enduring historical problem for young workers. Hannes Schwandt of Northwestern University and Till von Wachter of the University of California, Los Angeles, find that these “unlucky-cohorts” effects were common across business cycles in the modern U.S. labor market from 1976 to 2015, and particularly scarring for workers who face other disadvantages, such as non-white workers and those without a high school degree.
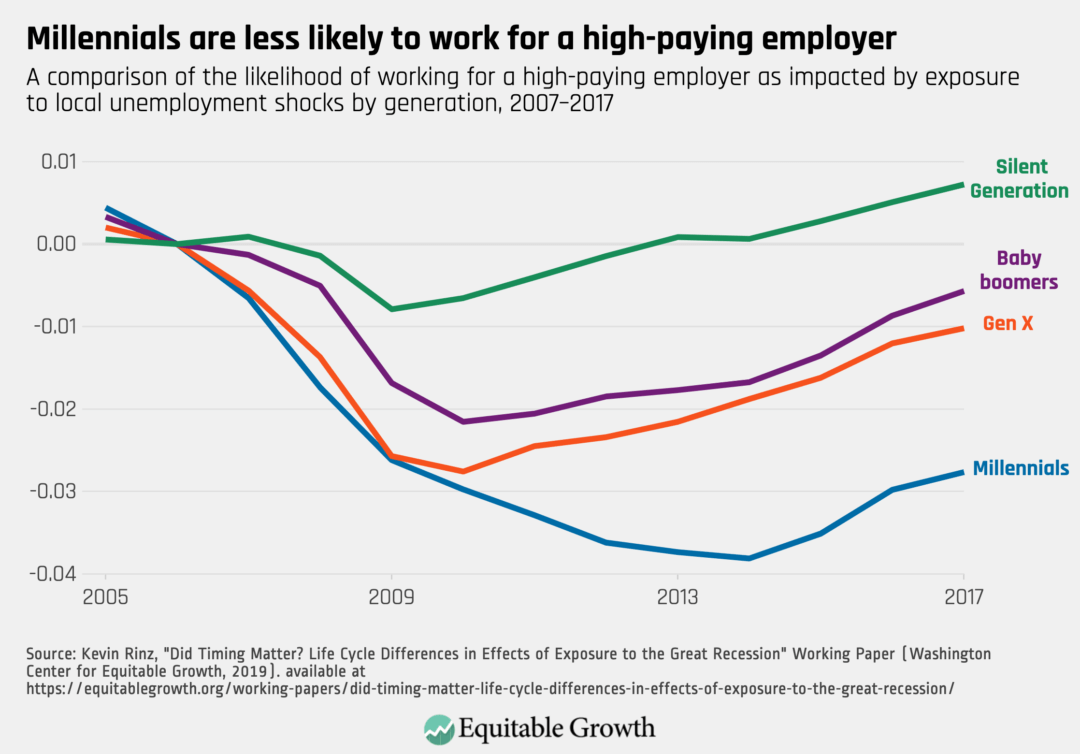
One of the critical factors in shaping these scars of recessions is where re-employment occurs. Rinz finds that younger workers are more likely to work for lower-paying employers following initial local unemployment shocks. (See Figure 2.)
Figure 2
Examined in a different way, Christopher Huckfeldt of Cornell University finds that increased hiring selectivity in recessions leads a situation in which it may be the optimal choice for a worker to switch into a lower-paying occupation when there are few other better alternatives. Workers who switch into lower paying occupations during a recession face earnings losses for a decade after the economic shock compared to workers who are also displaced in their jobs but stay in their occupation, the latter of whom recover their earnings within four years of an economic shock.
Then there’s the unique occupational impact of the coronavirus pandemic. It led to a sharp decline in in-person services followed by high labor demand now, and may shape the impact of this unique recession on the outcomes of younger workers.
Differences between the coronavirus recession, the Great Recession, and their aftermaths
As research relating to the Great Recession shows, the U.S. labor market for young people entering it as they begin their career can have long-term effects on their wages and career trajectory. Yet the labor market shocks and the pattern of recovery during the coronavirus recession and the subsequent economic recovery have diverged from those of the Great Recession in key ways that have implications for policy responses.
Employment losses in early and mid-2020 were both severe and unequal, disproportionately harming lower-income households and workers of color, especially those in hard-hit industries. The coronavirus pandemic’s early employment losses were also much greater than those of the Great Recession due to the sudden nature of emergency public health measures, and the fact that in-person services, particularly in leisure and hospitality, were most affected, as opposed to primarily the banking or housing sectors in the initial shock of the Great Recession.
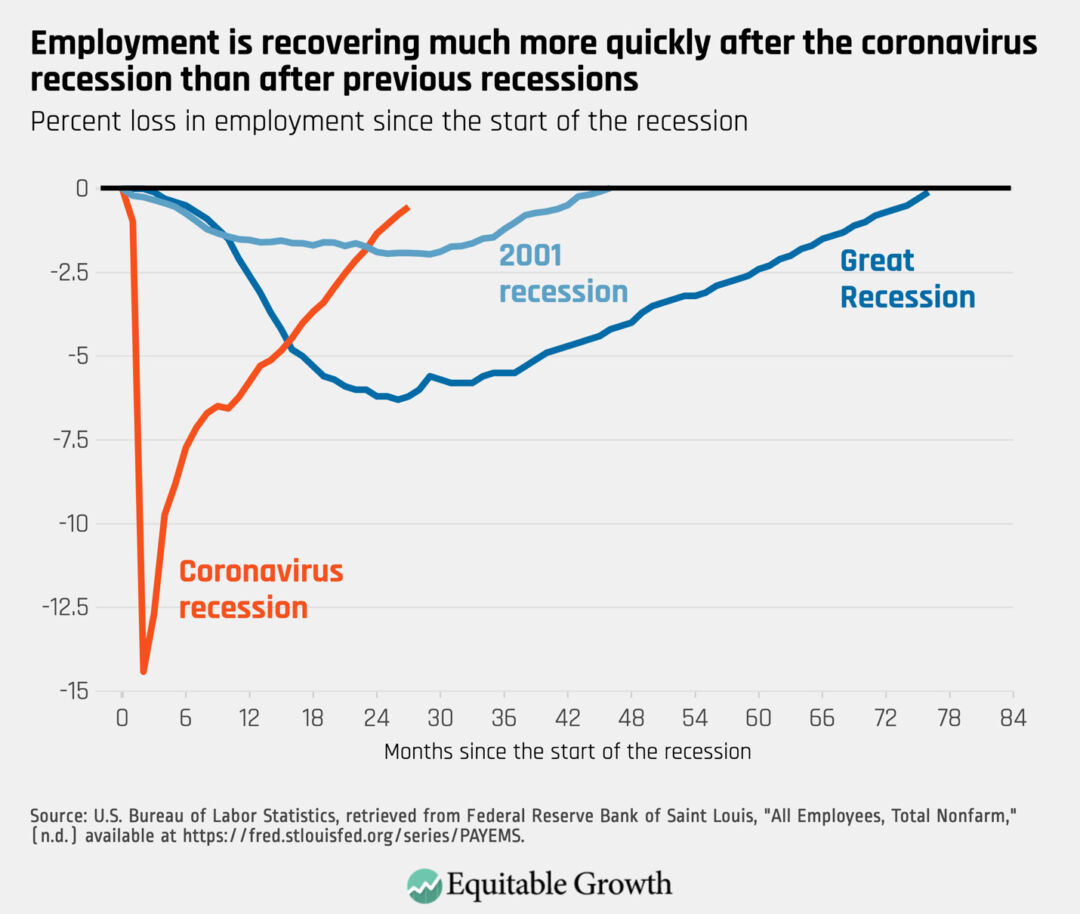
Furthermore, the rate of recovery after the most recent recession has been much more rapid than after other recent recessions. Employment is nearing pre-pandemic levels just over two years after the initial shock compared to eight years after the Great Recession. (See Figure 3.)
Figure 3
The pandemic’s shocks to the economy and related public health measures also appear to have had mixed impacts on young people’s educational outcomes and their decisions about seeking higher education, both of which affect tightness in the labor market. Basically, young people decide how the mix of immediate employment and education opportunities alongside calculations about how the long-term prospects of investing in higher education would shape their human capital accumulation as well as their debt loads.
Indeed, students finishing high school in 2020 may have been more likely to graduate, according to a new analysis by The Brookings Institution, as “high school graduation rates actually increased for students with disabilities, English-language learners, and Black students.” But the Brookings analysis also explains that college entry and enrollment appears to have declined, as pandemic upheaval intersects with years of rising college costs.
The acute employment losses during the coronavirus recession were most severe in many industries that disproportionately employ young people, an analysis from the Economic Policy Institute found, with the unemployment rate for young workers ages 16 to 24 rising to 24.4 percent in spring 2020, more than twice the rate of workers 25 and older. An analysis from the Pew Research Center shows that young people who graduated college in 2020 were also less likely to enter the labor force that year, with labor force participation for recent college graduates ages 20 to 29 falling from 86 percent in 2019 to 79 percent in 2020. Data from the jobs website Indeed also suggest students and early-career workers would have been less likely to have in-person internships in 2020.
While these employment shocks for younger workers were severe, they have also been relatively short as the U.S. economy recovers. This is most striking when looking at labor market activity for the very youngest workers. The Drexel University Center for Labor Markets and Policy predicts that summer employment for 16- to 19-year olds will reach levels not seen since 2007, the summer before the start of the Great Recession. The high demand for workers right now also is strengthening wages for workers in industries that do not typically require college degrees, highlighting how workers’ bargaining power and other factors contribute the wage distribution beyond the “college wage premium.”
Policy responses to support younger workers in the U.S. labor market
The likely long-term effects of the coronavirus pandemic on young workers’ outcomes remain unclear. The sudden and deep shocks of 2020 may have greater long-term effects for young workers entering the job market or making decisions about higher education that year, but the faster recovery may offset those harms to some extent. This suggests the need for policy interventions that both address the immediate harms for the most vulnerable young workers and strengthen our systems to be prepared for future shocks.
The experience of the first two years of the pandemic demonstrate how income supports and a stronger social infrastructure provide stability for weathering economic upheavals that reduce long-term negative consequences. Yet there are still gaps in the current system. For instance, as the Economic Policy Institute notes, expanded Unemployment Insurance benefits were not available to young people who were unable to enter the workforce. Policymakers should reform Unemployment Insurance and invest in building the administrative infrastructure for promising related programs, such as Short-Time Compensation, to protect vulnerable workers from sudden economic upheavals and mitigate the effects on their careers and on their households’ economic security.
Furthermore, developing a proposed job seekers allowance separate from the Unemployment Insurance system would help those who would remain ineligible for UI benefits as they initially enter the labor force following graduation.
As young workers drive unionization efforts across the country, policymakers also should strengthen workers’ bargaining power and worker protections, which research shows are especially crucial for improving earnings and reducing inequality for young workers without college degrees. At the same time, policymakers should make college more affordable and accessible for those who pursue higher education.
Canceling student loan debt also would provide much-needed relief to students and young workers as they navigate a changing labor market, and make them and their households more resilient down the road. Rebalancing economic power toward workers and young people would provide a foundation for future broadly shared growth.
On June 3, the U.S. Bureau of Labor Statistics released new data on the U.S. labor market during the month of May. Below are five graphs compiled by Equitable Growth staff highlighting important trends in the data.
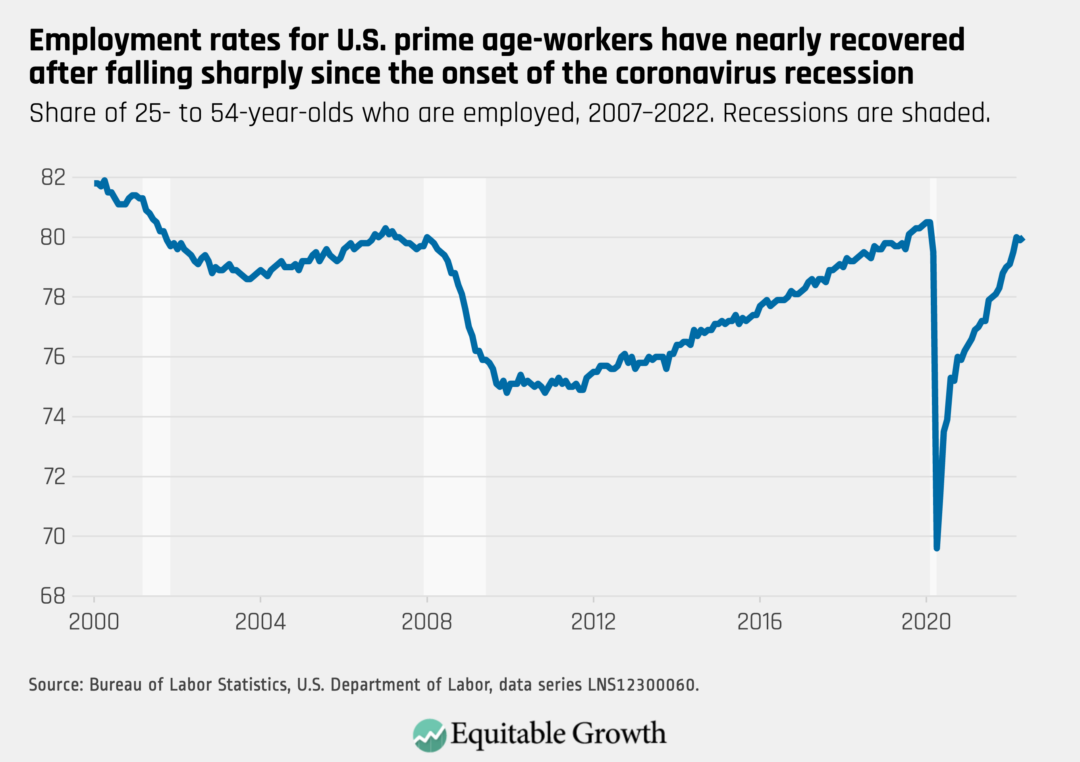
Total U.S. nonfarm employment rose by 390,000 in May, and the employment rate for prime-age workers increased slightly to 80.0 percent.
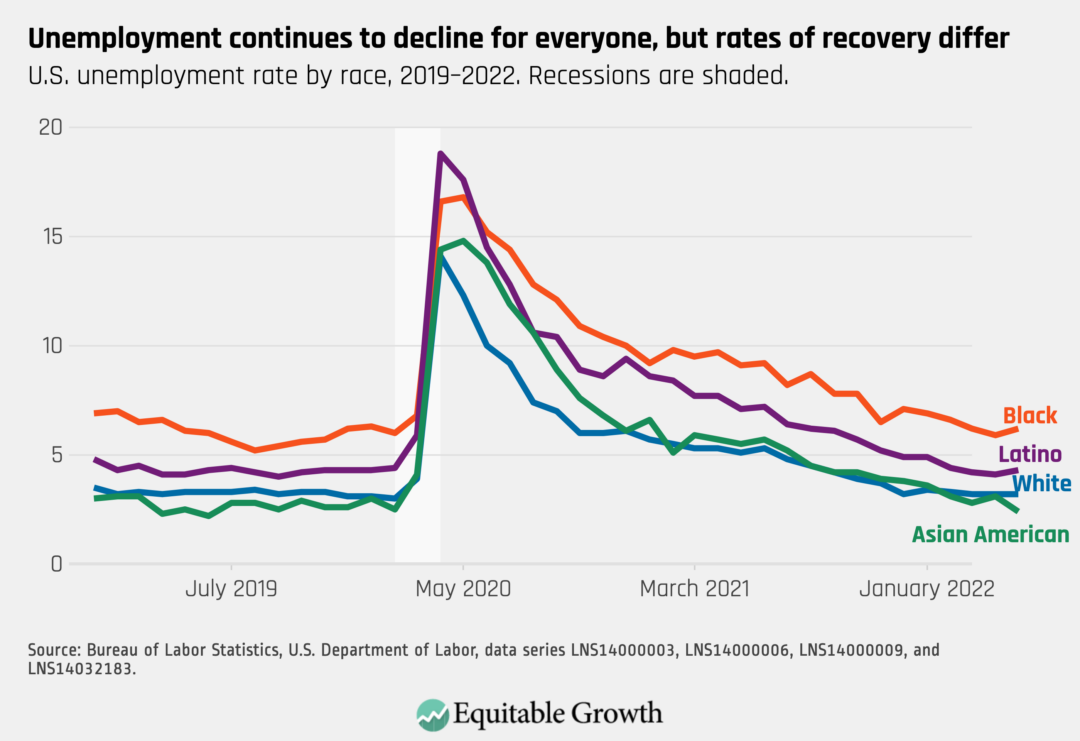
The unemployment rate remained at 3.6 percent again in May, still elevated for Black workers (6.2 percent) and Latino workers (4.3 percent) compared to White workers (3.2 percent) and Asian American workers (2.4 percent).
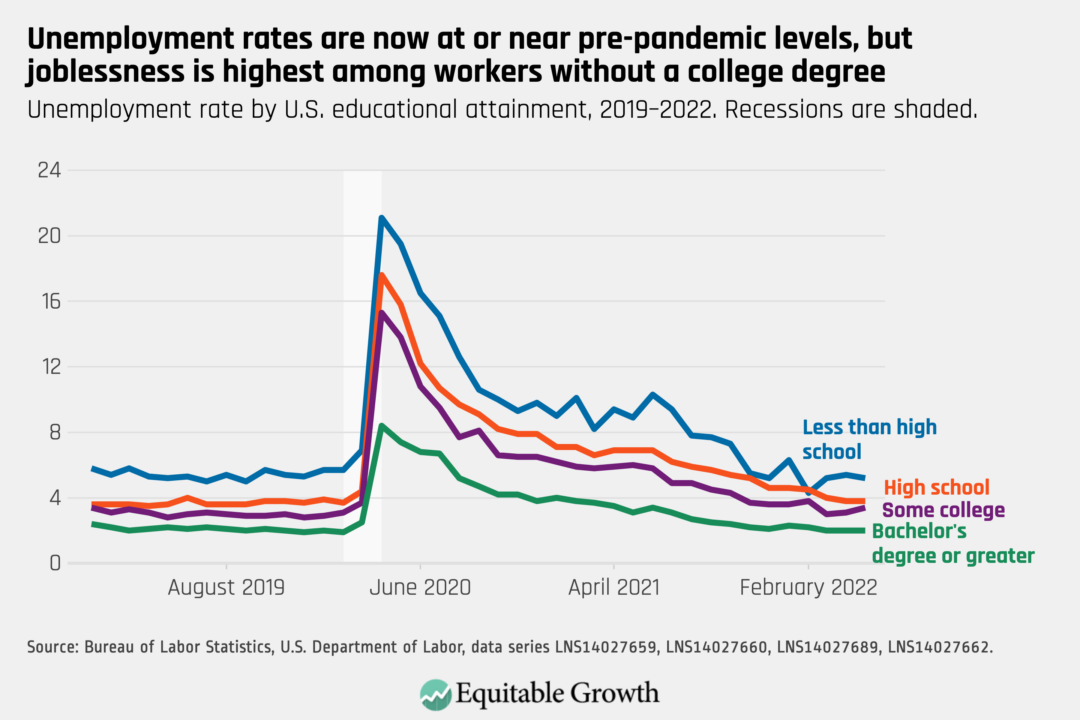
Unemployment rates are now 5.2 percent for workers with less than a high school degree and 3.8 percent for high school graduates. The unemployment rate is 3.4 percent for workers with some college, and 2.0 percent for college graduates.
Employment in many major industries is now back to or surpassing pre-pandemic levels, including construction, retail, and educational services. Employment in leisure and hospitality, however, has yet to recover.
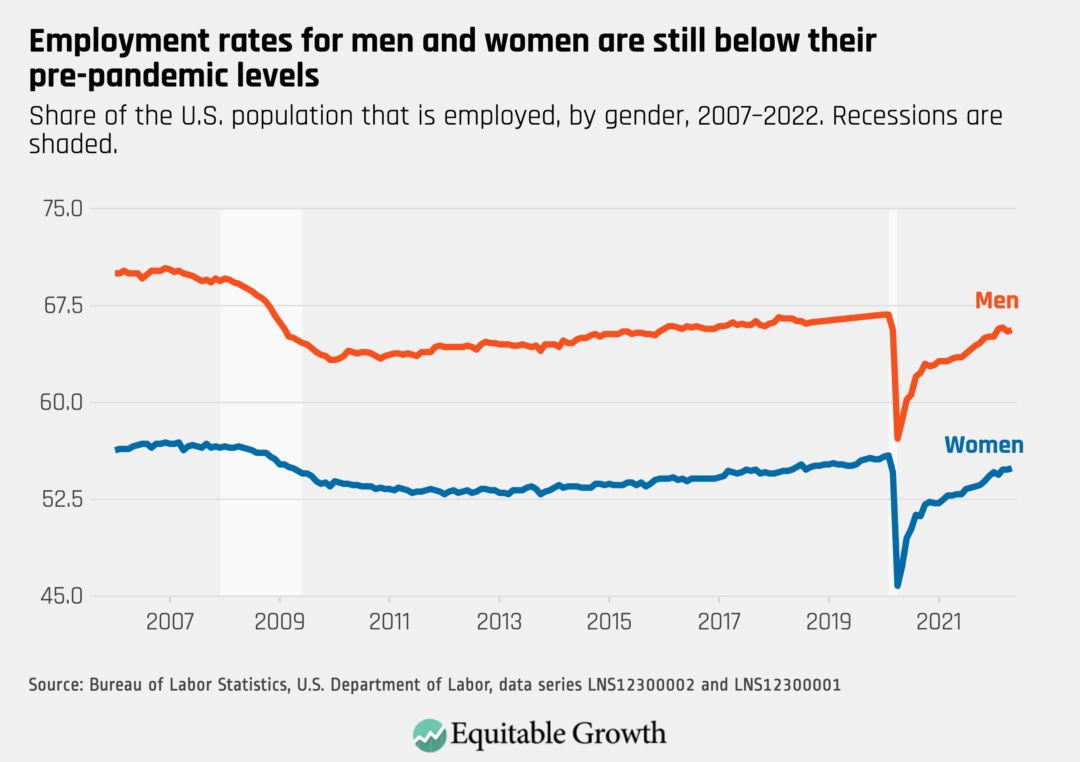
The employment rate increased slightly in May to 65.6 percent for men and 54.9 percent for women, remaining below pre-pandemic levels for both groups.
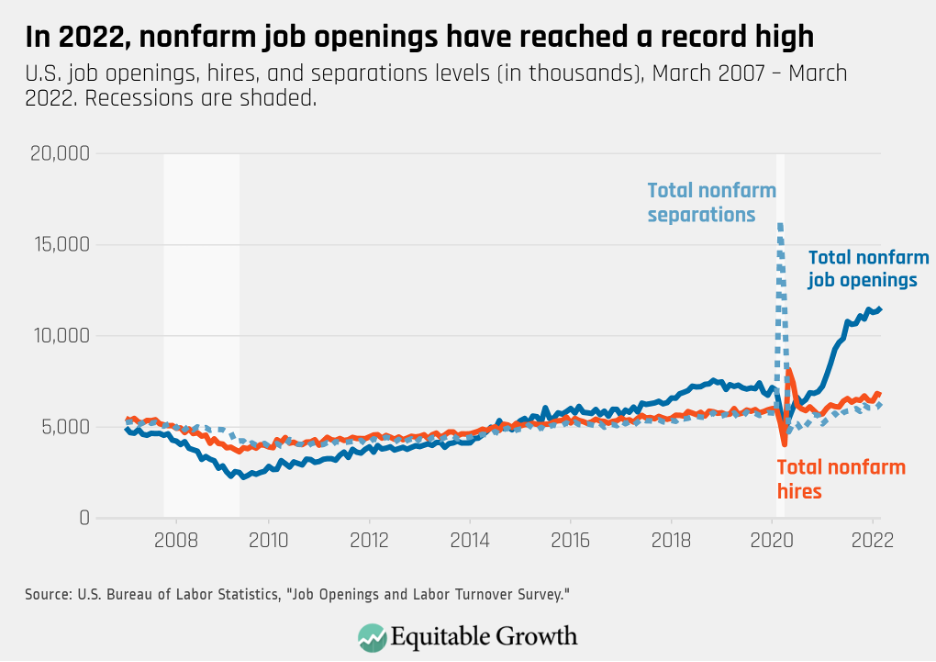
Every month the U.S. Bureau of Labor Statistics releases data on hiring, firing, and other labor market flows from the Job Openings and Labor Turnover Survey, better known as JOLTS. Today, the BLS released the latest data for April 2022. This report doesn’t get as much attention as the monthly Employment Situation Report, but it contains useful information about the state of the U.S. labor market. Below are a few key graphs using data from the report.
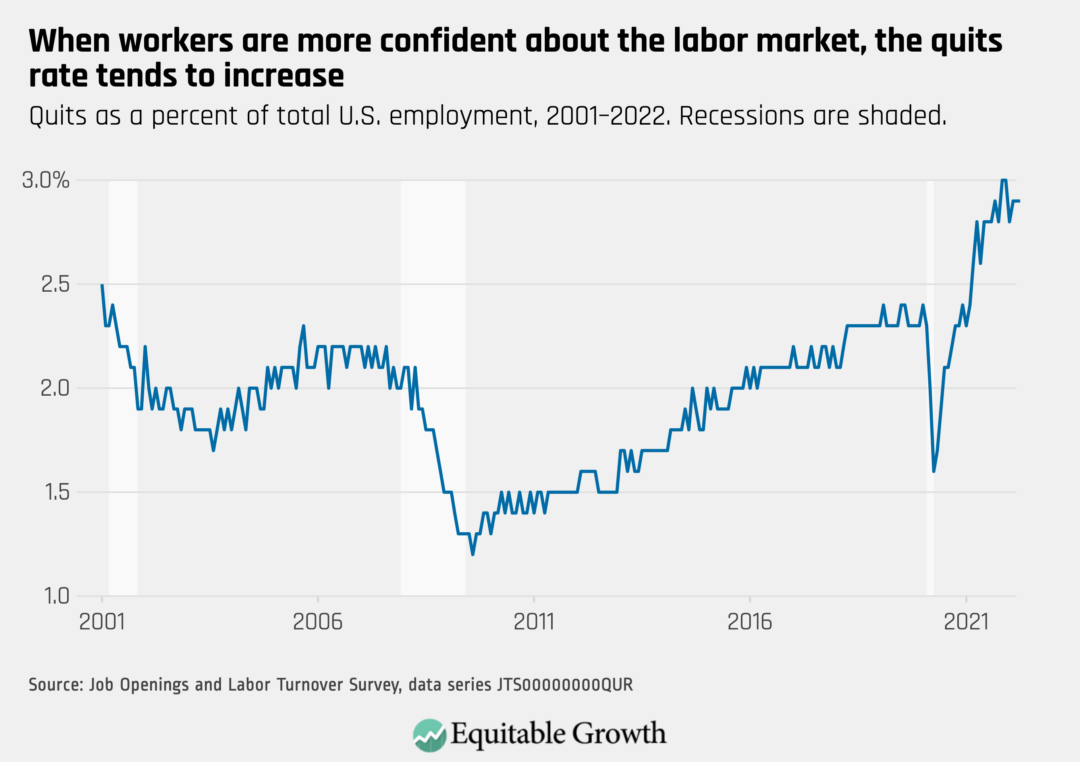
The quits rate remained steady at 2.9 percent as 4.4 million workers quit their jobs in April.
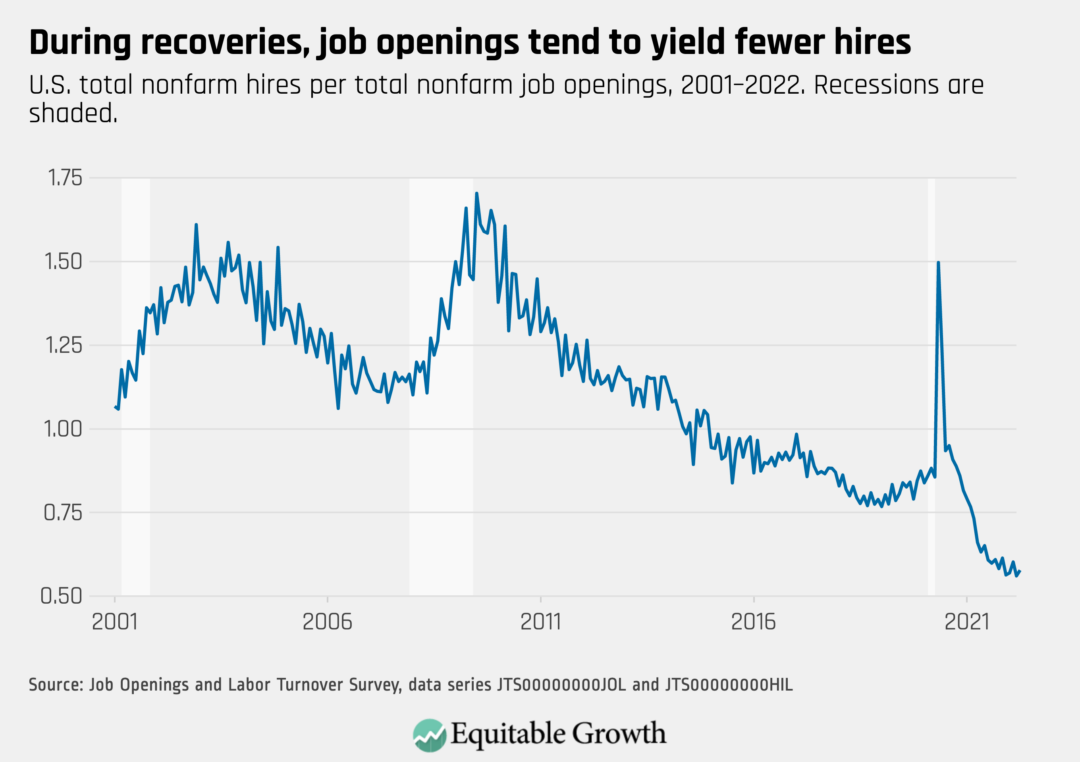
As job openings declined to 11.4 million and hires remained at 6.6 million, the vacancy yield increased to 0.58 in April from a series low of 0.56 in March.
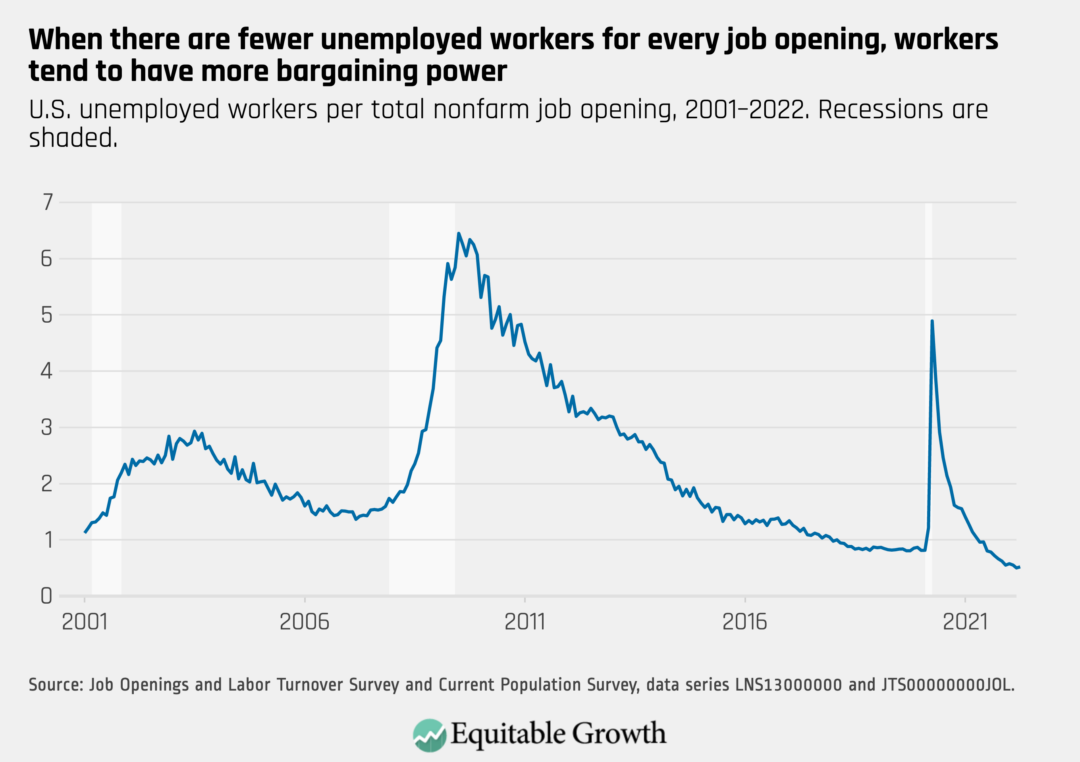
There were 0.52 unemployed workers for every job opening in April, rising from 0.50 the previous month.
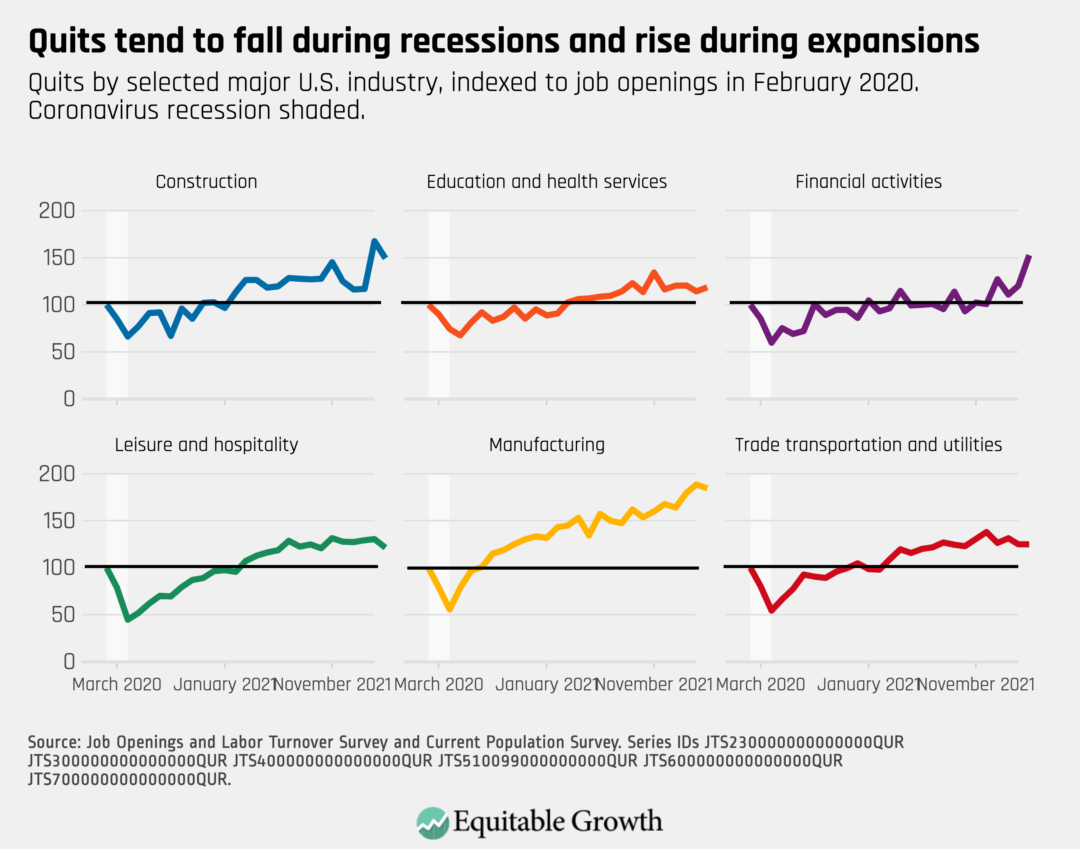
The total number of quits remained steady in April, rising in some industries, such as financial activities, and beginning to fall in others, such as manufacturing and construction.
Claims of a “skills gap” or “labor shortage” in the United States are often cited during times of high unemployment as the reason why workers are unable to find jobs and to explain rising wage inequality more broadly. For instance, in the years immediately following the Great Recession of 2007–2009, a skills gap or “mismatch” was often cited as a major reason for the labor market’s slow recovery after the end of that 2-year economic downturn in 2009.
Yet today, with wages for non-college-educated workers on the rise and their unemployment rate falling, there are still reports of a skills shortage preventing employers hiring workers for jobs that do not require a college degree. These vague and often contradictory claims of skilled labor gaps, shortages, and mismatches remain common in industry discussions even though they do not make sense when applied to actual conditions in U.S. labor markets.
When employers have difficulty finding workers to hire at the wages and working conditions offered, viewing this as evidence of a skilled labor shortage lasting years or even decades runs contrary to our understanding of labor market models and years of economic research. So, let’s look at the actual evidence.
What economic evidence can tell us about skills gap and labor shortage concerns
The concept of a skilled labor shortage assumes a static world of unchanging supply and demand, which Peter Cappelli at the University of Pennsylvania’s Wharton School of Management describes as “akin to input–output models associated with operations research optimization exercises,” instead of a dynamic labor market. This framing interprets factors such as wages, job vacancies, and job requirements as fixed and immutable, when these are changing and dynamic aspects of any labor market.
Take job requirements. Research shows that employers often raise requirements during times of high unemployment, leveraging slack in the U.S. labor market to demand higher levels of credentials without commensurate compensation—even though workers without credentials or at different skills levels may be very well able to succeed at those roles.
Indeed, amid the Great Recession and the subsequently slow economic recovery, Alicia Sasser Modestino of Northeastern University, Daniel Shoag of Harvard University, and Joshua Balance of the Federal Reserve Bank of Boston found that higher unemployment alone accounted for up to a quarter of the increase in job skill requirements between 2007 and 2010. The same authors also found evidence of the inverse—“downskilling”—from 2010 to 2014 as the labor market recovered, though many higher requirements remained.
More recently, the Burning Glass Institute found that the share of job postings in the United States requiring degrees or other credentials fell between 2017 and 2019, which continued into the pandemic. In fact, the report found that fewer jobs required a college degree in 2021 than in 2017. The report’s findings suggest that many U.S. employers are using bachelor’s degree requirements as proxies for specific soft skills, such as written or oral communication skills.
Meanwhile, the actual gap—between skills gap narratives and labor market realities—is, unfortunately, not new. In a 2015 article, University of Maryland economist Katharine Abraham showed that policymakers and business groups have diagnosed the labor market with this type of structural skills mismatch during periods of high unemployment following the dot-com crash in the early 2000s, the recession in the early 1980s, and even back to the mid-1960s.
Walking through relevant economic research, Abraham finds no evidence of a structural skills gap, supply-demand mismatch, or labor shortage, despite such shortages being taken “as a given” in industry and policy discussions. Despite this lack of economic evidence, skills gap and labor shortage narratives persist and do real harm to workers and the country’s economic growth. These narratives diagnose companies’ hiring problems as a matter of worker characteristics, despite clear economic evidence to the contrary—even treating rising wages for very low-wage workers as a problem to be solved.
More fundamentally, these “gap” narratives prevent companies and policymakers from identifying and addressing the underlying causes of these companies’ hiring and retention difficulties. Fortunately, they need not look far to understand what’s really happening in U.S. labor markets.
A closer look at acute staffing shortages in U.S. labor markets
While seasonally adjusted job vacancies are at their highest level since the U.S. Bureau of Labor Statistics began reporting this data series in December 2000, hiring is also very strong and above pre-pandemic levels. This strong hiring is taking place in a labor market that is still recovering from the dramatic job losses of March 2020. As Equitable Growth’s chief economist and Labor Market Policy Director Kate Bahn recently explained on NPR’s Planet Money, “as quick as the crisis led to an economic decline, the quick recovery, too, is just going to have some tumultuousness to it because it takes a long time to get workers into good jobs.”
Now, many employers are trying to increase staffing to meet rebounding consumer demand. As a closer look at several industries shows, though, this hiring is taking place on top of the turnover-driven hiring needs that have been exacerbated by the stress and volatility of the past 2 years. (See Figure 1.)
Figure 1
Many of the currently acute staffing shortages are in service jobs in retail and in leisure and hospitality—two volatile, low-wage sectors with many front-line workers and longstanding job-quality issues. The job opening rate in accommodation and food services, in particular, is almost 10 percent. Many workers in these sectors have been changing jobs to obtain higher wages and better working conditions within and between industries, as many did prior to the pandemic.
Hiring difficulties in construction and trucking are also not new, but their renewed urgency in this phase of the current economic recovery highlights how such persistent hiring difficulties are still blamed on skill shortages despite clear market signals that job quality was to blame. Both of those sectors of the U.S. economy could offer relatively higher wages for non-college-educated workers, particularly for mid-career workers onward, but retention for entry-level workers is low due to poor pay and difficult or dangerous working conditions.
Employment levels for many care workers also remain far below pre-pandemic levels. Nursing homes and other long-term care facilities, which are consistently epicenters of the continuing COVID-19 pandemic, continue to experience “critical” staffing shortages as more recent stresses and burnout build on years of persistently low wages, overwork, and poor working conditions. Here, the job-quality issues are also the result of specific market failures, as economists Sandra Black at Columbia University and Jesse Rothstein at the University of California, Berkeley demonstrate, tied to lack of public investment for this consistently undervalued workforce.
Improving job quality in high-turnover industries is key to a full U.S. labor market recovery
In each of the industries outlined above, the evidence is lacking to claim that an absolute shortage of qualified workers is the problem in the U.S. labor market today. Indeed, workers in these industries are choosing to work elsewhere in response to better wages and working conditions on offer. Employer responses such as increasing compensation and offering on-the-job training are, in the words of U-Penn Wharton’s Cappelli, overdue “standard textbook solutions” from a business perspective, which would be expected in a fully functioning labor market.
In fact, this recent rise in wages for many non-college-educated workers underscores a body of research that shows the wage “premium” associated with having a college degree is inextricably tied to declining labor protections and bargaining power for low-wage workers without a degree—not the inherent value of the degree itself. This is why it is crucial to enhance job quality, labor standards, and the ability of workers to organize going forward, so that all workers can be competitively compensated for their education, skills, and experience.
Within the private sector, U.S. employers can reevaluate exclusionary hiring practices, train incumbent workers, and improve job quality to increase retention and reduce turnover costs. To support these efforts, policymakers can improve labor standards, encourage “high-road employment,” and invest in enforcement against bad actors so that high-road employers aren’t disadvantaged in the market.
Evidence also shows that unions reduce income inequality and protect workers. And public investments in health, education, care work, and other vital areas experiencing market failure will also be necessary to improve job quality and meet public need.
Improving wages, benefits, and working conditions can have spillover benefits for consumers and communities as well. A working paper by Equitable Growth grantee Krista Ruffini of Georgetown University finds that minimum wage increases not only improved worker retention at nursing homes but also led to better health and safety practices and reduced deaths among residents.
What’s more, there is accumulating evidence that the challenges employers experience in hiring workers may go beyond individual companies’ willingness to raise wages. The University of Maryland’s Abraham suggests that an alternative explanation for employers’ experiences of hiring challenges is actually a lack of competition in the labor market itself—an imbalance of power economists describe as monopsony, which leads to both lower employment and lower wages than would otherwise exist.
Equitable Growth is committed to building a community of scholars working to understand how inequality affects broadly shared growth and stability. To that end, we have created the monthly series, “Expert Focus.” This series highlights scholars in the Equitable Growth network and beyond who are at the frontier of social science research. We encourage you to learn more about both the researchers featured below and our broader network of experts.
There are more than 1.6 million Native Hawaiians and Pacific Islanders currently living in the United States, and approximately 370,000 people in the predominantly Pacific Islander-populated U.S. territories and freely associated states in the Pacific region. As demonstrated in the Map of Colonial Impact published by Empowering Pacific Islander Communities—an organization that engages NHPI communities in culture-centered advocacy, leadership development, and research—the economic realities of these communities is shaped by the many diverse and complicated relationships between the U.S. government and ancestral NHPI lands.
The U.S. Census Bureau and other federal agencies, as well as some state and local agencies and universities, now collect disaggregated data on 21 distinct Native Hawaiian and Pacific Islander ethnic groups related to median income, employment rate, and educational attainment, among other socioeconomic indicators. Collecting and using such administrative data is vital for researchers to examine the experiences of NHPI populations and for policymakers to develop and target policies that address the economic challenges that NHPI communities face. Many of these hurdles stem from intentional policy choices made over the years and carefully constructed political institutions that uphold structural racism and pervasive discrimination in the United States.
May is AANHPI Heritage Month in the United States. This month’s installment of Expert Focus highlights community leaders and scholars across disciplines doing research on NHPI populations and their experiences in the United States. This includes work on COVID-19’s disproportionate impact on NHPI communities, community-based economic development, Indigenous history, and using Indigenous knowledge to combat climate change and guide sustainable development efforts.
Such research demands insights from across the social sciences, health, history, law, and interdisciplinary fields, such as environmental studies and ethnic and gender studies. And this research must be grounded in Indigenous rights, histories, and knowledge to guide the creation of inclusive and equitable policies for these communities.
This interdisciplinary research will be even more telling if paired with an increase in the diversity of scholars from NHPI backgrounds studying these topics. As Randy Akee, an associate professor in the Department of Public Policy and American Indian Studies at the University of California, Los Angeles and an Equitable Growth grantee, recently wrote:
One of the many pitfalls of not having diversity among researchers is that certain areas of research, outcomes, and evaluation tend to be forgotten—many of which could inform future research and policy decisions. … These areas of unexplored research opportunities are often only known to the communities in which they are being put into practice, which means that without researchers from those communities, they will probably remain unknown.”
Hōkūlani Aikau
University of Victoria, British Columbia
Hōkūlani Aikau is a professor of Indigenous governance at the University of Victoria, British Columbia. Her research focuses on contemporary Native Hawaiian identity and politics, Indigenous resurgence and climate change in the Pacific, U.S. race relations, and the restoration of Indigenous food systems, specifically Native Hawaiian kalo (taro) cultivation. She has written extensively on the experience of Native Hawaiian and other Indigenous peoples, incorporating theories and themes from Indigenous feminist theory, gender studies, and religion.
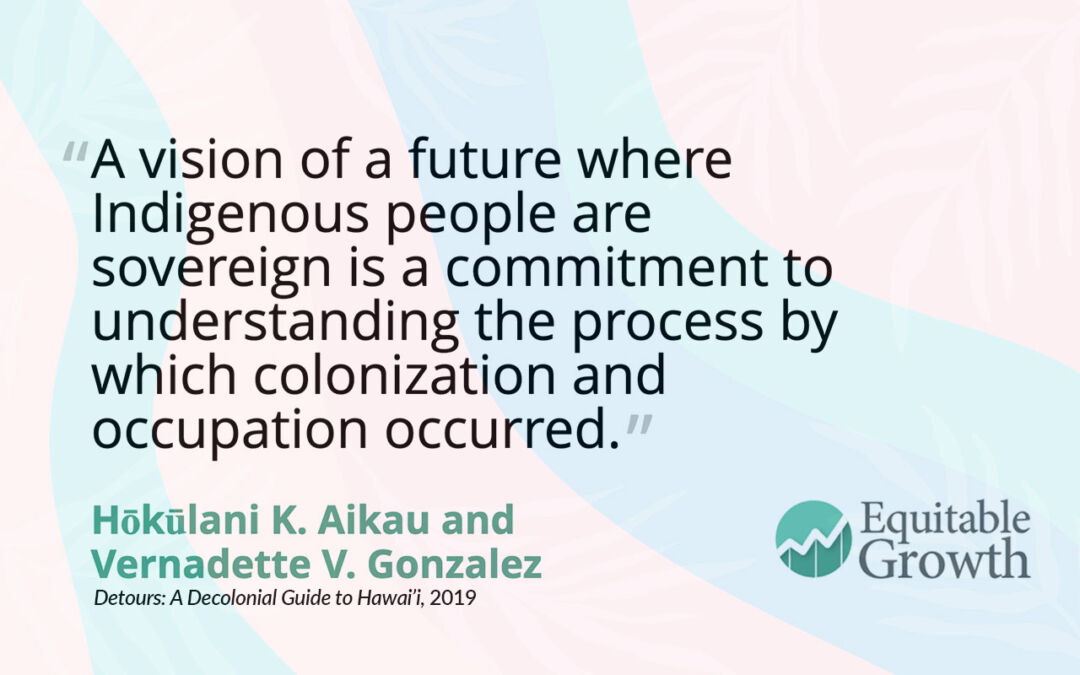
Aikau’s forthcoming book, Indigenous Resurgence in an Age of Reconciliation, co-authored with Heidi Kiiwetinepinesiik Stark and Aimée Craft, will examine the central concerns and challenges facing Indigenous nations in their resurgence efforts and seeks to center the work, knowledge, and strategies for resurgence of these communities. She is also the co-editor of the 2019 book, Detours: A Decolonial Guide to Hawai’i, a guide for decolonization in which Hawaiian artists, activists, and scholars direct tourists to places and experiences that highlight the complex and fraught history that Native Hawaiians have with colonialism, military occupation, food insecurity, high costs of living, and climate change.
Sefa Aina
Pomona College
Sefa Aina is the associate dean of students and director of Draper Center for Community Partnerships at Pomona College, as well as the director of the Asian American Resource Center. He is an accomplished activist and educator in the Asian American and Pacific Islander community. He is also a board member of Empowering Pacific Islander Communities and a founding member of the National Pacific Islander Education Network, an organization that works to help Pacific Islander students pursue their educational goals, including through mentorship and networking.
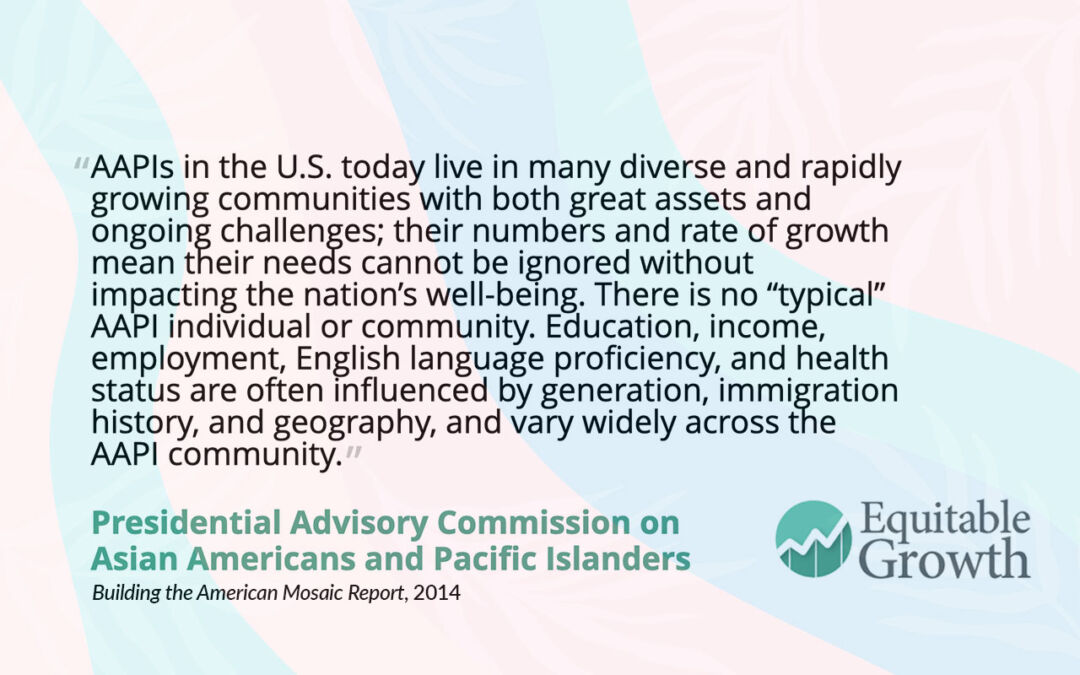
Aina has spent much of his career supporting and cultivating opportunities for nontraditional, marginalized, and first-generation college students, including establishing a leadership pipeline for Pacific Islander students to access internship and fellowship opportunities in Washington, D.C., California, and Hawaii. From 2010 to 2014, he served as vice chair of then-President Barack Obama’s Advisory Commission on Asian Americans and Pacific Islanders, advising the administration on ways to improve quality of life for Asian American, Native Hawaiian, and Pacific Islander groups through federal initiatives and likewise to boost the involvement of these communities in these programs.
Kamanamaikalani Beamer
University of Hawaii at Mānoa
Kamanamaikalani “Kamana” Beamer is a professor at the Center for Hawaiian Studies at the University of Hawaii at Mānoa and the Dana Naone Hall chair in Hawaiian studies, literature, and the environment. His research centers on Indigenous agency and Hawaiian economic development, as well as governance, land tenure, and resource management in Hawaii. Beamer is a founder of Aloha Kuamoʻo ʻĀina, a community based non-profit focused on social justice and ecological peace for Hawaiʻi. As co-founder of ʻĀina Aloha Economic Futures, a grassroots organization, he worked to develop a vision for Hawaii’s economic recovery and future grounded in a core set of values and in bringing community together.
Beamer is an ongoing collaborator on the Circular Economy study, mixing this modern economic approach with the Indigenous principles of “aloha ‘āina”—respect, reverence, and justice—to build sustainable, efficient systems. Reflections on this work will be published this summer in Ecology and Society, in an article titled “Island and Indigenous systems of circularity: How Hawai’i can inform the development of Universal Circular Economy Policy Goals.”
David Aiona Chang
University of Minnesota
David Aiona Chang is a professor of history at the University of Minnesota. His research specialties are race and nationalism, Indigenous and Native Hawaiian peoples and history, U.S. colonialism, and borders and migration in Hawaii and North America. In his most recent book, The World and All the Things Upon It: Native Hawaiian Geographies of Exploration, Chang studies the ways that Native Hawaiians explored the outside world after European colonizers landed on the islands’ shores in the late 18th century.
His current research projects include an examination of the relationship between Native Hawaiians and Indigenous communities in Canada and how colonialism complicated the fur trade they established, as well as an anthology of writings on the meaning of indigeneity in various countries written by historians from North America, Latin America, Asia, Africa, and Oceania. Chang’s work examines Indigenous people’s role as active agents of global exploration and migration, and highlights the importance of understanding both Indigenous people and the world more broadly from Indigenous perspectives.
Richard Calvin Chang
University of California, Los Angeles
Richard Calvin Chang is a Native Hawaiian attorney and the data analytics director and co-founding member of the Native Hawaiian and Pacific Islander Data Policy Lab at the University of California, Los Angeles. In 2021, Chang was appointed to the U.S. Census Bureau’s National Advisory Committee on Racial, Ethnic and Other Populations, which considers issues that impact hard-to-reach populations in the United States. His current work focuses on raising awareness of COVID-19’s disproportionate impact on NHPI populations and ensuring the community is accurately represented. He previously worked in nonprofits focused on supporting NHPI communities, including serving as the president (and currently on the Board of Directors) of the Pacific Islander Health Partnership, which educates, trains, and builds the capacity of Indigenous NHPI communities to improve health outcomes, reduce health disparities, and boost access to high-quality healthcare.
Chang also helped found the nonprofit Empowering Pacific Islander Communities, where he co-authored and led the development of the first demographic profiles of Native Hawaiians and Pacific Islanders in the United States, providing an in-depth look at the social, economic, and political challenges and opportunities of these groups to better inform policy and advocacy. Much of his work focuses on data disaggregation for subgroups of Asian American and Native Hawaiian and Pacific Islander populations, acknowledging that these different groups fare differently across the U.S. economy, labor market, and society.
Michelle Ka’uhane
Hawaii Community Foundation
Michelle Ka’uhane is the senior vice president of Community Grants and Initiatives at the Hawaii Community Foundation, an organization dedicated to investing in and strengthening Hawaii’s communities. In this role, she leads the organization’s grant-making process via its CHANGE framework, through which nonprofits doing work in six main areas—Community and economy, Health and wellness, Arts and culture, Natural environment, Government and civics, and Education—received approximately $7 million in funding in 2021 alone. She previously served as president and chief executive officer of the Council for Native Hawaiian Advancement, where she focused on deploying capital in underserved Native Hawaiian communities across Hawaii.
Throughout her career, Ka’uhane has worked to support vulnerable communities in Hawaii and improve economic outcomes among Native Hawaiians. She is currently a commissioner for President Biden’s Advisory Commission on Asian Americans, Native Hawaiians, and Pacific Islanders, a U.S. Department of Health and Human Services committee that advises the Biden-Harris administration on issues of equity, justice, and anti-discrimination for AANHPI communities. She also serves on the Community Advisory Council at the Federal Reserve of San Francisco to offer perspectives on the economic and financial-service needs of low- and moderate-income populations in Hawaii.
Equitable Growth is building a network of experts across disciplines and at various stages in their career who can exchange ideas and ensure that research on inequality and broadly shared growth is relevant, accessible, and informative to both the policymaking process and future research agendas. Explore the ways you can connect with our network or take advantage of the support we offer here.
The Federal Reserve Bank of Minneapolis recently hosted a conference, “Unequal Inflation Impacts,” at which an illuminating set of presentations and additional research sources explored “the ways inflation puts different pressures on workers and families depending on where they live, what they earn, and how they spend” in communities across the United States. For scholars and policymakers interested in the complexities of this topic, I highly recommend the video presentation of the event, alongside the entirety of the resource materials provided by the regional Federal Reserve bank’s Opportunity and Inclusive Growth Institute.
Three of the presentations stood out for me because of how they highlight that the headline inflation number followed so closely fails to capture the full experience of inflation. Just as growth in the Gross Domestic Product fails to describe the fortunes for the vast majority of Americans, the Consumer Price Index fails to capture the diverse experience of inflation.
Let me briefly summarize each of these presentations before discussing why their findings are particularly important amid today’s inflationary pressures. All three of the presentations and their underlying research may help researchers and policymakers better understand the dynamics of consumption volatility among different groups of U.S. workers and their families.
The key takeaway in Lee, Macaluso, and Schwartzman’s “Price Volatility Faced by Black and White Households” is the finding that Black households face more frequent price changes and less certainty in those prices than White households. Specifically, a good consumed by a Black household changes price once every 8.07 months, compared to once every 8.51 months for a White household.
“The differences, while not overwhelming, are not trivial either,” they find. “If prices paid by White households increase by 7 percent over a year, our calculations suggest that one may expect them to increase by 7.5 percent for Black households,” the co-authors conclude. They then note this difference “informs the trade-off between inflation and unemployment stabilization for White and Black households.”
For policymakers in particular, the co-authors say their findings imply “that when evaluating trade-offs between inflation and unemployment, one ought to keep in mind that the costs of inflation may be borne disproportionately by the more disadvantaged group.” This exhortation applies to unemployment, not just inflation, as the unemployment rate for Black individuals is higher, too. The members of Federal Open Market Committee should consider these disparate impacts when debating future interest rate changes.
Argente and Lee’s “Cost of Living Inequality beyond the Great Recession” offers a detailed look at the impact of inflation on the real incomes (after adjusting for inflation) of U.S. households across different income groups. The time period of their research on household expenditures by income group—from prior to the onset of the Great Recession through 2019—was marked by very limited inflationary pressures in the U.S. economy. Yet, even so, they find that “inflation disparities across income groups have been relevant over the last 15 years in the consumer goods sector,” with the worst outcomes for households with earnings below $50,000 a year.
What’s more, the two co-authors find that the gap between this income inequality as it relates to inflationary pressures “moves closely with the unemployment rate in the United States.” They add, however, that “in the aftermath of the Great Recession and before the COVID-19 pandemic, low-income households were able to reduce the prices they paid for identical goods relative to prices paid by high-income households through their shopping behavior.” Amid the current bout of inflation, this may no longer be so easy to do for low-income households.
Their policy takeaway? Amid the continuing COVID-19 pandemic, they note that as prices increase for necessities, such as groceries, expenditures on luxury goods can often be postponed but “expenditures on necessities cannot, and they account for a large share of the consumption of low-income households.” They also note that “high-income households are more likely to adjust their shopping behavior by taking advantage of new technologies, such as e-commerce, that enable them to find lower prices.”
Larsen and Molloy, in their presentation “Differences in Rent Growth by Income Between 1985 and 2019 and Implications for Inflation,” zero in specifically on inflationary pressures in U.S. home rental markets. Securing a roof over one’s head is a major household expenditure and accounts for 30 percent of spending in the Consumer Price Index, they note. They investigated changes in housing costs over time among households up and down the income ladder and how those households vary their spending on housing based on rental housing inflation.
Offering a number of caveats based on the limitations of their data analysis and the need for further research, the co-authors find “that differences in rent growth and the fraction of expenditures devoted to housing have not led to material differences in [housing] inflation across income groups over the past three decades.” This finding is in contrast with prior economic research. They attribute their contrary findings to “geographic differences in housing costs [that] overstate the differences in rent inflation faced by households in different income groups.”
Their most telling takeaway for policymakers is how their findings relate to income inequality across communities among different income groups. They note that as “lower-income households respond to rising rents by moving to less expensive locations, the average rent paid by this group will put a growing weight on lower-rent areas while the average rent paid by high-income households will put a growing weight on higher-rent areas.” These differences across groups in average rent paid can increase, they add, even though rental inflation by geography growth does not.
These three presentations do not fit neatly into a summation of all the different inflationary pressures facing U.S. workers and their families due to income inequality and racial disparities. Yet, taken together, they do highlight where policymakers need to concentrate their focus and where further research is needed. Both efforts will be critical as the U.S. economy grapples with inflationary pressures and the Federal Open Market Committee continues to raise interest rates this year.
Indeed, there are immediate issues at hand for the Fed. Jacob Orchard, a Ph.D. candidate in economics at the University of California, San Diego and a 2019 Equitable Growth grantee, in his new working paper, “Cyclical Demand Shifts and Cost of Living Inequality,” models pricing pressures on household goods and finds that due to inflation, “low-income households are hit twice by recessions: once by the recession itself and again as their price index increases relative to other households.”
In good news, pressure is building for an inflation measure that captures these differences. The National Academies of Sciences, Engineering, and Medicine issued a recent report detailing ways to modernize inflation, including producing different inflation by income level.
And then, there are more medium- to long-term questions to be answered about inflation and its links to consumption inequality and the stratification of economic mobility among U.S. workers and their families due to income, race and ethnicity, and gender. In my recent work with National Academies economist David Johnson, University of Wisconsin economist Tim Smeeding, and Federal Reserve Bank economist Jeff Thompson, we look at consumption inequality since 1989 and consumption by race.
What we find is that consumption inequality increased after the Great Recession of 2007–2009. This may understate inequality growth if low-income households face a higher inflation rate because their money does not go as far, and also may overstate the well-being of Black households even though they are already disproportionately in the bottom of the consumption distribution because they face higher inflation. Factoring in rising inflationary pressures in today’s U.S. economy will be an important piece of future research.
Large investment management companies such as BlackRock Inc., The Vanguard Group Inc., and Fidelity Investments—each with tens of trillions of dollars of assets under management—offer a wide array of mutual and index funds and other diversified investments that provide a valuable product to investors. Because investment decisions are delegated to professional asset managers or the funds mirror the composition of broad indices or specific industries, these products offer a cost-effective way for retail investors to diversify their wealth.
In our latest research, we show that this diversification may come with a hidden price tag for consumers and the broader U.S. economy. It might be undermining competition across the U.S. economy, resulting in higher prices for average consumers.
The intuition is straightforward. Suppose that firms make supply or pricing decisions with the objective of maximizing shareholder value. Consider, then, a mutual fund invested in the automotive industry that happens to be the largest stockholder of Ford Motor Co., General Motors Co., Toyota Motor Corp., and Volkswagen AG. Would this mutual fund be better off if these four companies competed aggressively? Clearly not. By competing aggressively, the companies would be trying to maximize their own profits but eroding the portfolio profits earned by their shareholders.
The canonical assumption adopted by both microeconomists and macroeconomists (like ourselves) is that firms act to maximize their own individual profits as opposed to shareholder value. While in everyday parlance, we tend to use these two concepts interchangeably, the example above clearly demonstrates how, in the presence of common ownership—an ownership arrangement in which large investors own shares in several firms that compete with each other—these two alternative assumptions will produce radically different outcomes in the product market.
This observation leads to a fascinating thought experiment. Imagine there were a magic switch allowing us to control whether all public firms in the United States maximized individual profits or shareholder value. What would happen if we toggled the switch from “profits” to “shareholder value,” and vice versa? How would the pricing and production decisions of firms change? And what would be the resulting effect on consumer welfare?
The result of this thought experiment has real-world policy implications. Recent research shows that there has been a dramatic increase in the extent of common ownership among U.S. publicly traded firms. BlackRock and Vanguard, for example, are now among the top five shareholders of almost 70 percent of the largest 2,000 publicly traded firms in the United States today, compared to 20 years ago, when that number was close to 0 percent for both firms. What are the product market and distributional implications of this phenomenon? Unfortunately, magic switches such as the one described above do not exist in real life—but that is why economists use models.
In our new working paper, “A Tale of Two Networks: Common Ownership and Product Market Rivalry,” we build a novel macroeconomic model in which firms compete oligopolistically to maximize shareholder value or profits. Our model leverages two extremely large datasets that provide us with a “map” of the competitive landscape for U.S. public corporations.
The first of these two datasets is available due to the seminal work of economist Gerald Hoberg at the University of Southern California and business administration professor Gordon Phillips at the Tuck School of Business at Dartmouth College, which provides a metric of the extent to which any two publicly traded firms produce competing products. It thus represents the network of product market rivalries among public corporations. The latter dataset comes from digitized U.S. Securities and Exchange Commission forms 13(f) and provides information about how many shares large asset managers own in each publicly traded firm.
Our model allows us to toggle that magic switch and simulate the “deadweight losses” due to the anticompetitive effects of common ownership. A deadweight loss in economics is the loss to society (in dollars) generated by some market inefficiency, which results from firms charging higher prices than they would in a competitive market.
The important caveat here is that our model cannot detect what objective—profits, shareholder value, or even something entirely different—that firms actually maximize. (Multiple working papers, however, already exist that analyze the evidence of common ownership effects in specific industries, among them the airlines and the ready-to-eat cereal industries.) Our objective is to neither replicate nor dispute any of these industry-level findings. Instead, our study addresses a new research question and tries to provide a dollar estimate of the economywide impact of common ownership.
We find that in 2018, common ownership among big investment management companies raised producers’ profits by an estimated $378 billion, lowered the consumer surplus by $799 billion, and generated a deadweight loss amounting to 4 percent of total surplus produced by U.S. public corporations in 2018, compared to 0.3 percent in 1994.
It is also easy to see how common ownership is likely to have significant distributional effects that primarily hurt the less wealthy. The top 10 percent of wealth-holders in the United States owns an estimated 89 percent of all stocks and mutual funds, with the wealthiest 1 percent owning 54 percent of those assets. At the same time, 42 percent of all Americans owns no stocks—individual stocks or stocks included in a mutual fund or retirement savings account, such as an 401(k) or IRA—at all.
The more affluent are at least somewhat hedged from the anticompetitive common ownership effects because they make up for the loss in consumer surplus through larger capital income returned to them as shareholders. For the least wealthy, the loss in consumer welfare is more likely to go unmitigated.
Like every model, ours requires assumptions. An important one is how each firm weighs the interests of different shareholders. Does the firm weigh institutional investors in proportion to the shares they own in the company, or does it give, for example, a greater-than-proportional weight to its largest shareholders or block-holders? We study how sensitive our estimates are to these varying corporate governance assumptions. While the specific numbers can vary, what does not change is the qualitative finding that common ownership has the potential to cause significant inefficiencies and consumer harm. This finding also is robust to different assumptions about fixed costs of firms and their intangible capital assets.
There is an active debate among economists, legal scholars, financial analysts, and antitrust and financial regulators alike about the specific mechanisms through which common ownership lessens competition. Some possibilities are that uncompetitive practices might be encouraged directly through active corporate oversight or indirectly via compensation schemes that do not sufficiently encourage top managers to compete. These remain highly relevant possibilities but are also controversial, given the large competitive and distributional effects of common ownership.
Our findings, combined with investments continuing to pour into large, diversified funds, suggest that antitrust policy and financial regulation may have to address this new challenge. Academic research is only beginning to scratch the surface when it comes to the welfare effects of common ownership. Various other consequences of common ownership on firm decision-making, including labor market power, innovation, firm productivity, and cost efficiency, and dynamic collusion incentives are still waiting to be investigated.
In light of the meteoric rise of common ownership and its relevance for antitrust policy and financial regulation, our paper presents several reasons for lawmakers and regulators to pay attention to this issue.
—Florian Ederer is an associate professor of economics at the Yale School of Management. Bruno Pellegrino is an assistant professor of finance at the University of Maryland’s Robert H. Smith School of Business.
This summation of a joint roundtable discussion was written in partnership with The Century Foundation.
Now, more than 2 years after the start of the COVID-19 pandemic in the United States, workers, academics, and policymakers alike are still figuring out its full implications on the U.S. labor market. Going forward, understanding what changes occurred, which ones are temporary and which are permanent, and what the labor market will look like in the years ahead will be of great importance for the well-being of U.S. families and the broader U.S. economy.
Dubbed by many observers not as a recession but as a “she-cession,” the COVID-19 pandemic’s effects on U.S. society and the economy—including school closures, child care disruptions, shifting caregiving responsibilities, and massive layoffs in the service and hospitality sectors, among others—have been disproportionately borne by women. Intersecting oppressions, including structural and ongoing racism, mean the impacts are felt even more by Black, Latina, and immigrant women. The personal effects of these challenges have been clear from the start, but the ways in which they translate to the labor market, families’ economic security, and the economic recovery are areas for further study.
A new working paper by Harvard University’s Claudia Goldin, for example, finds that, contrary to some expectations, women overall did not significantly exit the labor force or reduce their work relative to men during the COVID-19 pandemic. The COVID-19 recession was a “she-cession,” Goldin finds, not because women fared much worse than men in aggregate employment or labor force participation, but because women were more affected relative to past recessions, which traditionally spared women-led sectors of the U.S. economy to a greater degree. While many women remained in the workforce over the past 2 years, the added stress of the pandemic, caregiving responsibilities, household duties, and remote schooling—on top of regular employment—disproportionately took a toll on women’s well-being and mental health.
Of course, aggregate data do not speak to the varied labor market experiences of working women across the United States. Workers of color, parents and other caregivers, workers with lower educational attainment, as well as those workers relying on part-time employment and employed in certain occupations faced worse labor market outcomes than the aggregate or averages suggest. The mechanisms that contributed to these disparities require continued study both to better understand them and to help craft an appropriate policy response.
To provide further clarity on the U.S. labor market for women in the pandemic era, The Century Foundation and the Washington Center for Equitable Growth co-hosted the Women’s Racial and Economic Justice Roundtable, bringing together more than 40 leading policy experts and academics to share data, identify key research questions, and discuss promising strategies for future studies. This column summarizes the key themes and research questions identified at this roundtable, as well as key recommendations for researchers that came out of the event.
How caregiving responsibilities impact labor market decisions and well-being for women and their families
Throughout the COVID-19 pandemic, preexisting fault lines in the U.S. child care market—long plagued by a lack of public investment, leading to high prices, limited access, and low wages—fully ruptured. In the early months of the crisis, the pandemic-induced lockdowns and stay-at-home orders temporarily shuttered some care providers to slow the initial spread of the virus; some never reopened. As the pandemic dragged on, families were forced to make difficult choices around their child care needs amid public health and safety concerns.
Today, employment in the child care sector remains roughly 12 percent below pre-pandemic levels, exacerbating the preexisting capacity crunch for families seeking child care.
Despite these well-documented challenges, further research is needed on how these care responsibilities impacted women’s labor force participation, including work hours, job quality, and overall economic stability, and how that impact varied by racial demographics, family structure, education level, and other characteristics. Roundtable participants suggested that these insights could best be provided by longitudinal or long-term research on this topic.
Research by roundtable participant Misty Heggeness and others at the Minneapolis Federal Reserve, for example, documents how mothers of school-aged children fared similarly to fathers at the start of the pandemic—tenuously balancing work, remote schooling, and child care. But as the pandemic dragged on, mothers who worked remotely were less likely to be actively working, compared to fathers. Such trends would be invisible with research restricted to shorter time-horizons.
Insufficient data and imprecise research on women of color obscures the current state of the labor market
As with past economic downturns, the COVID-19 recession was particularly harmful for workers of color, due to a combination of sector-specific job losses in leisure and hospitality early in the pandemic, preexisting inequalities that make economic shocks more difficult for people of color to weather, and systemically racist practices that impede access to income support programs.
Two years after the end of the COVID-19 recession, the seasonally adjusted unemployment rates, as of April 2022, for Black women of 5 percent and Latina women (3.8 percent) were well above the 2.8 percent rate for White women.
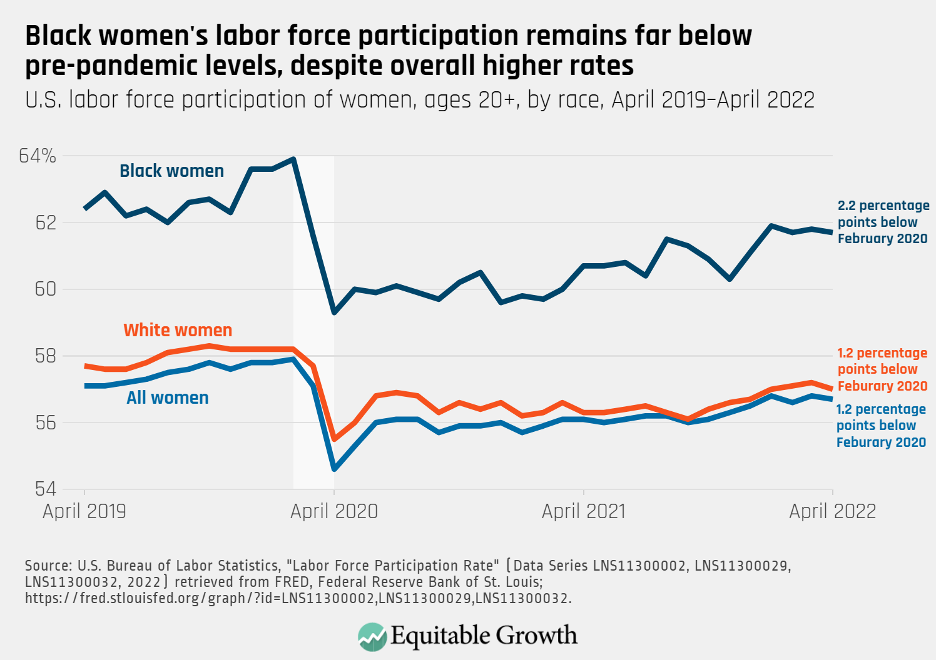
Other data points suggest a more complicated story—at least initially. Black women, and particularly Black mothers, for example, historically have had a consistently higher labor force participation rate than White mothers. Part of the reason for this difference is clear: Policy choices, current laws, and related factors ensure that Black women have needed to work as a matter of economic necessity. A persistent racial wealth gap born from the legacy of slavery and systemic racism, coupled with the fact that two-thirds of Black mothers are the sole or primary breadwinner of their households, compared to only one-third of White mothers, yield greater paid labor among Black women.
Yet despite having an overall higher labor force participation rate, Black women’s labor force participation is down 2.2 percentage points from February 2020, compared to 1.2 percentage points for White women. (See Figure 1.)
Figure 1
A lack of data on workers of color may be obscuring any remaining challenges in the pandemic labor market that would illuminate people’s lived experiences. Such data limitations include the mismatch of datasets that look at relevant variables and a lack of longitudinal data that would follow the same individuals over time to understand how they have fared in the crisis brought on by the pandemic. Roundtable participants stressed the importance of the careful selection of employment outcomes, longitudinal research, and nontraditional data sources to overcome gaps in data for policymakers and researchers to accurately understand the nuances of the labor market experiences of women of color.
In April 2022, for example, employment for Hispanic or Latina women ages 20 and up was just slightly higher than its pre-pandemic level in absolute terms—11,839,000 employed women, compared to 11,831,000 in February 2020—but this number obscures the relative within-group experience of these women in the pandemic labor market. While higher total employment is certainly a boon for the U.S. economy, these figures do not consider the population growth that occurred during the pandemic, and this statistic overstates the job recovery for Hispanic women and Latinas. The employment-to-population ratio—the ratio of the current civilian labor force against the total working-age population—for this group of women workers, for instance, has fallen from 59.1 percent to 56.8 percent over that same period.
Likewise, the lack of accessible longitudinal data that include details on care responsibilities and labor market outcomes makes it difficult to conduct research to understand how the care shock of the early pandemic subsequently shaped people’s employment.
Finally, data on racial and ethnic groups that have relatively smaller populations in the United States, including American Indians and Alaska Natives, are not always collected consistently or in large enough samples for scholars to conduct empirical research that reflects population levels due to lack of statistical significance. The monthly Employment Situation Summary published by the U.S. Bureau of Labor Statistics only recently began publishing data that includes American Indians and Alaska Natives, but these data are not seasonally adjusted due to small sample sizes, so it is difficult to interpret month-over-month variation.
Do declines in ‘pink collar’ jobs stem from lower worker supply or employer demand?
The unique nature of the COVID-19 recession resulted in atypical patterns of job loss, compared to prior recessions. Industries that were once more recession-resistant couldn’t avoid the economic challenges arising from reduced public demand for in-person services, temporary business closures, and the swift and deep recession.
During the Great Recession of 2007–2009, for example, construction and durable goods manufacturing—two sectors employing primarily men—suffered the worst losses amid the housing market crisis. In contrast, during the COVID-19 recession, the leisure and hospitality, health and educational services, and retail sectors that more often employ women, also known as “pink collar” jobs, faced the deepest declines.
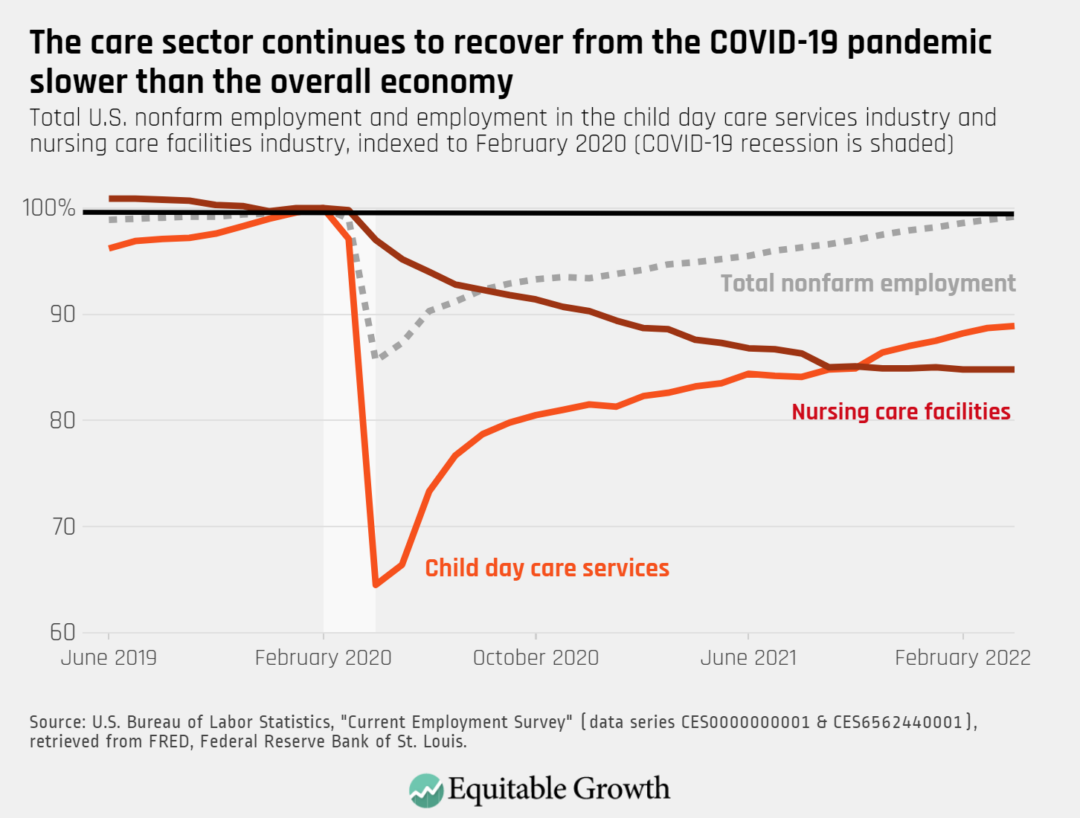
Not all of these jobs have returned. Even though care needs within families do not follow business cycles, many care-sector jobs remain below their pre-pandemic levels. Some of these industries employing primarily women, such as nursing care, are still losing jobs, while others, such as child care, are well below their pre-pandemic levels—even as the rest of the labor market is nearing a full recovery. (See Figure 2.)
Figure 2
Roundtable participants discussed some reasons why this might be the case. A common public narrative is that these job openings and losses stem from lower labor supply, or a “worker shortage,” in which workers are unwilling to return to jobs in these sectors due to issues of low pay, poor job quality, or other opportunities. At the roundtable, however, participants explored a different explanation: Perhaps these sectors have reduced their labor demand in ways economists have not observed in past recessions.
In previous recessions, heavily impacted industries often experienced a realignment of their labor supply needs as low-productivity firms exited the market, business practices and processes were reconfigured to reduce labor costs, and employees exited the labor force or delayed entry to the labor market. Among those industries heavily burdened by the Great Recession, for example, manufacturing never returned to pre-2007 employment levels, and construction had only just recovered when the COVID-19 recession hit.
Meanwhile, the industries most impacted by the COVID-19 recession have faced no such long-term depression from past recessions but face unique challenges in their rebound, including the persistent public health crisis and inherent market failures that threaten their stability.
While job openings in heavily impacted sectors are currently high, this trend does not rule out the potential that the pandemic caused a shift in labor demand. Indeed, roundtable participants predicted more demand-driven reductions in sectors that employ more women than public discourse suggests and stressed the need for closer investigation of this topic.
Attendees also recommended that researchers employ empirical techniques such as probability models on the likelihood of working and mixed-methods research that includes both in-depth, qualitative surveys and broad population surveys as potential means for exploring this topic and understanding the supply- and demand-side factors that shape current labor market outcomes.
The fiscal policy response to the COVID-19 pandemic may be exacerbating racial and gender gaps in the labor market
The sudden onset of the COVID-19 pandemic in 2020 required a quick and robust policy response. While this policy response surely blunted the impact of the pandemic on the U.S. economy, preexisting deficiencies in income support programs and unintended flaws in new pandemic-specific programs may have resulted in an unequal recovery for women, and particularly women of color.
Despite these issues, roundtable participants were quick to point out that many programs were successful in supporting public health and the economy throughout the pandemic in the United States. Federally funded emergency paid leave helped flatten the curve of COVID-19 cases, and the Child Tax Credit significantly reduced childhood poverty and alleviated food insecurity. And flexible funding from the American Rescue Plan helped pull the child care industry back from the brink of collapse and support more families in need of home- and community-based services for their older and disabled loved ones.
Still, the future of the federal policy response to the COVID-19 recession and longer-term social policy investments are uncertain. Emergency paid leave and the Child Tax Credit were allowed to expire, along with many other pandemic-era policies that shored up families’ economic security. Funding for child care relief will soon run out as well.
One factor contributing to the unevenness of the government’s policy response is that women have typically been segregated into historically undervalued occupations. While Congress was able to pass the Infrastructure Investment and Jobs Act in 2021, generating resources for industries such as construction and energy that employ more men, legislation that would invest in the economy by building a robust care infrastructure has stalled. These investments in the care economy, including child care and home health, would have benefited women more, while also generating more jobs and growing the economy more than physical infrastructure investments alone. (See Figures 3 and 4.)
Figure 3
Figure 4
Roundtable participants suggested that while much is already known about the policies enacted or expanded during the pandemic, future research could shed light on how these policies impacted specific communities. At the root of many remaining research questions is the issue of data, including data on the distributional effects of the government’s fiscal policy response, the utilization of emergency paid leave, and the disbursement of funding under the Coronavirus Aid, Relief, and Economic Security, or CARES, Act and the American Rescue Plan Act.
Beyond that, roundtable attendees agreed that researchers should highlight the experiences of those who are disproportionately impacted by the policy responses but largely removed from policymaking processes, including, but not limited to, women of color, parents with young children, and immigrant workers.
Conclusion
The economic story of the COVID-19 pandemic is still being written, but the health of the U.S. economy and economic equity for women and workers of color requires a nuanced understanding of the U.S. labor market today. Several things, however, are clear. The COVID-19 recession impacted women, and particularly women of color, to a greater degree than past recessions. Several industries that primarily employ women are still facing the economic fallout of the pandemic more than 2 years later. And the unique nature of the pandemic exacerbated caregiving challenges that primarily fall on women.
Still, important questions remain. How are child care and other caregiving duties translating to women’s labor market outcomes and personal well-being, including mental health? How much of the lingering reductions in employment stem from labor demand as opposed to labor supply? What changes to the labor market are permanent, and which will revert to their pre-pandemic state? What are the short- and long-term impacts of the federal government’s uneven fiscal policy response?
Participants in the recent roundtable co-hosted by the Washington Center for Equitable Growth and The Century Foundation provided several key recommendations for researchers as they seek to answer these questions, including:
Conducting longitudinal and long-term research
Cultivating nontraditional data sources to overcome gaps in data
Using careful selection of data and measures to understand the nuances of the labor market experiences of women of color
Employing empirical techniques, such as probability models and mixed-methods research, to better understand factors that shape our current labor market outcomes
Engaging in research that highlights the experience of women disproportionately impacted by public policies but largely locked out of the policymaking process
By convening leading academics, policy experts, and advocates for the Women’s Racial and Economic Justice Roundtable, Equitable Growth and The Century Foundation are helping to refine the research agenda on racial and gender equity in the pandemic-era labor market and stimulate new research that will inform equitable policy solutions. Such evidence-backed policies are essential to the recovery from the COVID-19 recession and to position U.S. workers and families to share in sustainable, broad-based economic growth.