JOLTS Day Graphs: December 2021 Edition

Every month the U.S. Bureau of Labor Statistics releases data on hiring, firing, and other labor market flows from the Job Openings and Labor Turnover Survey, better known as JOLTS. Today, the BLS released the latest data for December 2021. This report doesn’t get as much attention as the monthly Employment Situation Report, but it contains useful information about the state of the U.S. labor market. Below are a few key graphs using data from the report.

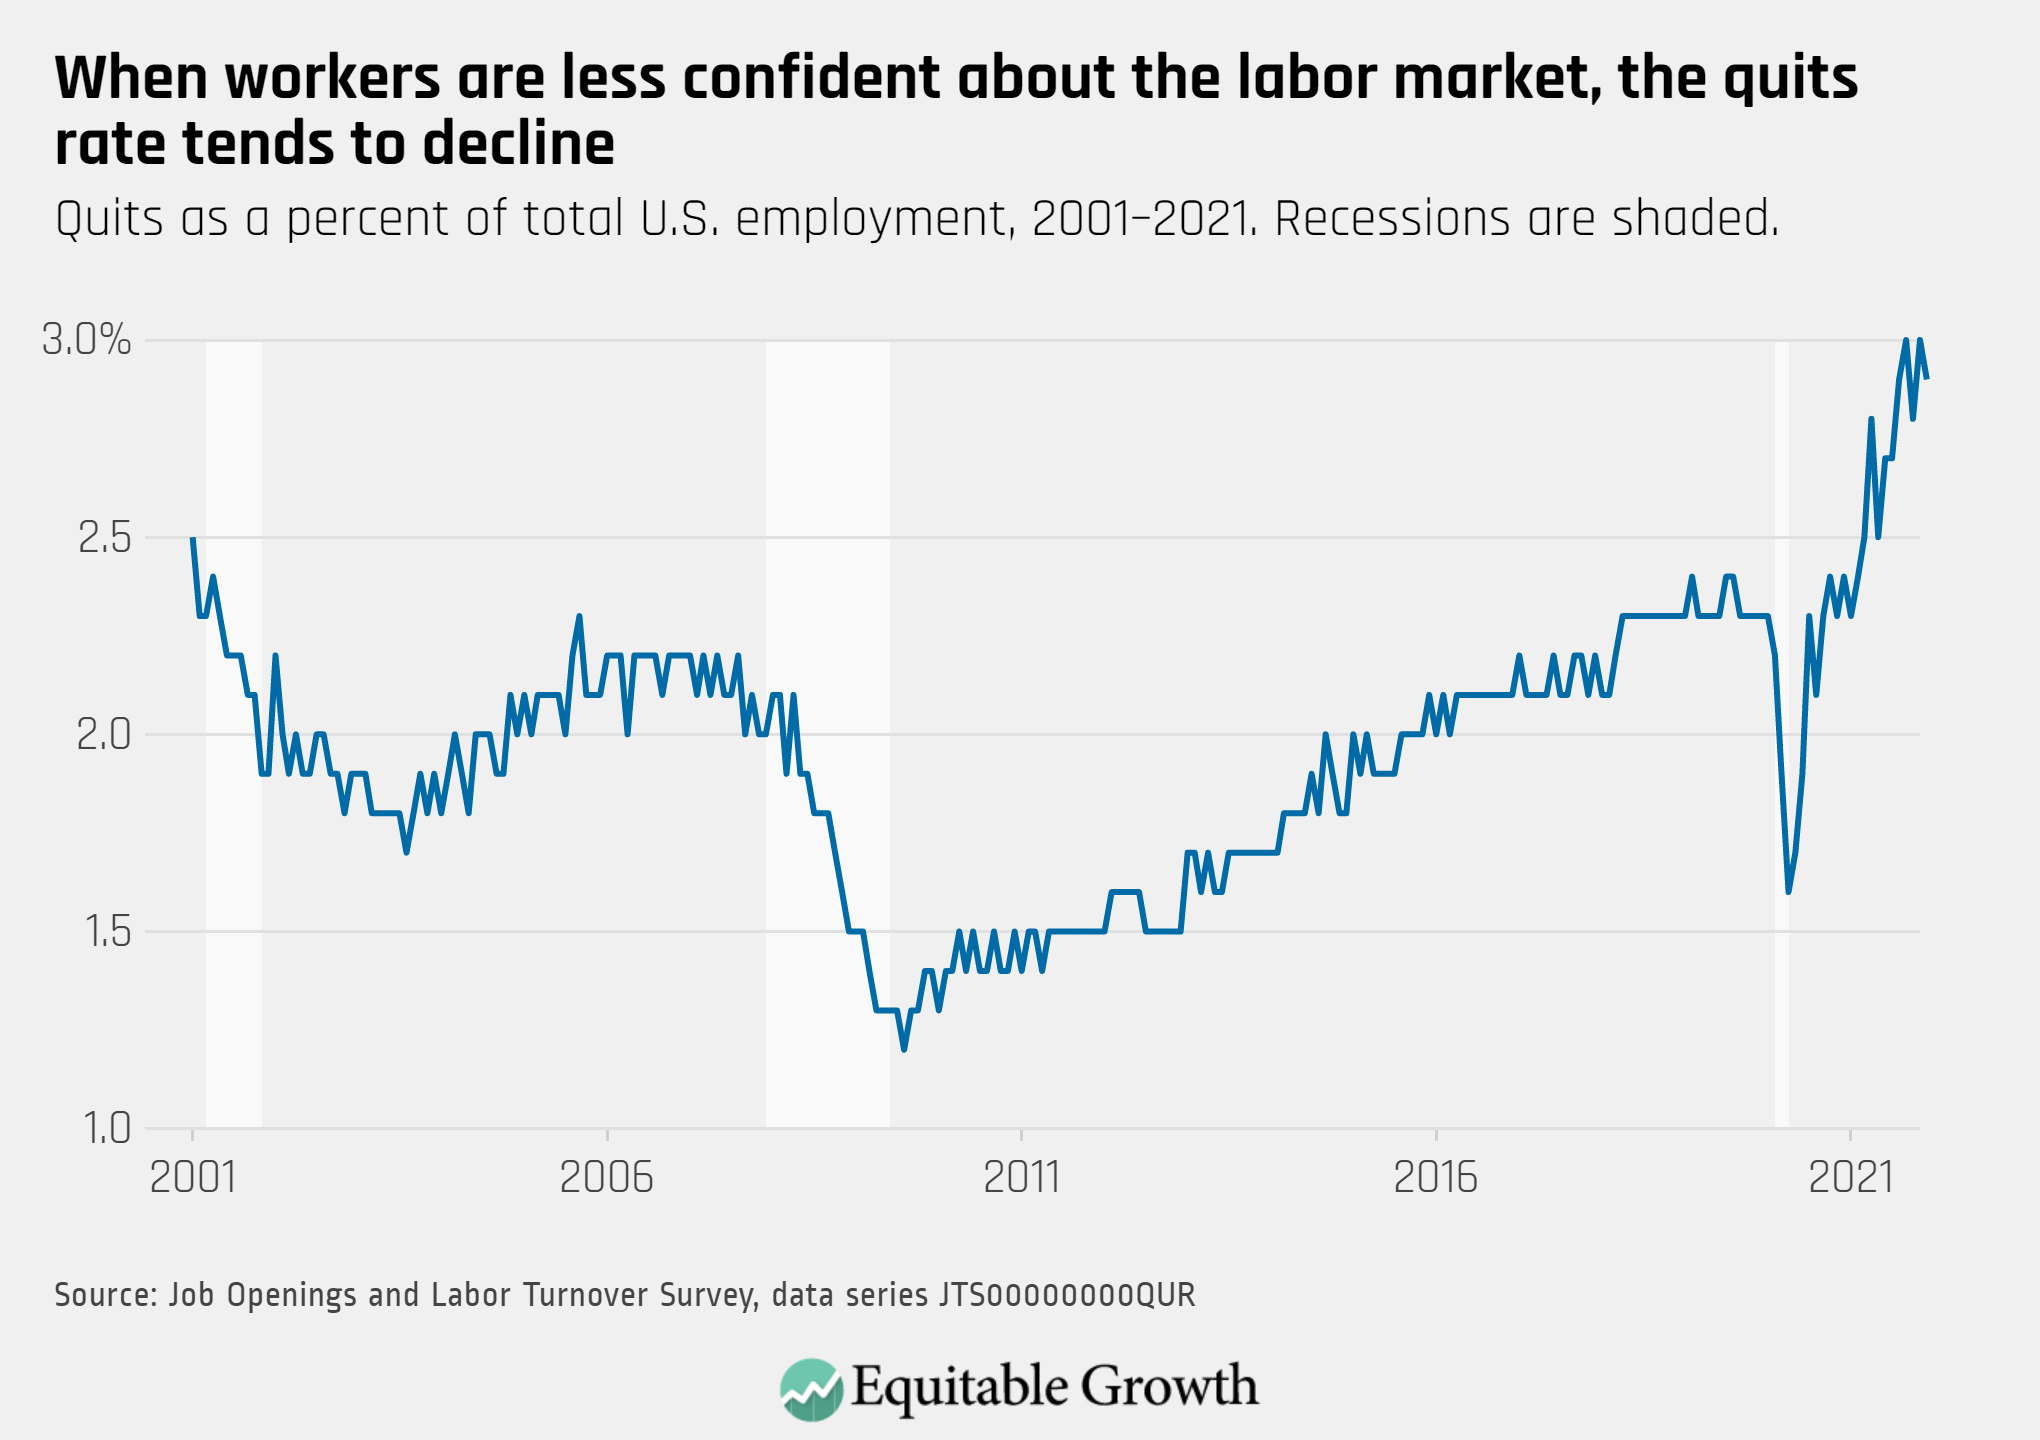
The quits rate ticked down slightly to 2.9 percent in December, as the number of quits fell 161,000 to 4.3 million.

Quits as a percent of total U.S. employment, 2001-2021. Recessions are shaded.

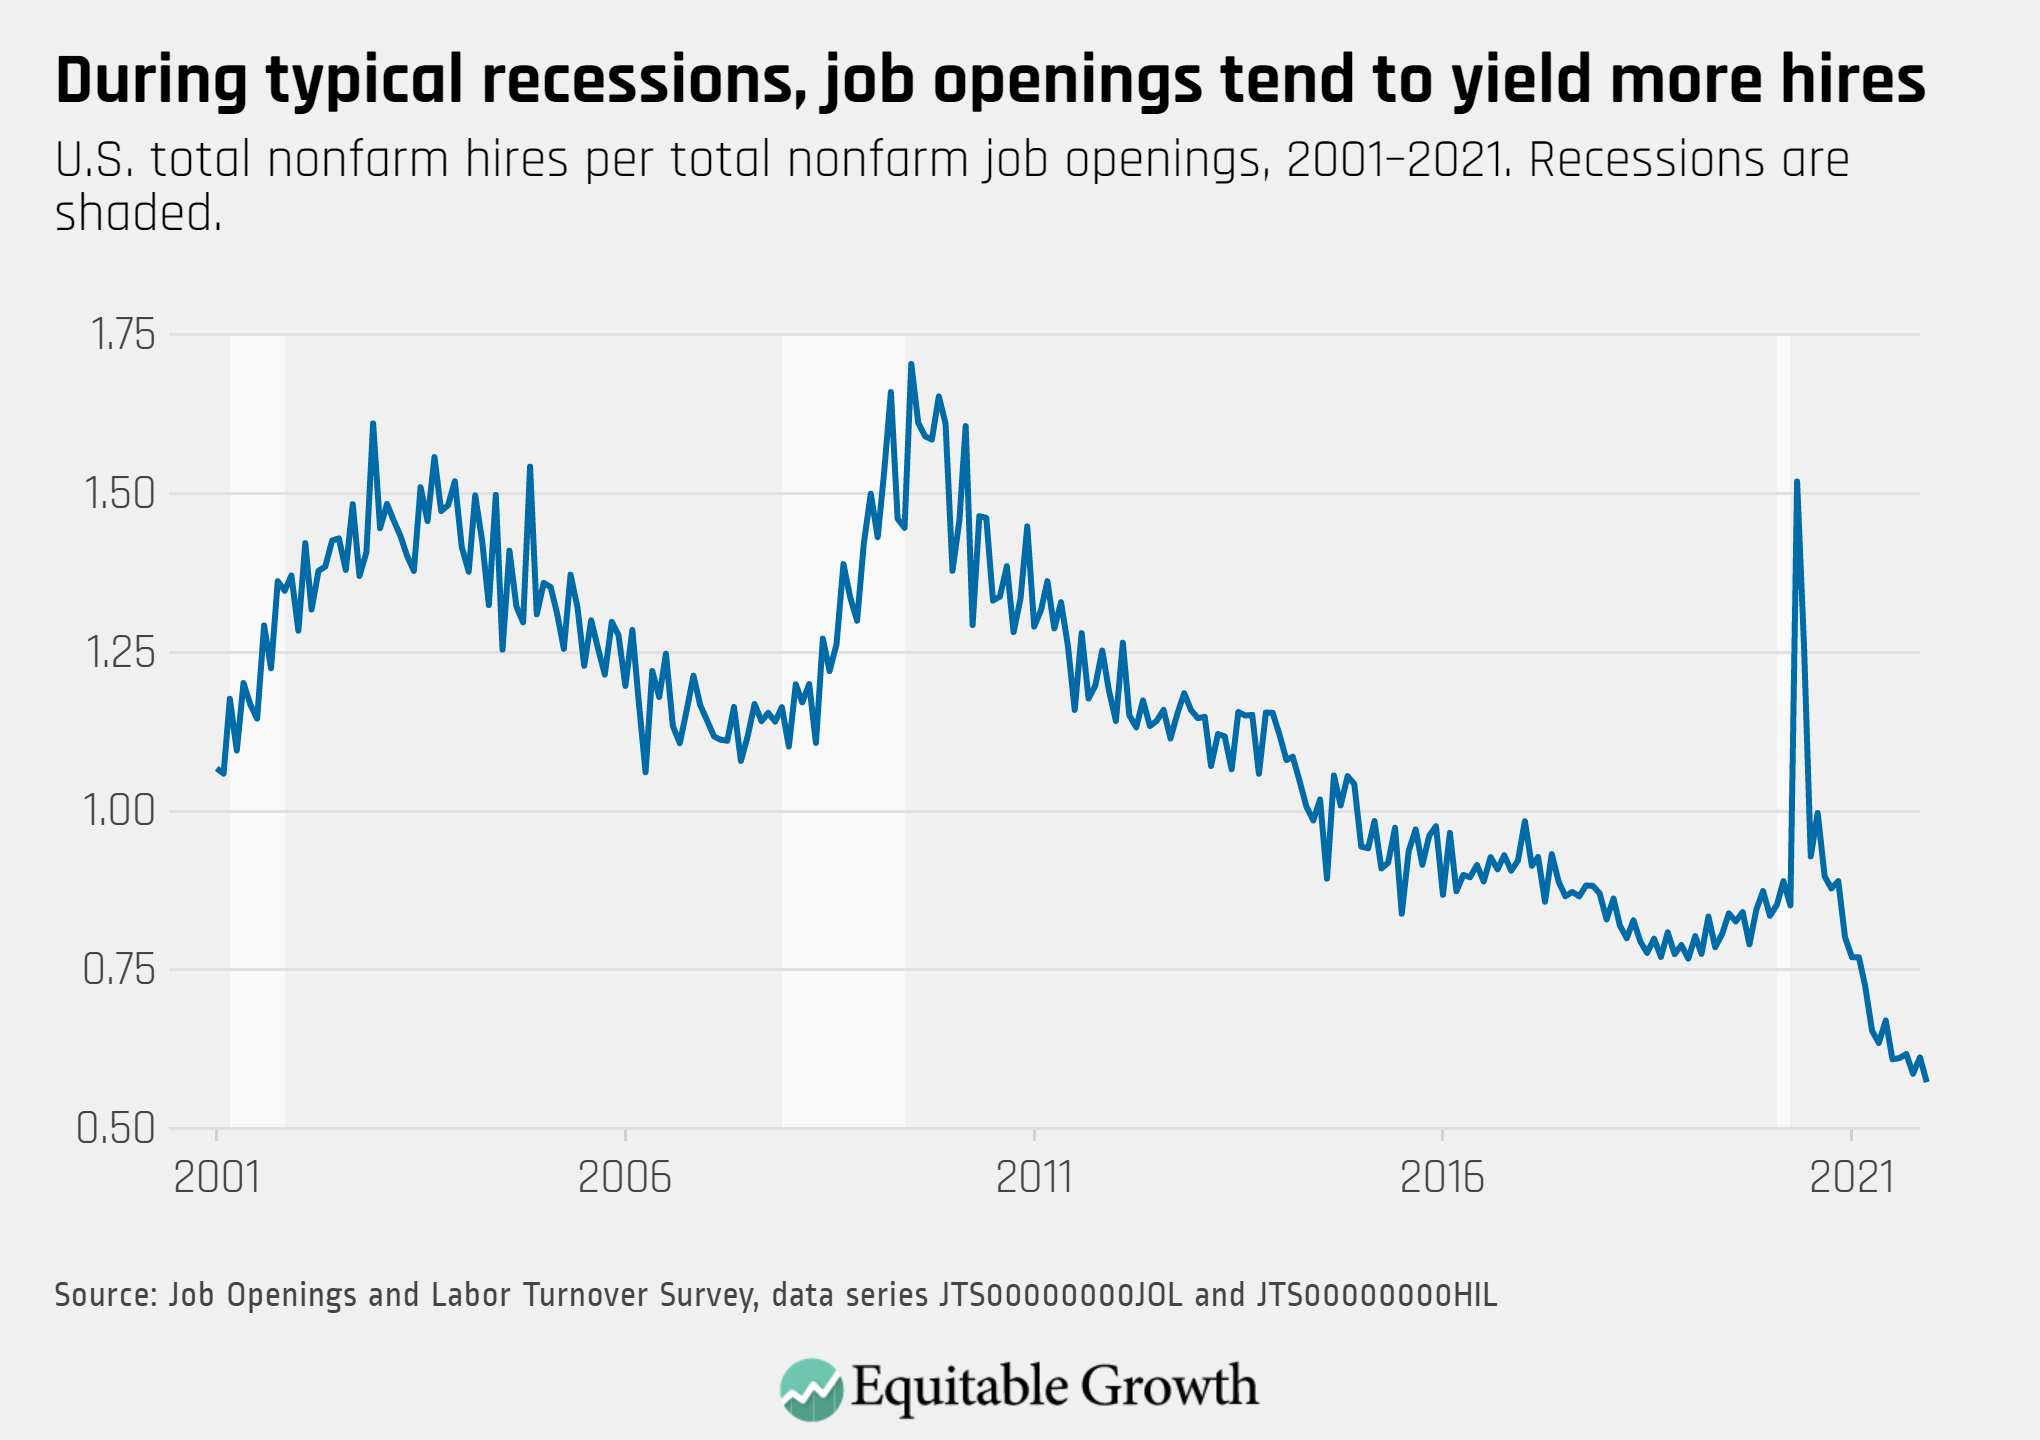
With job openings fairly steady at 10.9 million and hires decreasing 333,000 to 6.3 million, the vacancy yield declined to 0.57 in December.

U.S. total nonfarm hires per total nonfarm job openings, 2001-2021. Recessions are shaded.

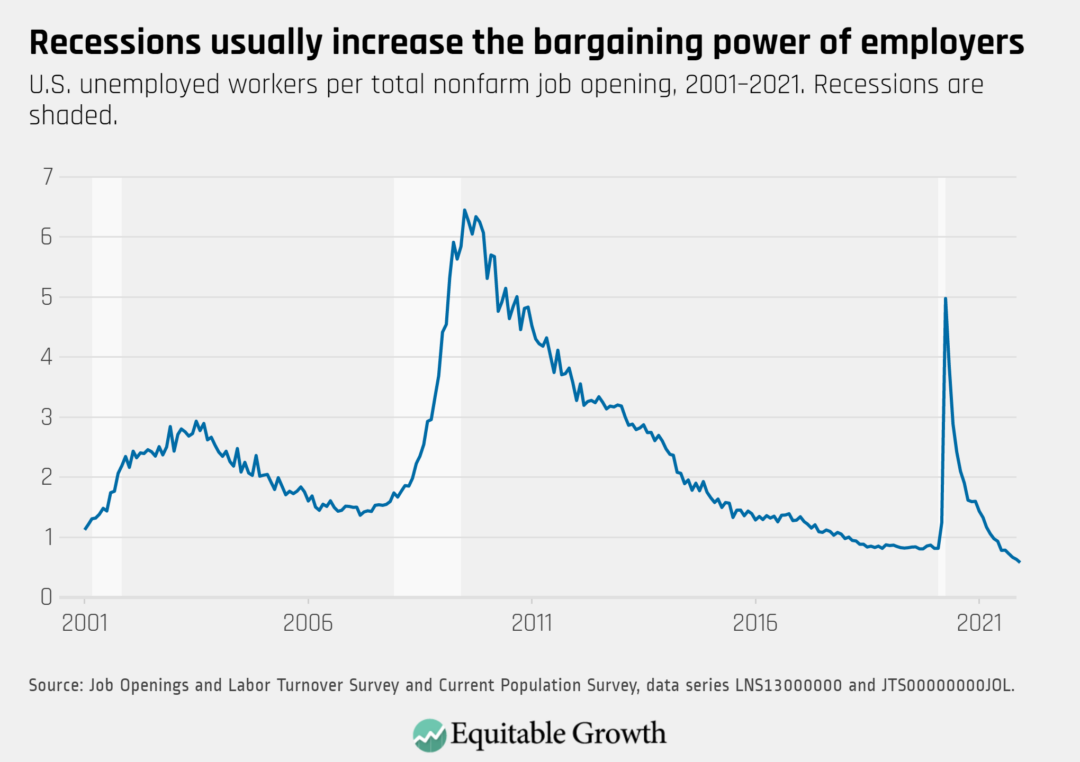
The ratio of unemployed-worker-per-job-opening remains low, falling further from 0.63 unemployed workers per job opening in November to 0.58 in December.

U.S. unemployed workers per total nonfarm job opening, 2001-2021. Recessions are shaded.

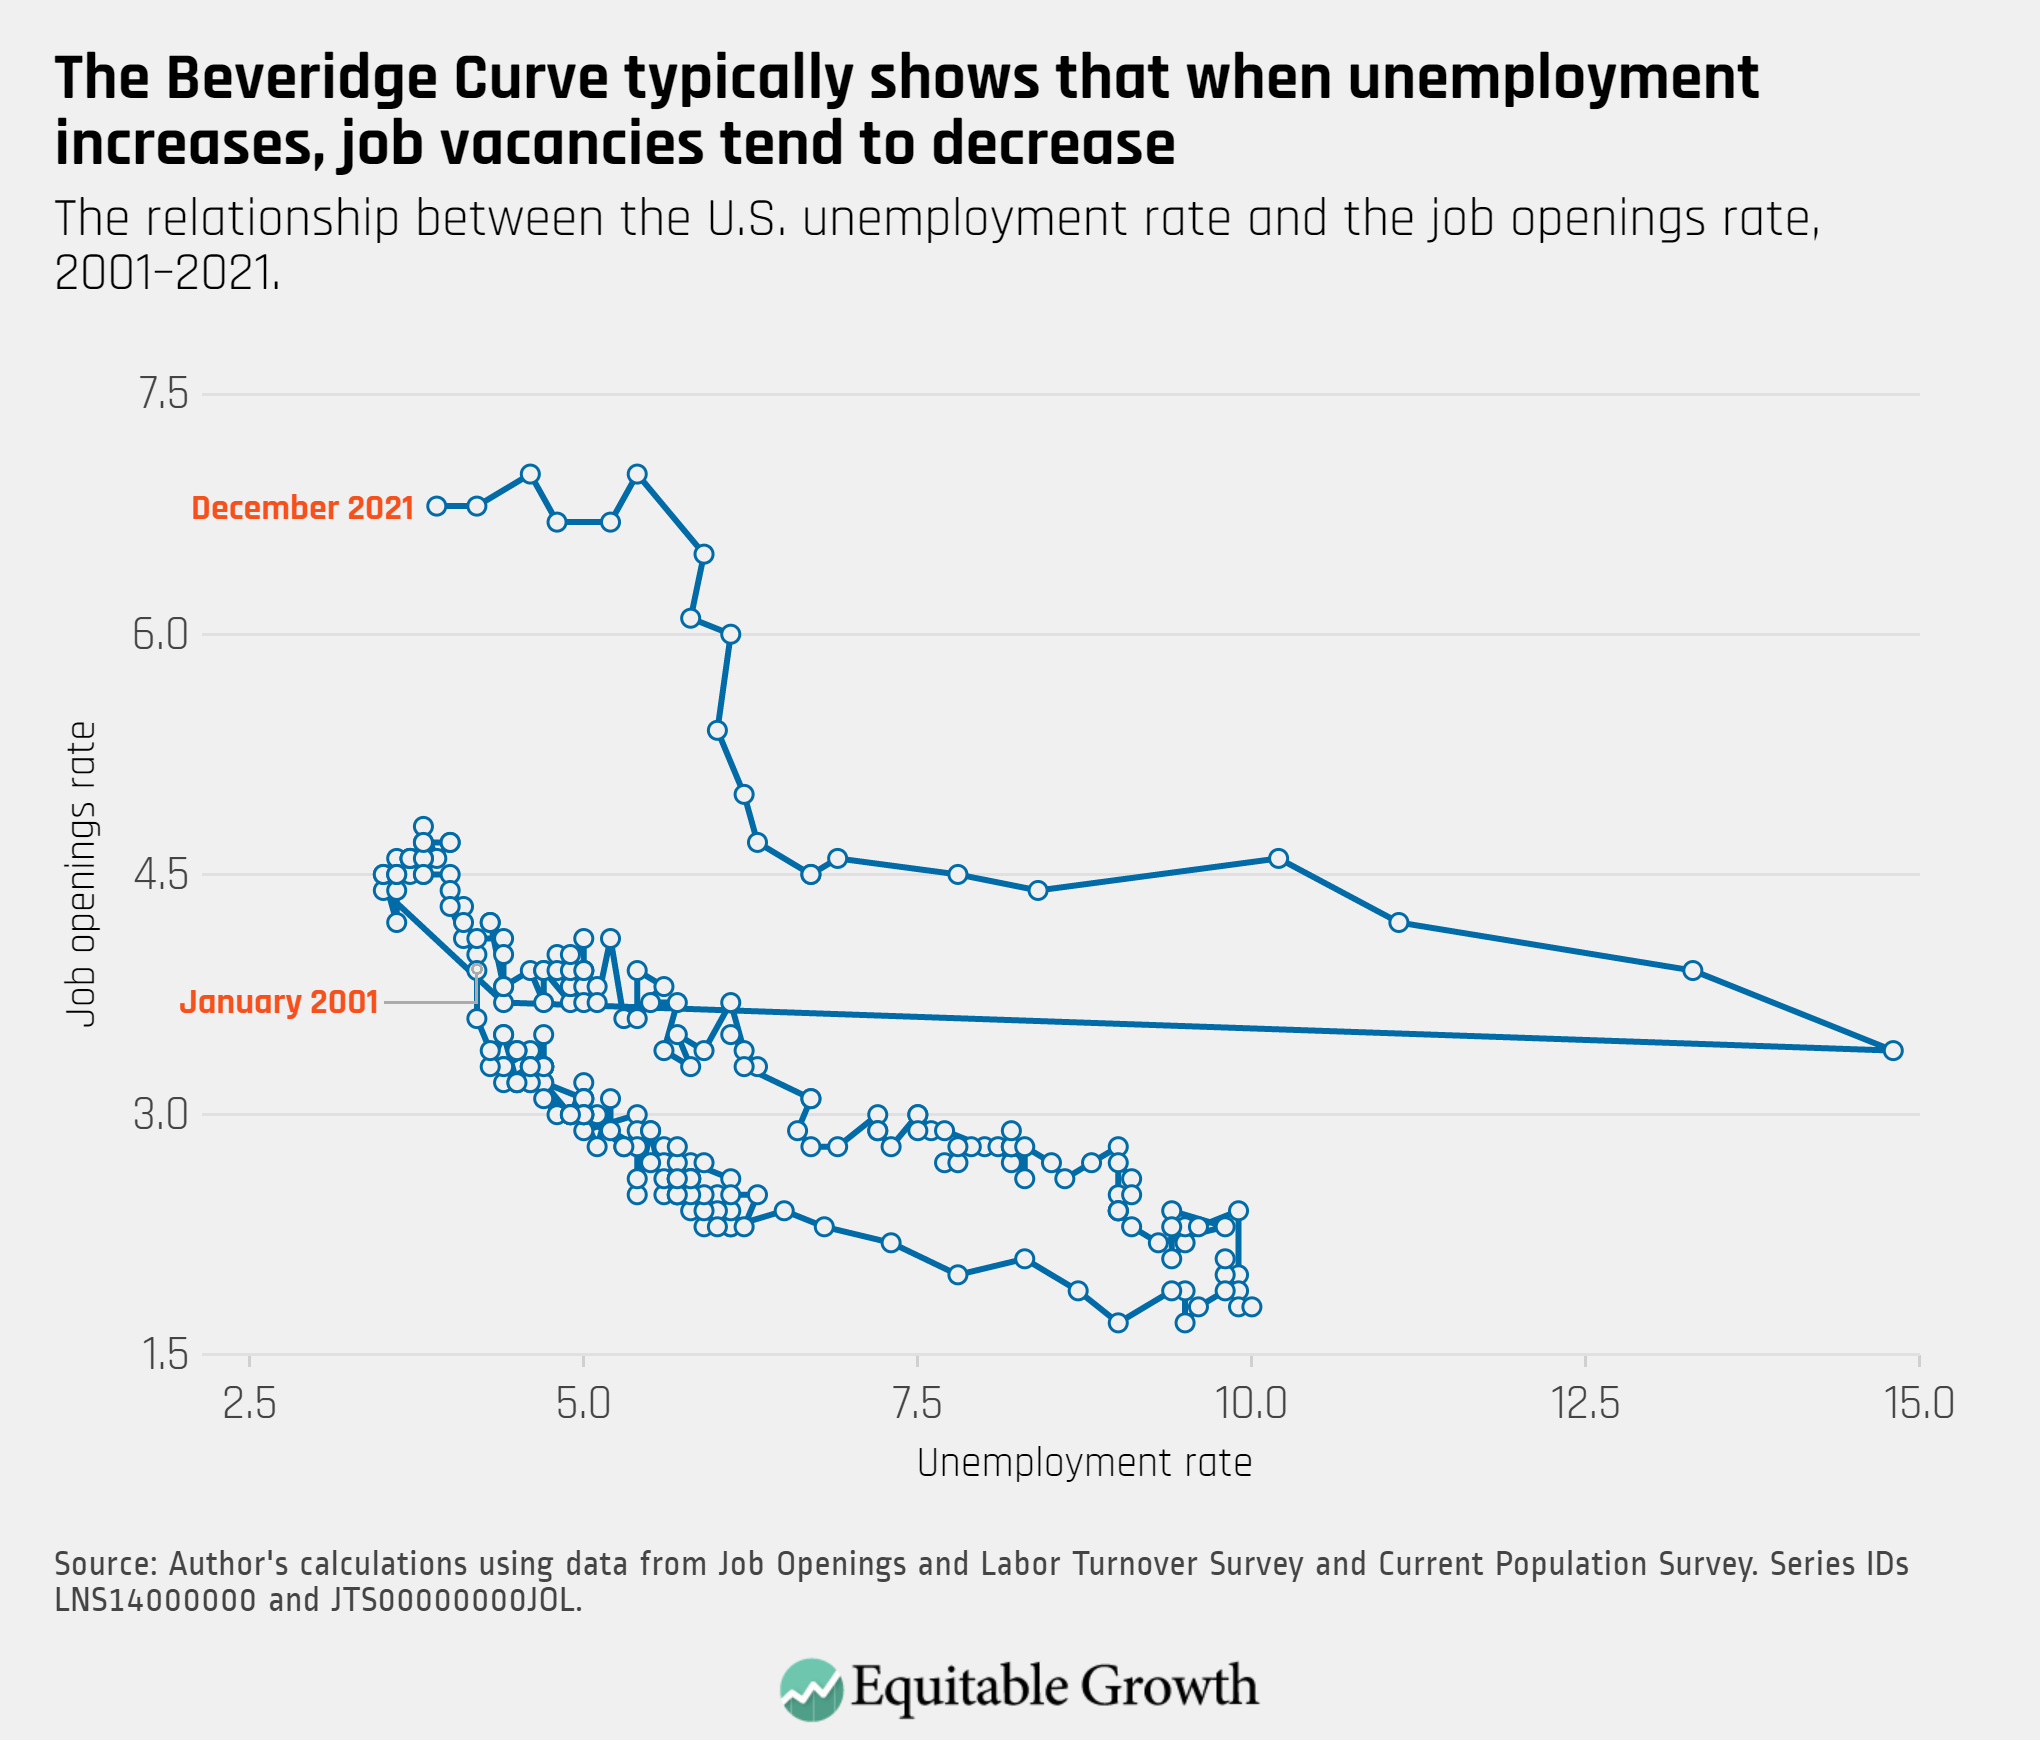
The Beveridge Curve continues to be in an atypical range compared to previous business cycles, as the unemployment rate declined slightly in December and the job openings rate remained elevated.

The relationship between the U.S. unemployment rate and the job openings rate, 2001-2021.

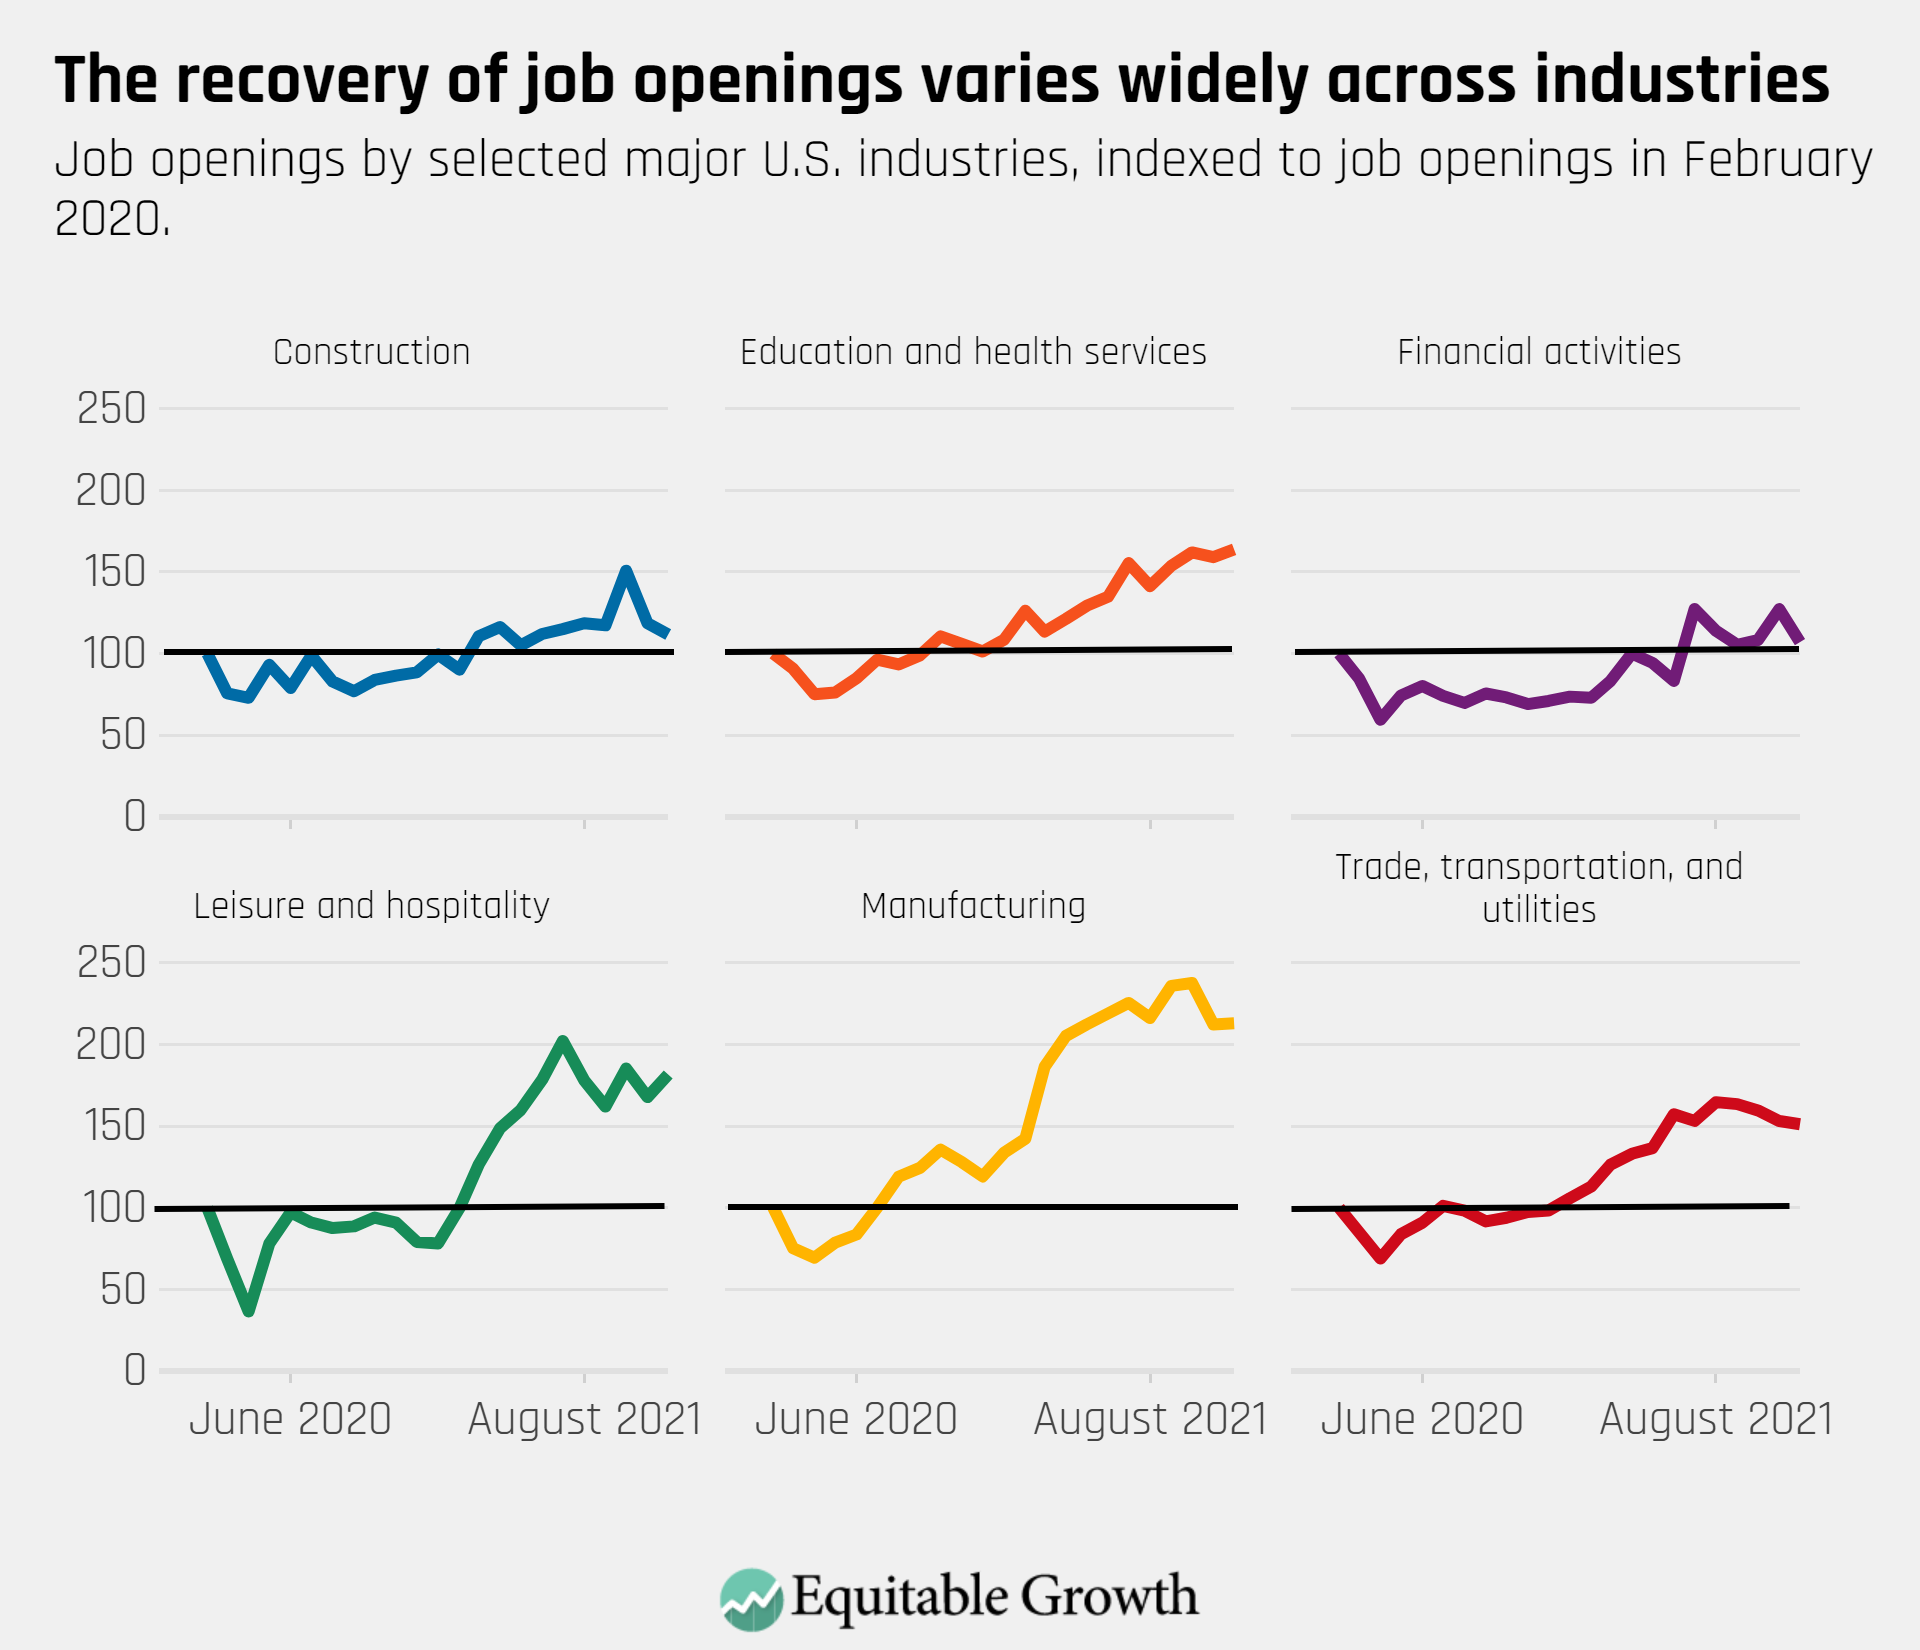
Job openings slowed in several sectors—such as education and health services, manufacturing, and trade, transportation, and utilities—that have seen elevated job openings relative to pre-pandemic levels.

Job openings by selected major U.S. industries, indexed to job openings in February 2020.
Connect with us!

Explore the Equitable Growth network of experts around the country and get answers to today's most pressing questions!

Get in Touch