Equitable Growth’s Jobs Day Graphs: January 2022 Report Edition
On February 4, the U.S. Bureau of Labor Statistics released new data on the U.S. labor market during the month of January. Below are five graphs compiled by Equitable Growth staff highlighting important trends in the data.
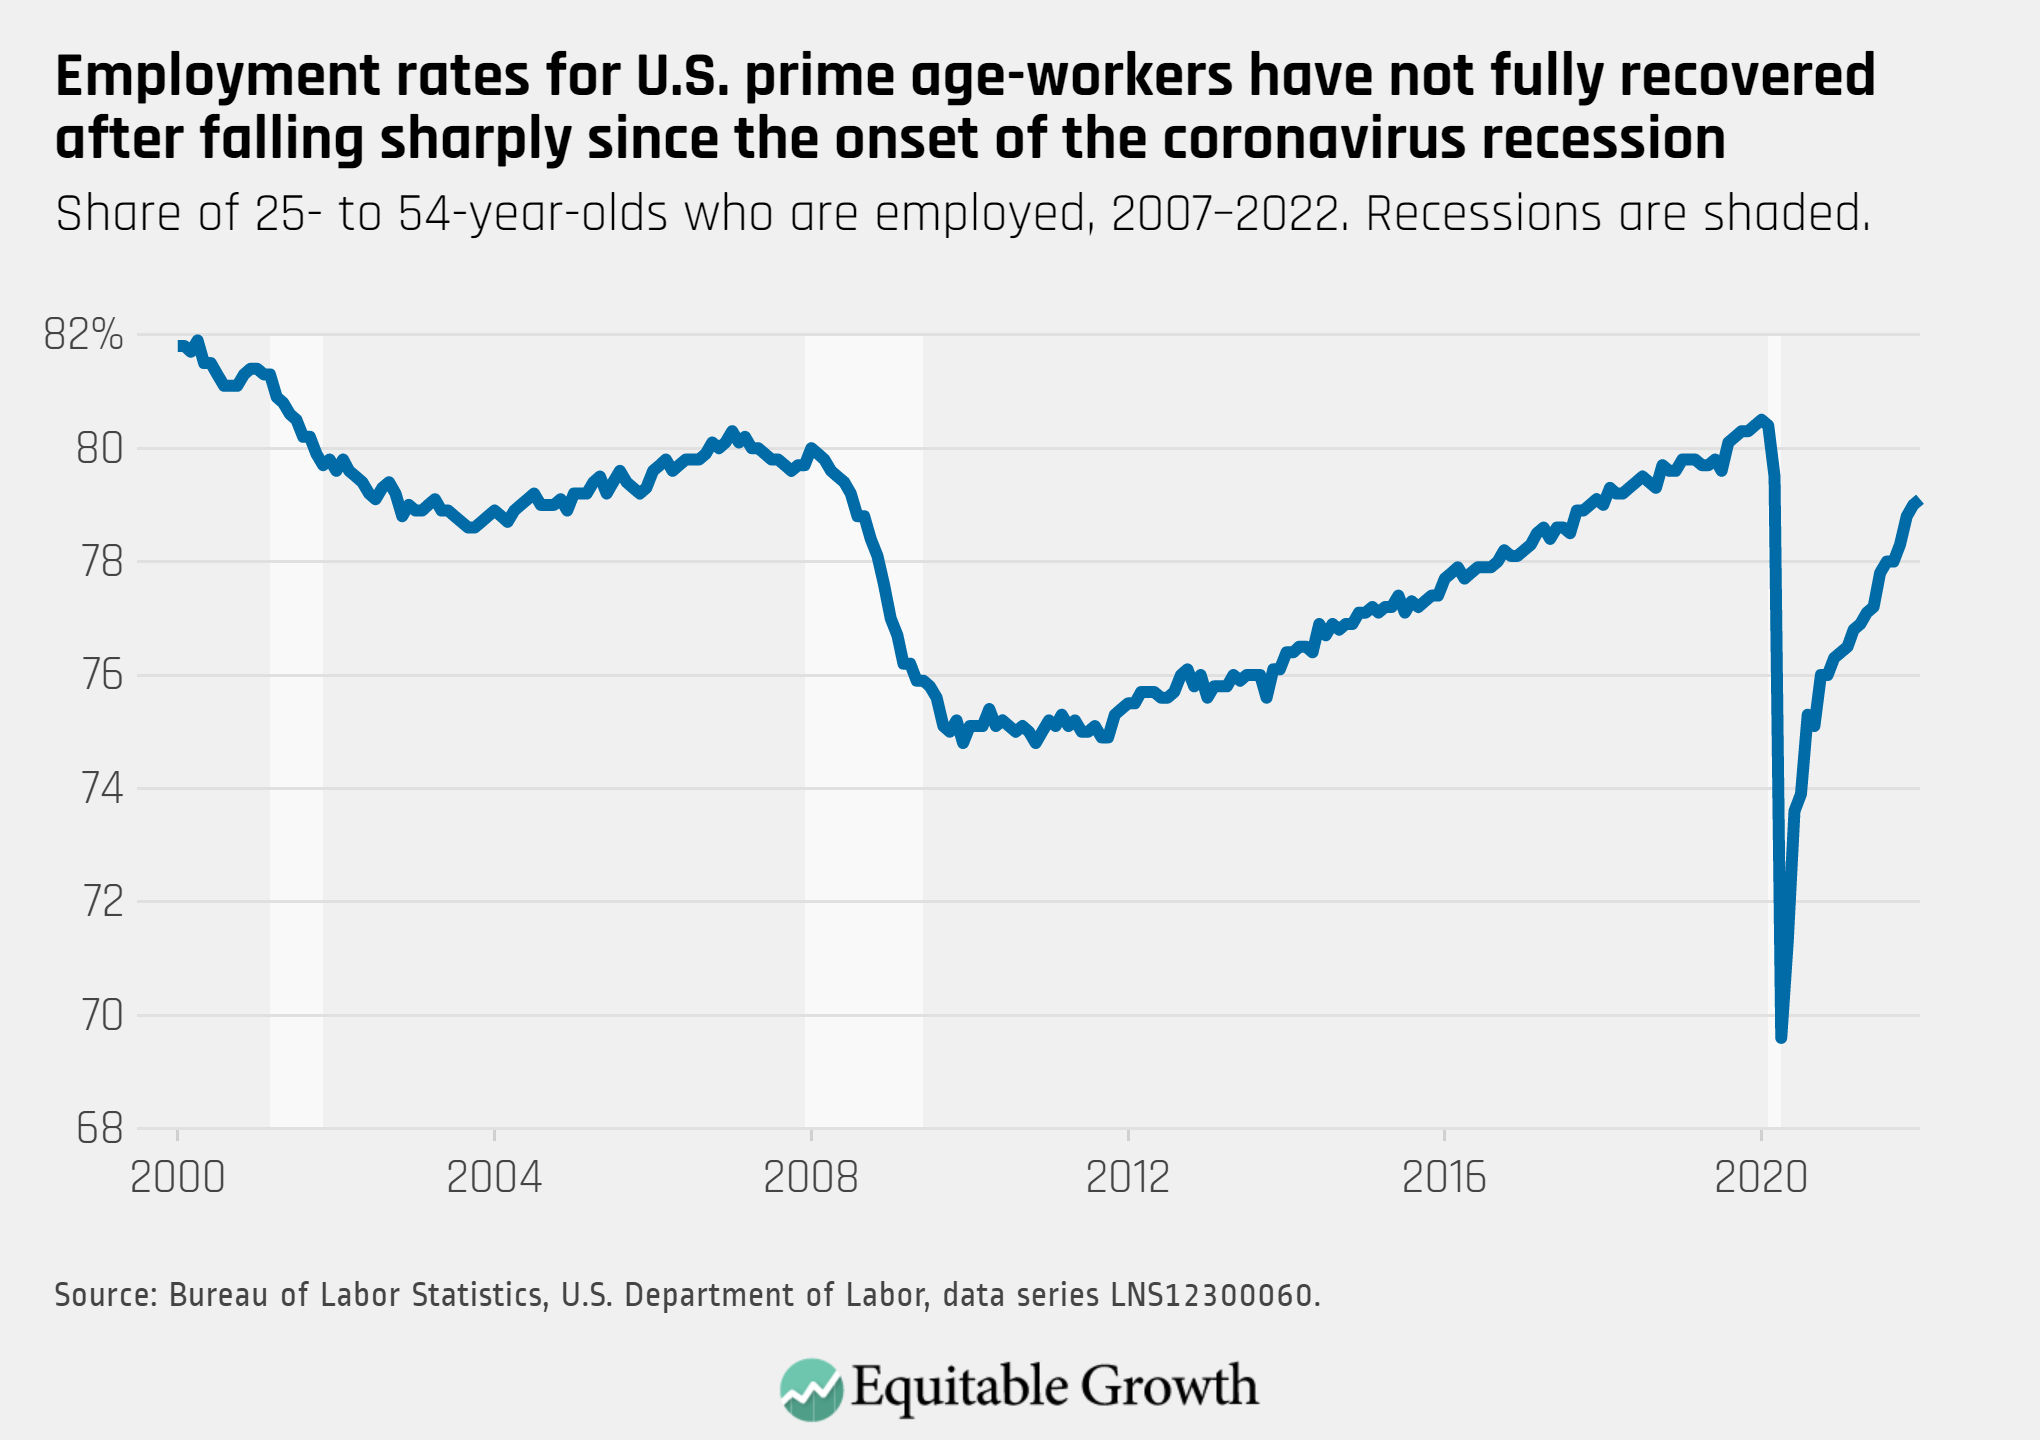
The prime age employment rate edged upwards to 79.1 percent as the economy added more jobs than predicted in January.
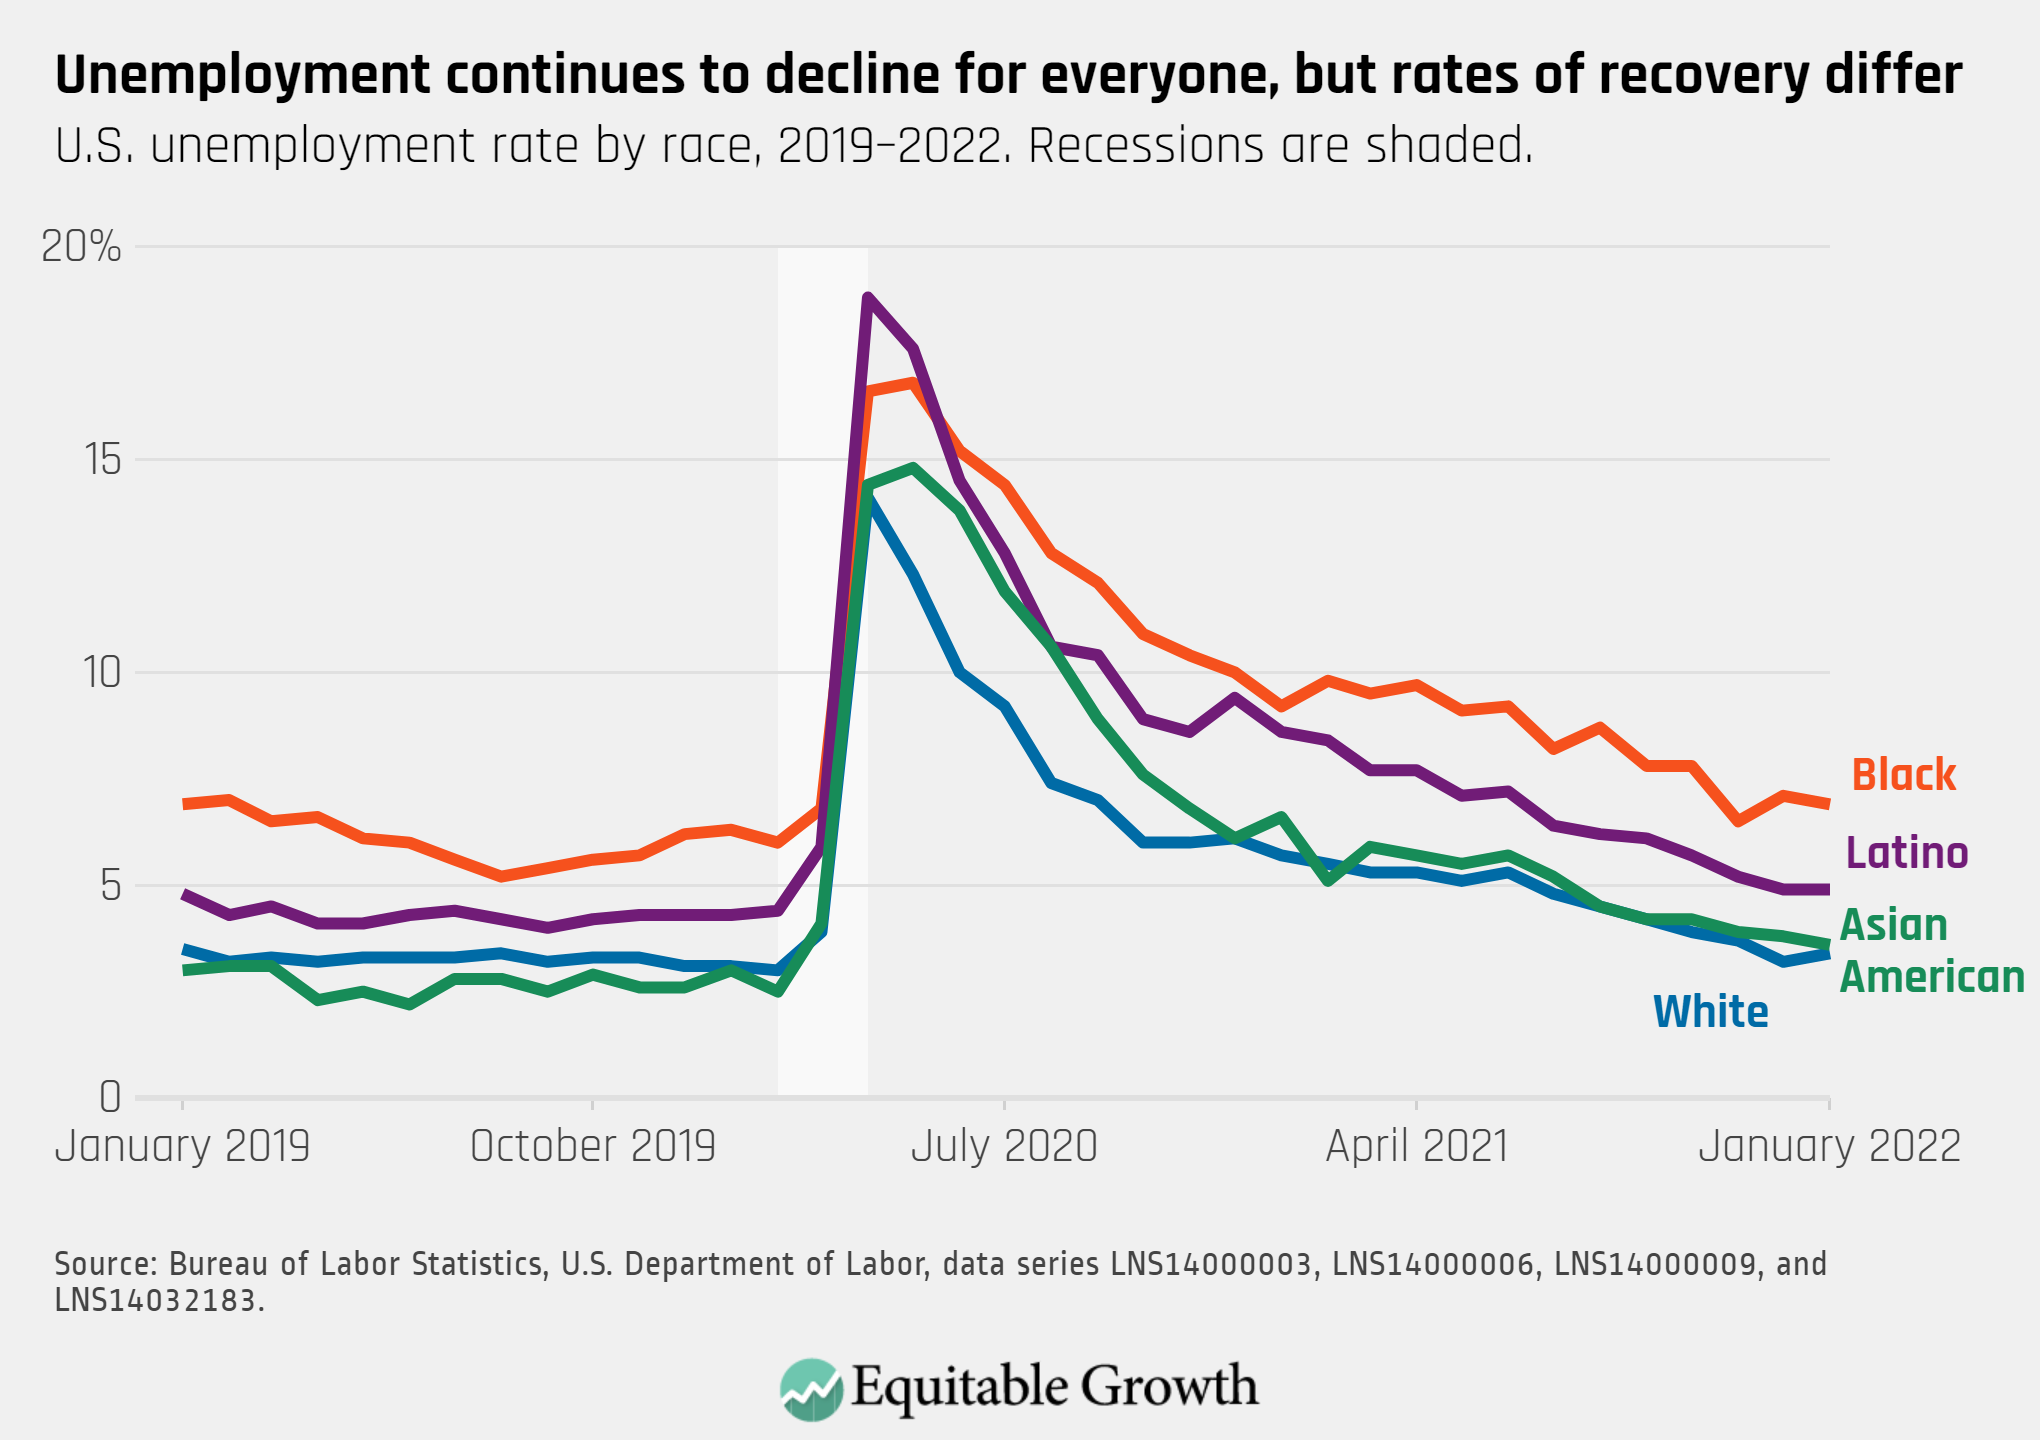
Unemployment decreased for Black workers in January, converging slightly with other groups of workers. White workers had a slight increase in unemployment and Hispanic workers’ unemployment was unchanged.
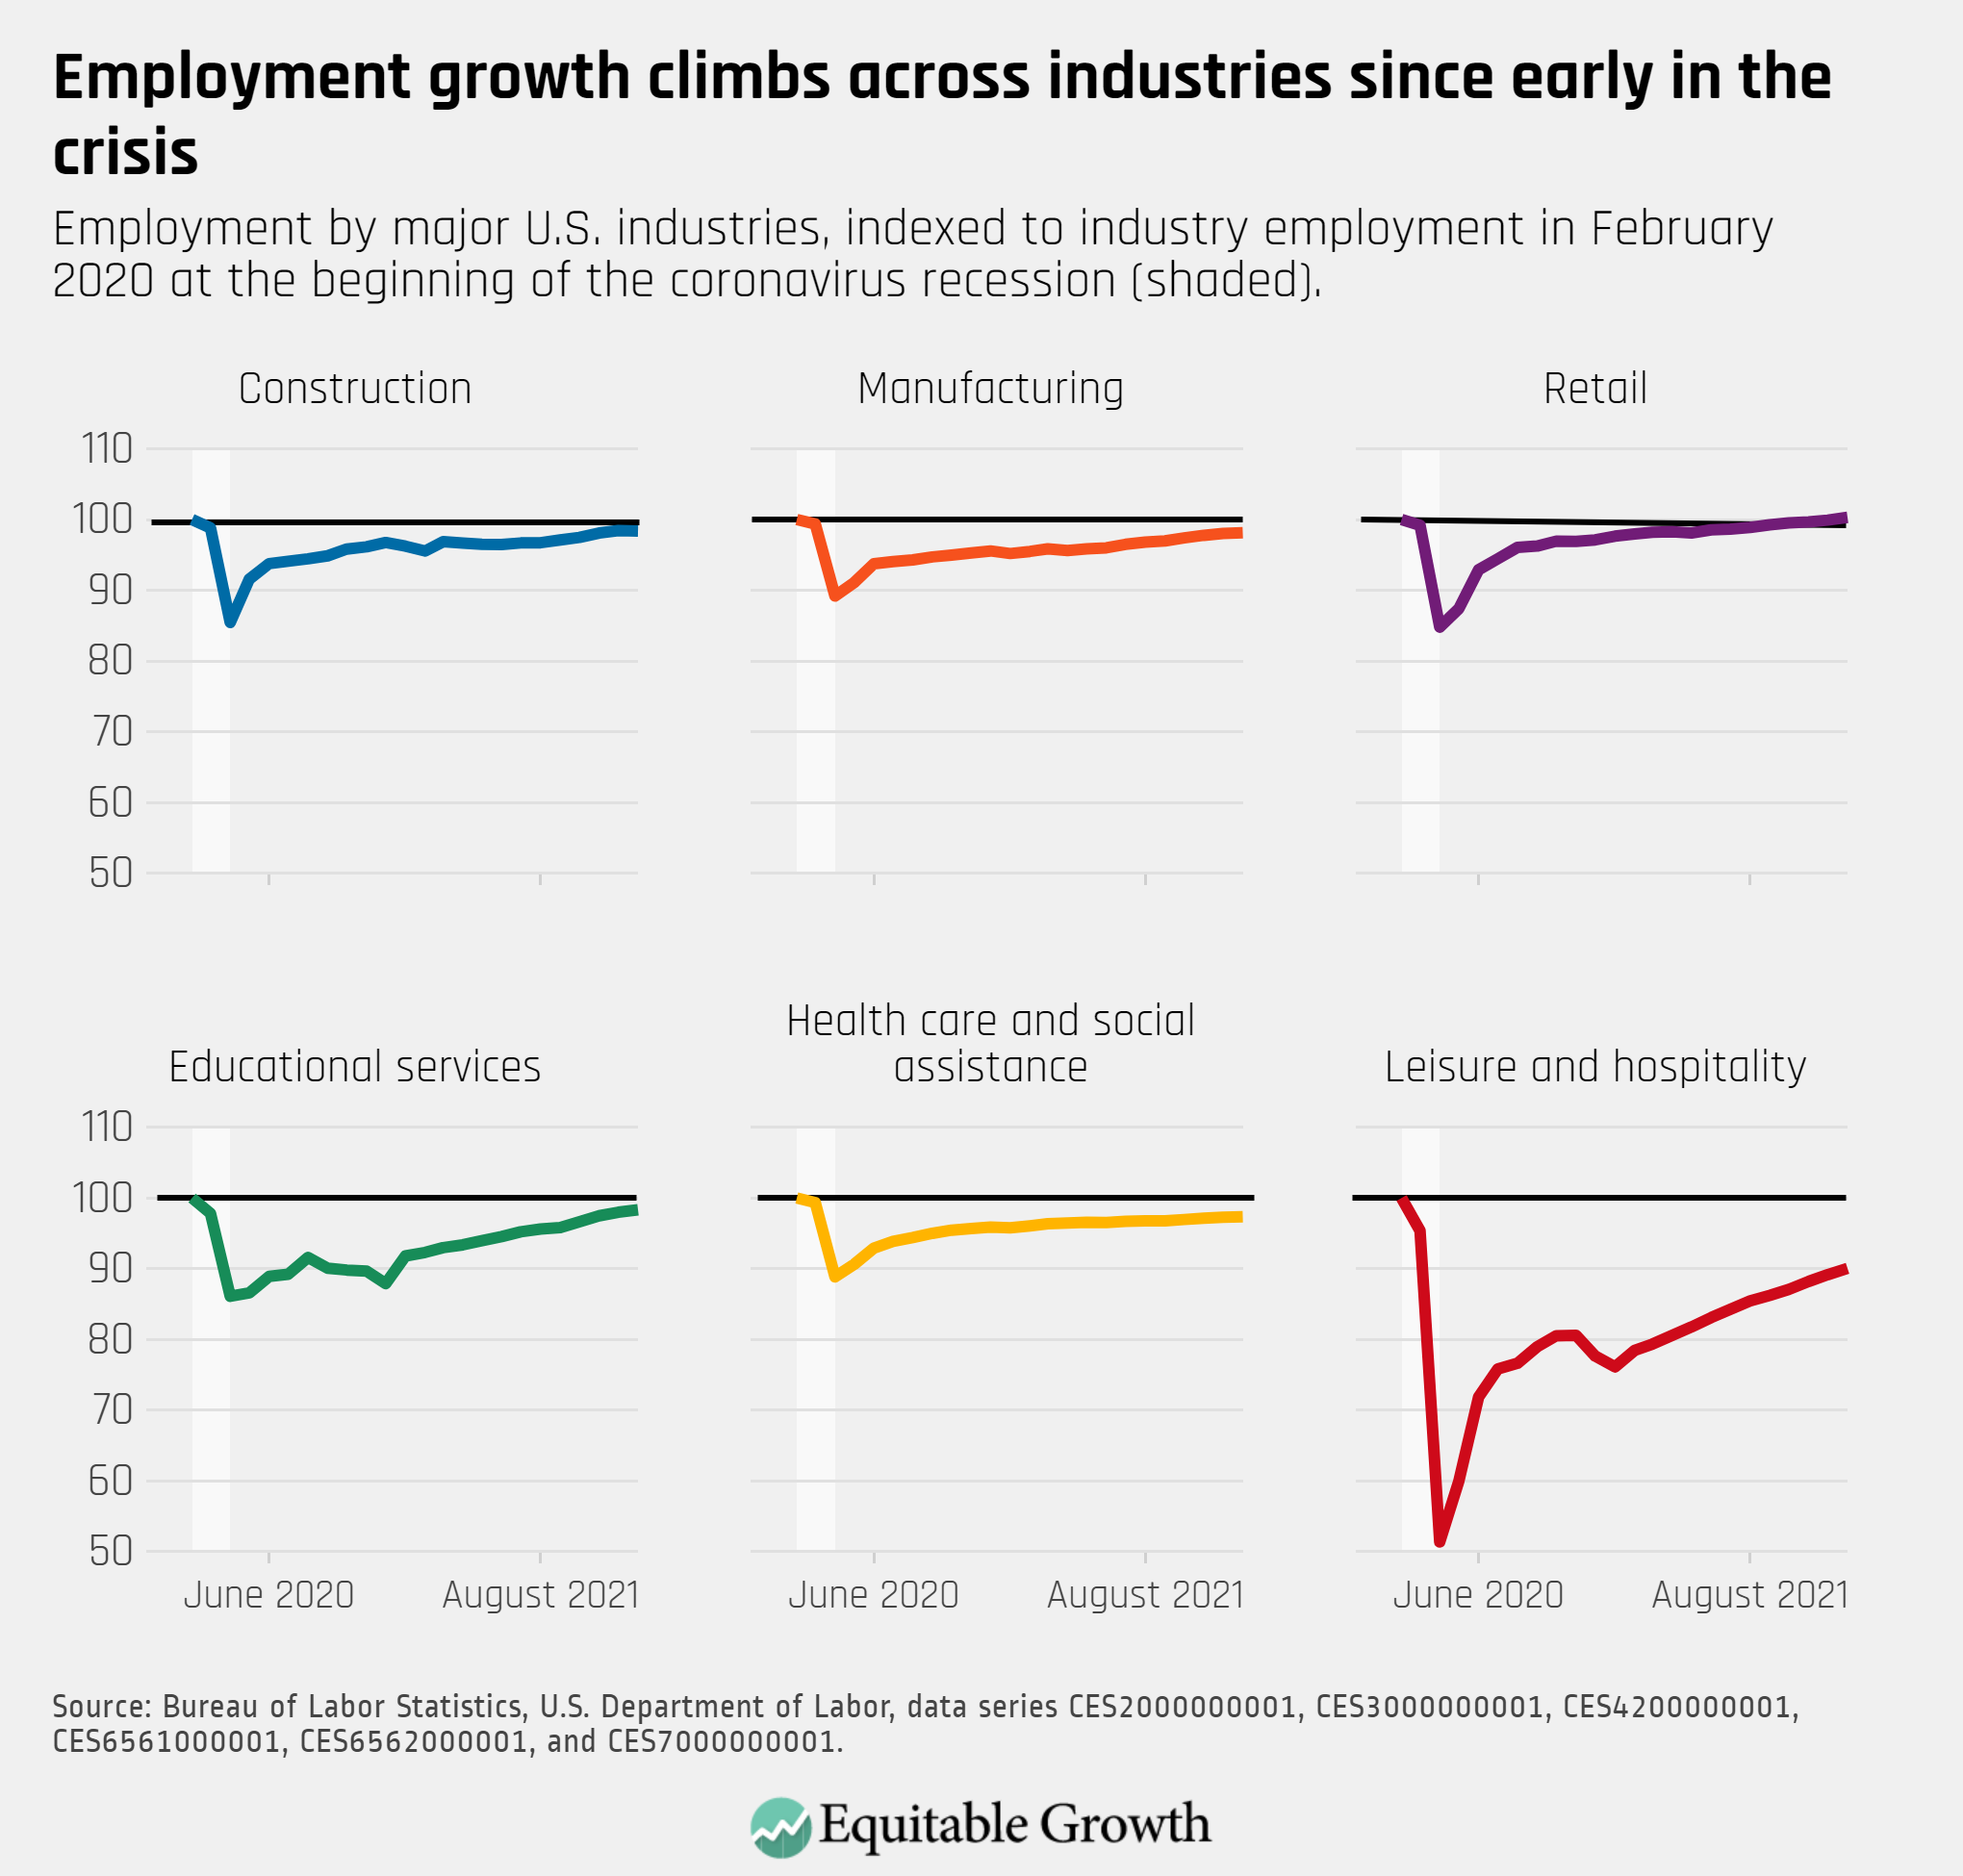
Leisure and hospitality continued to lead employment gains, but job growth occurred across industries.
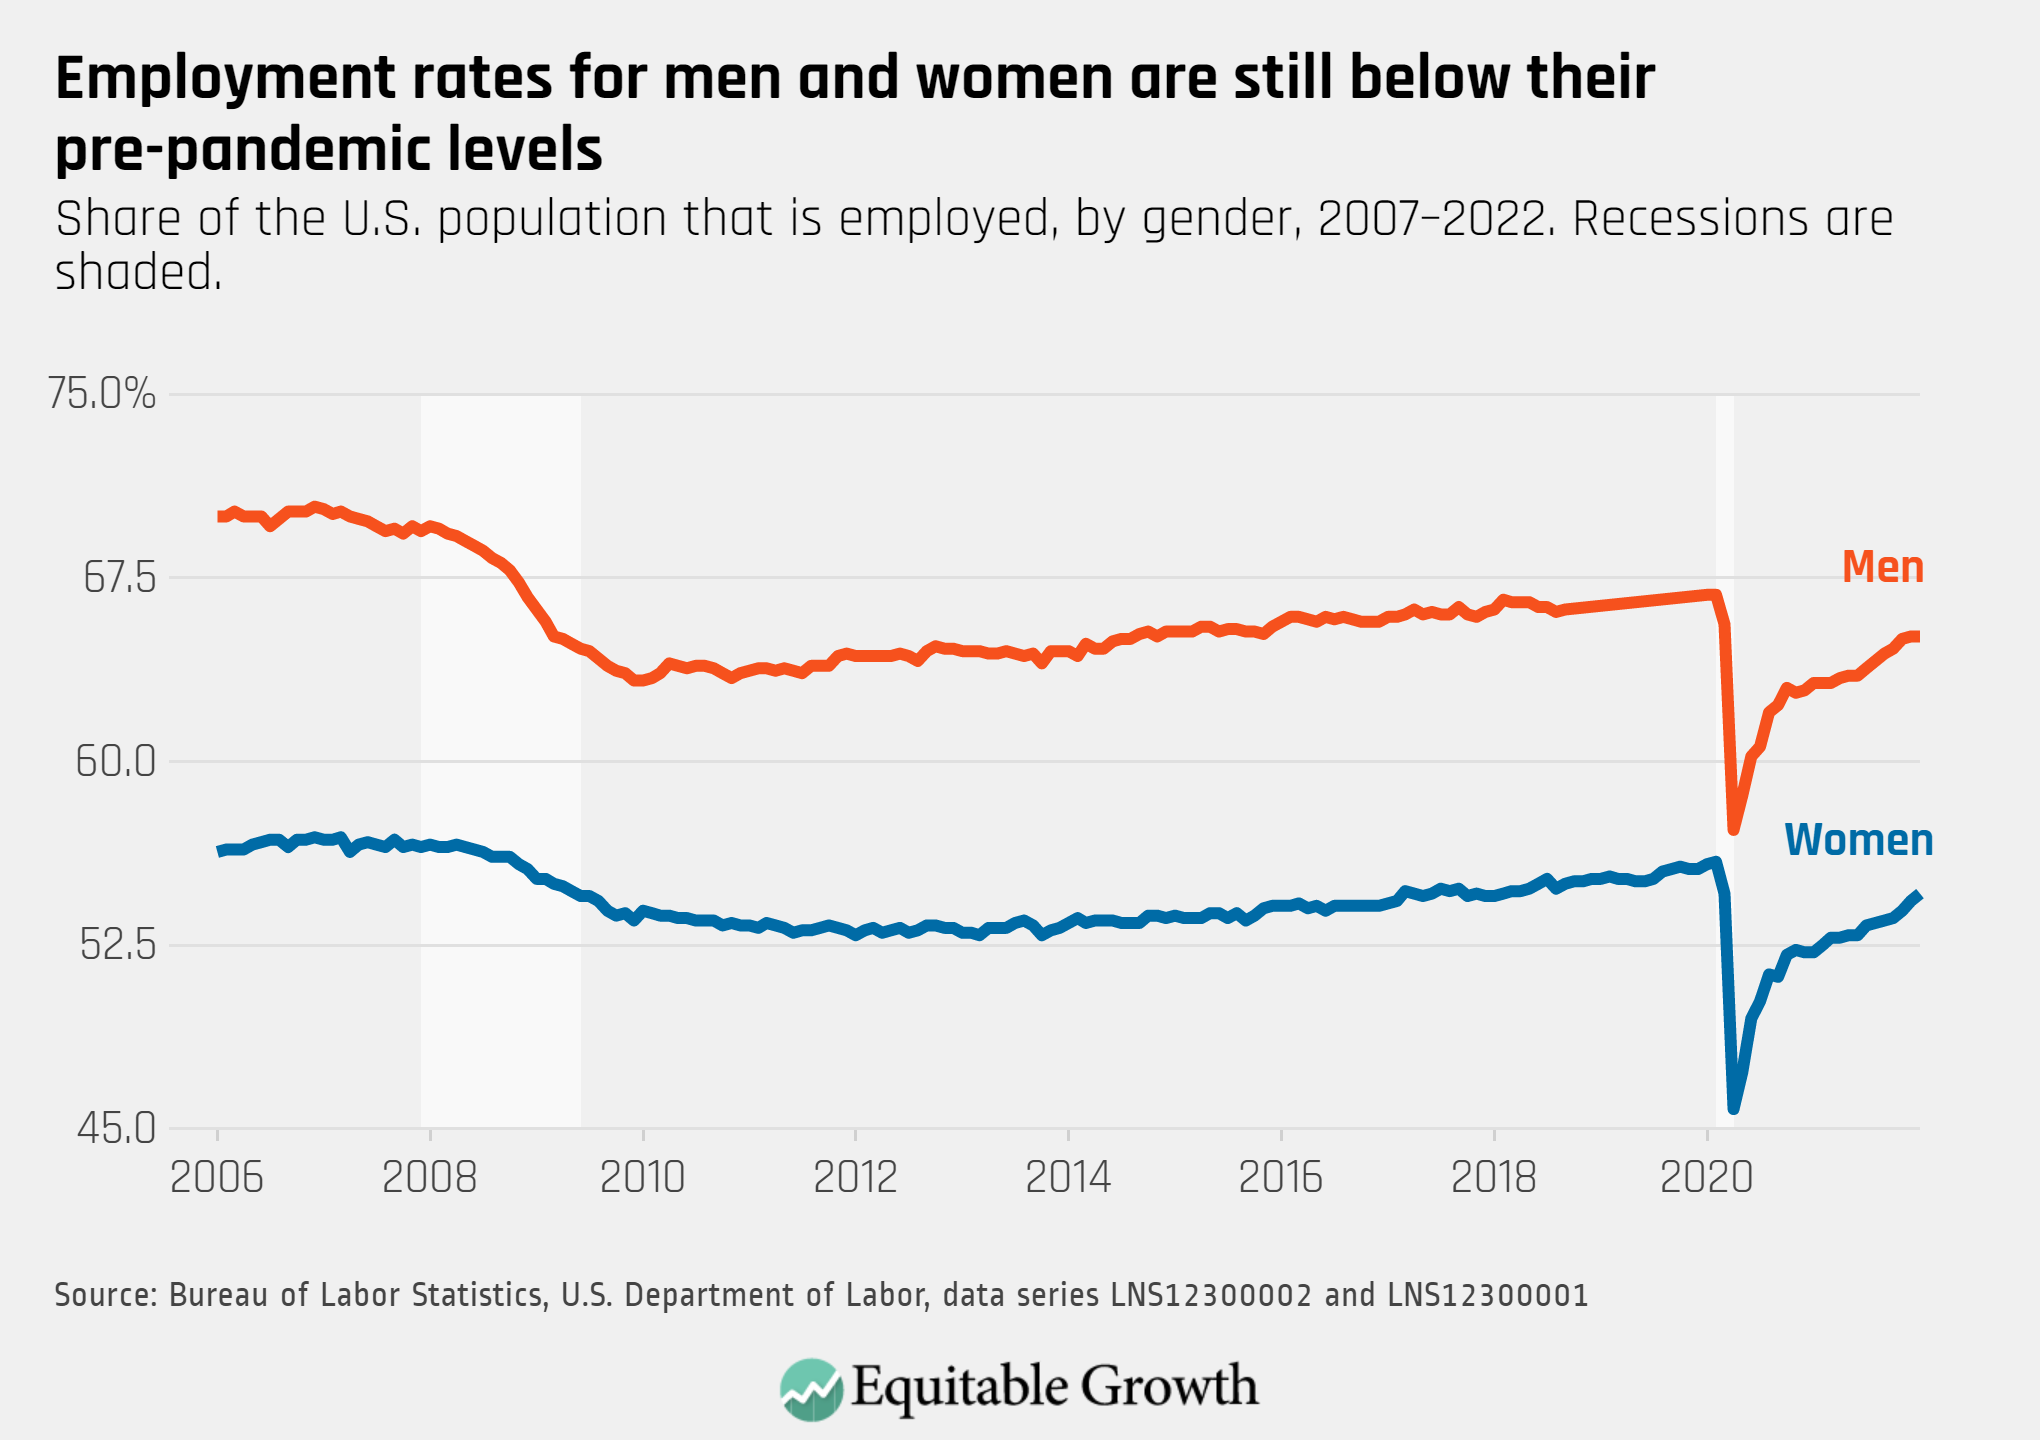
The employment rate for women increased 0.3 percentage points to 54.6 in January, while the employment rate for men was unchanged.
Among the unemployed, there was an increasing proportion who had left their jobs in January, signaling continued confidence in the labor market.
