Consumption volatility across the U.S. income distribution is highest among low-income workers and their families

Rising income inequality and more unstable earnings in the United States today results in more precarious lives for low-income U.S. workers and their families. This earnings and income instability leads to swings in spending as well. Weekly spending on food, for example, jumps up when families enrolled in the Supplemental Nutrition Assistance Program receive their benefits electronically and then falls 20 percent the following week.
This type of food insecurity is linked to lowered health outcomes and lowered educational performance. When families face such consumption volatility, it prevents them from investing in their own well-being and future economic mobility, which, in turn, constrains overall U.S. economic growth across the country. This is why policymakers need to understand that spending volatility is central to the economic well-being of U.S. workers and their families.
In a recent working paper, we examine both the level and volatility of consumption across U.S. income and socioeconomic distributions to understand how consumption volatility and income intersect. Using quarterly spending data from the Consumer Expenditure Survey, we look across several categories of consumption central to the daily lives of families.
We use quarterly volatility because annual volatility may miss important changes within a year. While families may spend more on food in one year compared to the next, this may miss times when food insecurity within that year impacts families’ well-being and could have other effects, such as on children’s development amid, say, the school year.
Concerns over the downside consequences of consumption volatility are warranted for several reasons. Low- and moderate-income families—the latter of whom are often living on the edge of low-income earnings—might simultaneously consume lower levels of goods and services on basic needs (think food and apparel), as well as expenditures on entertainment and alcohol. To discern these spending patterns, we assess differences in average expenditures across income deciles for food, clothing, entertainment, and alcohol. We find clear income gradients across all categories. (See Figure 1.)
Figure 1
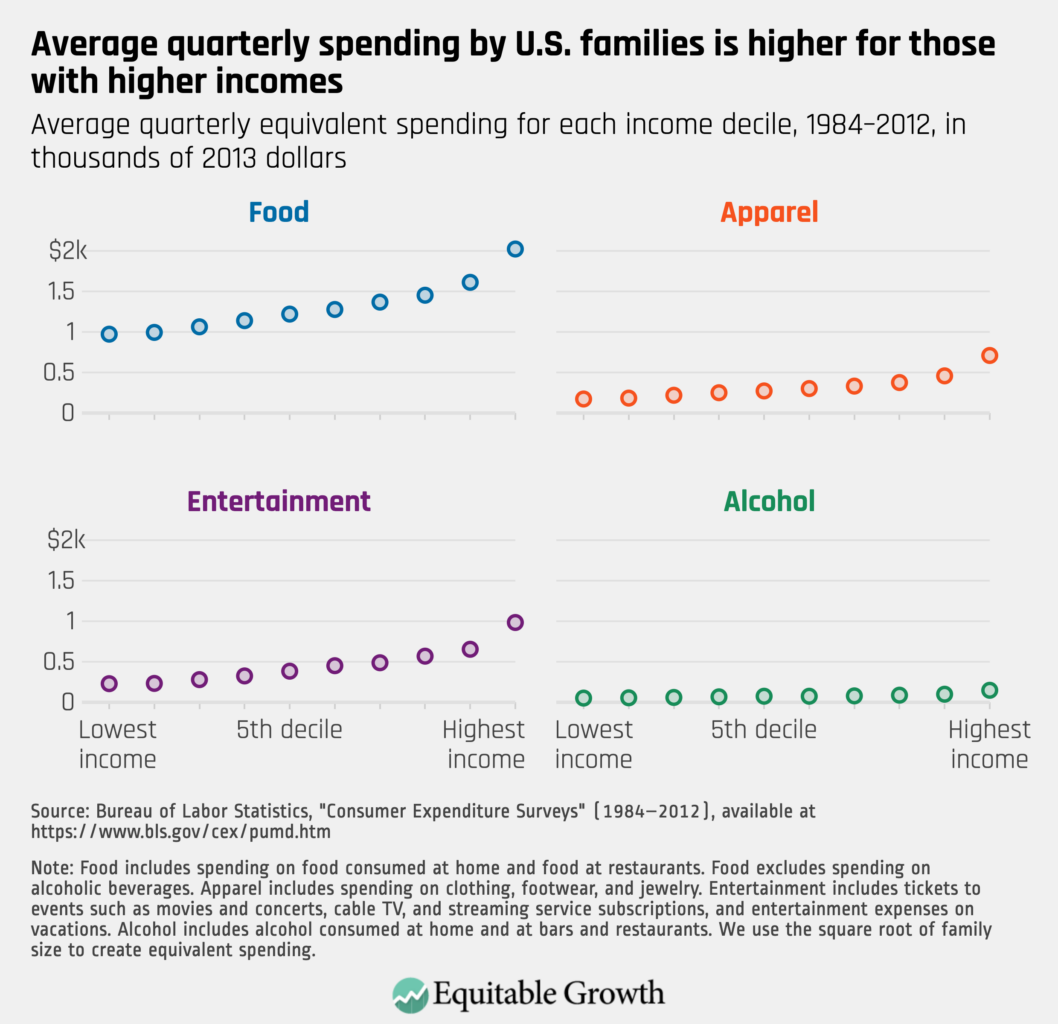
Figure 1 demonstrates that higher-income households spend more, but that’s not the whole story. We turn next in our working paper to understanding how consumption volatility differs across the income distribution and by family socioeconomic characteristics. We define volatility using a measure of transitory volatility. To calculate transitory volatility, we first find the average spending for each family over the four quarters. Next, we subtract each quarter’s spending from the average for that family. We then square this value and add up the squared differences for each quarter. Lastly, we divide this sum of the squared differences by three. This measure captures how spending in one quarter differs from average spending over the four quarters we observe among U.S. families. Larger values indicate higher spending volatility.
We find that food volatility is higher at the bottom than the top of the income ladder. When compared to base levels for households at the top, food volatility is more than twice as high for those households at the bottom of the income distribution. The bottom 20 percent experience higher consumption volatility than those with higher income, indicating that there is potentially worrisome food volatility, not solely for the poorest of the poor but also among the bottom 20 percent of U.S. households by income. (See Figure 2.)
Figure 2
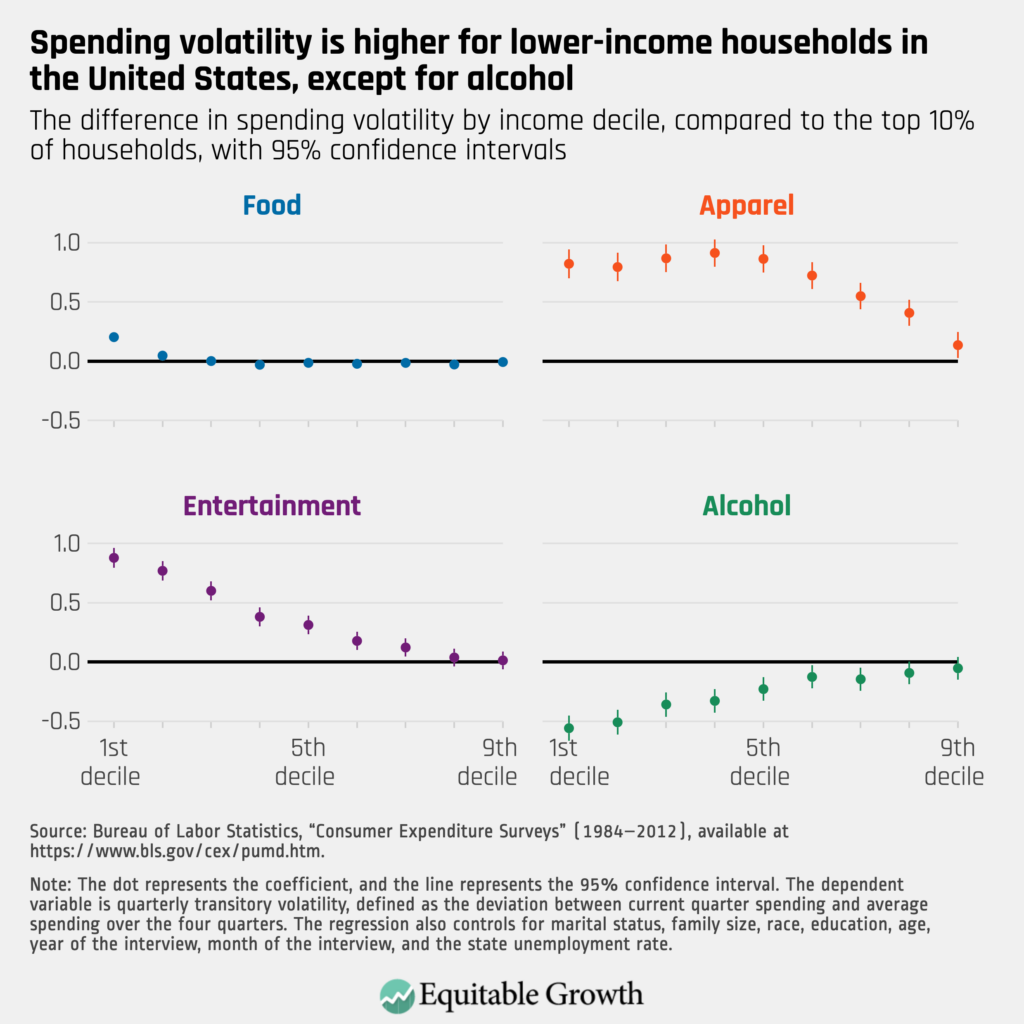
Differences in spending on different things by category also are telling, as are the reasons for the differences. Apparel represents clothing for all household members, including footwear, watches, and jewelry. Lower-income households may be able to forego apparel spending during lean times, which would lead to higher observed volatility. The apparel category follows the same pattern as the food category, insofar as consumption volatility for apparel is highest among the poorest families. For entertainment, the bottom decile exhibits higher consumption volatility relative to the top income decile, followed by a gradual decline in volatility.
Alcohol represents a departure from all previous results. Alcohol volatility is not highest for households at the bottom of the income ladder. Relative to those households at the top, alcohol volatility is lower at all deciles and lowest at the bottom. That said, alcohol consumption is a tiny fraction of spending for the bottom of the income distribution, as shown in Figure 1.
Our working paper sought to examine consumption volatility across the income distribution, but our findings also have important consequences for a broader understanding of how sociodemographics, such as educational attainment and race, and consumption are related. Broadly, those with less than a high school degree face greater volatility across all spending categories, except alcohol. Those with a college degree or higher face the lowest volatility across all consumption categories.
The link between consumption and educational attainment, the latter of which is highly correlated with income and race, can be viewed as a proxy for exposure to employment risks in an increasingly polarized U.S. labor market, where higher-level credentials lead to greater employment stability. Lower-wage workers have higher volatility in hours worked, reflecting lowered union bargaining power and worker protections.
 post
post
 Vision 2020
Similarly, households headed by Black individuals or by other non-White individuals have higher consumption volatility than households headed by White individuals, except for alcohol. Importantly, this is consistent with findings from other economic research on income volatility, which generally finds a similar sociodemographic pattern. This evidence is a useful complement to work showing that Black families, on average, have lower access to credit and lower wealth to buffer against labor market volatility. They are also more likely to be exposed to broader labor market risks to hours stability associated with low-wage work.
Consumption volatility is higher for Black individuals at the middle and top of the income distribution. Consumption volatility is relatively lower for Black individuals in the bottom of the distribution. This finding, alongside other research highlighted above, suggests that broader characterizations of well-being beyond income level are required to more fully capture economic security across race. Importantly, many middle- and high-income Black families lack the cushion from wealth to absorb income fluctuations and smooth consumption.
Overall, our findings provide convincing evidence that some of the most essential categories of consumption exhibit the highest volatility among lower-income households—households that were already consuming at relatively low baseline levels. Consumption volatility among the nation’s lower-income and socioeconomically disadvantaged families pose potentially serious consequences not just for their own overall economic security, such as worse health outcomes and lower educational performance, but also for their future well-being and economic mobility.
This damaging interplay between income inequality, consumption inequality, and economic security harms the broader U.S. economy and its potential for sustained, long-term growth. Policymakers need to take this evidence into consideration when designing income supports and social infrastructure investments to improve the livelihoods and well-being of U.S. workers and their families and the broader U.S. economy.