Four ways to understand the pay divide facing Asian American, Native Hawaiian, and Pacific Islander women

Tomorrow is Asian American and Pacific Islander Women’s Equal Pay Day.1 The day marks the point in 2021 until which, on average, Asian American, Native Hawaiian, and Pacific Islander women had to work—from the start of 2020 through March 9, 2021—to earn as much as White, non-Latino men earned in 2020 alone. Put differently, this group of women earns 85 cents for every dollar White men make.
Of course, there are big disparities between different subgroups among these women. For instance, Malaysian, Taiwanese, and Indian women’s median earnings surpass those of White men, while Nepalese women earn half as much as White men. Nonetheless, the coronavirus recession overall is hitting Asian American, Native Hawaiian, and Pacific Islander women workers hard.
Both AANHPI men and women workers are overrepresented among front-line workers. As the downturn hit, Asian American workers in the bottom of the earnings distribution suffered some of the largest reductions in wages. For Asian American, Native Hawaiian, and Pacific Islander women specifically, their overrepresentation in education, healthcare, and other service occupation, alongside the greater likelihood of living in multigenerational households in which both children and elderly persons might require care, translated into tough labor market outcomes.
Just one telling case in point: As of February 2021, 64 percent of unemployed Asian American women have been jobless for 27 weeks or more—a greater share than for any other group of workers. (See Figure 1.)
Figure 1
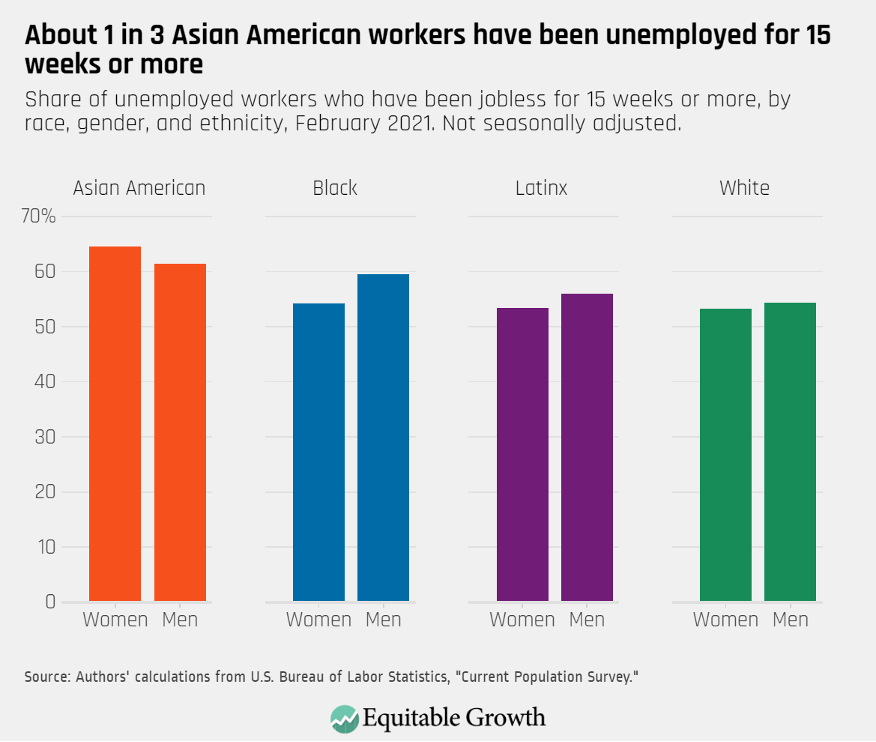
Asian American, Native Hawaiian, and Pacific Islander women are making important strides toward pay parity but continue to face disadvantages in the labor market
The pay disparity between White, non-Latino men and Asian American women narrowed over the past two decades, from 31 cents per dollar in 2002 to 13 cents per dollar in 2019.2 Yet a stubborn gap remains over time. Going further back, when studying the evolution of earnings of Japanese, Chinese, and Filipino American women from 1960 to 1990, Donald Mar of San Francisco State University finds that the difference between their actual and simulated earnings—the pay they would receive if they were treated as White women—narrowed significantly in the 1970s.
These findings suggest that the pay penalty these groups of women workers experienced vis-à-vis their White counterparts as a result of discrimination might have become less pervasive in the second half of the 20th century. Still, Asian American, Native Hawaiian, and Pacific Islander women continue to face important barriers and challenges in the labor market.
Workplace discrimination and longstanding gender norms affect AANHPI women’s career trajectories and access to job opportunities. In addition, occupational segregation entrenches inequality both between women and men and between different subgroups of AANHPI women. For instance, according to our analysis of the U.S. Census Bureau’s American Community Survey data, the largest number of Asian American women are employed as registered nurses, whereas for Native Hawaiian and Pacific Islander women, the most common occupation is that of cashiers—which, with an average wage of $11.73 per hour, is one of the lowest-paying jobs in the U.S. economy.
Asian American, Native Hawaiian, and Pacific Islander women face barriers to accessing the highest-paying jobs
AANHPI women run up against a “bamboo ceiling” that holds back their career trajectories despite representing an important share of the workforce of high-wage sectors such as information, finance, and professional services. Studies on the tech and legal services industries, for example, show that Asian American and Pacific Islander workers in general, and Asian American and Pacific Islander women workers in particular, are greatly underrepresented in upper-management and executive-level positions. Other research, analyzing Equal Employment Opportunity Commission data disclosed by five large Silicon Valley companies, finds that Asian American women represented almost 14 percent of the professionals in the sample, but only 3 percent of executives.
This phenomenon is not exclusive to the tech and legal industries. Research by ChangHwan Kim and Yang Zhao of the University of Kansas finds that even when accounting for factors such as demographic characteristics, years of work experience, field of study, industry, and region of residence, Asian American women with a college degree supervise fewer workers than their White counterparts. This evidence shows that Asian American women’s underrepresentation in positions of authority cannot be fully accounted for by so-called human capital variables, suggesting that discrimination and harmful stereotypes continue to present an obstacle that prevents many from accessing upper-level management jobs.
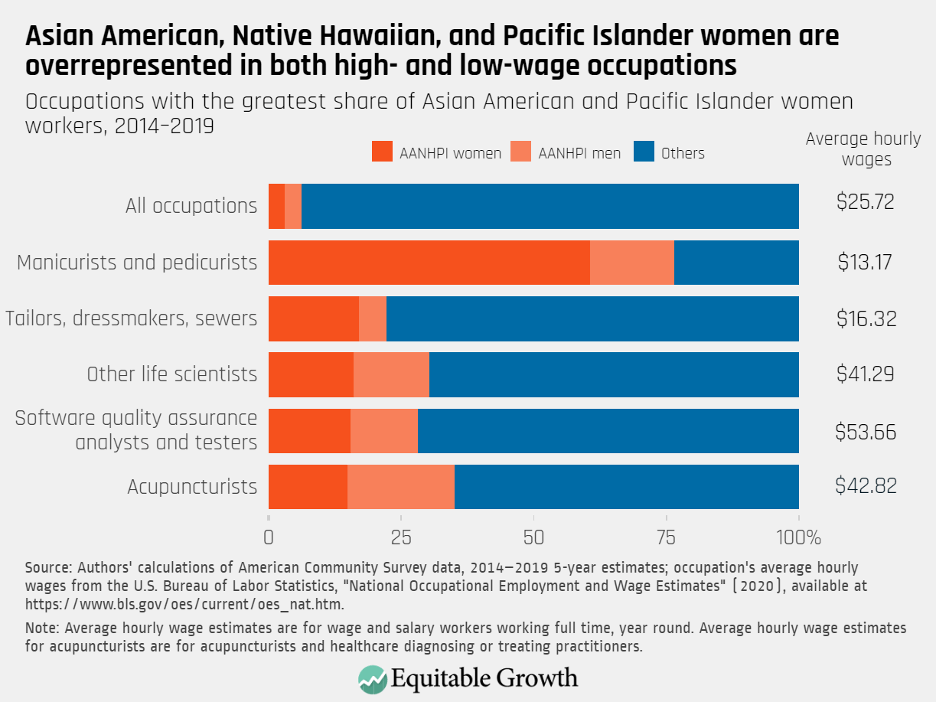
Asian American, Native Hawaiian, and Pacific Islander women are overrepresented in both high- and low-wage jobs
Occupational segregation—that some workers are overrepresented in some jobs and underrepresented in others—explains a chunk of the pay disparities between groups of workers. For Asian American and Pacific Islander women, this kind of job sorting means that they make up a disproportionately large share of both the best- and worst-paid jobs in the U.S. economy. An analysis by the National Women’s Law Center finds that Asian American and Pacific Islander women are overrepresented in the 40 occupations with the highest wages, as well as in the 40 occupations with the lowest wages. As such, even though AANHPI women make up just more than 3 percent of the U.S. workforce, they represent 61 percent of all manicurists and pedicurists and 17 percent of tailors, dressmakers, and sewers. In 2019, these occupations paid an average hourly wage of $16.32 or less—well-below the average for all occupations of $25.72 an hour. (See Figure 2.)
Figure 2
Yet there is evidence that Asian American, Native Hawaiian, and Pacific Islander women are making important progress toward greater occupational integration. For instance, an analysis by the Institute for Women’s Policy Research finds that as gender occupational segregation became less pronounced between the early 1970s and the early 2000s, Asian American and Pacific Islander men and women gained the most ground toward occupational integration. As such, by 2011, this group of men and women were much more likely to do the same kind of work than the men and women of any other major racial or ethnic group.
The different labor market experiences and economic outcomes among Asian American, Native Hawaiian, and Pacific Islander women point to the importance of disaggregating data
The variety of economic outcomes among AANHPI women are often obscured by a lack of data. Insufficient information therefore masks serious economic inequities between subgroups of workers, families, and communities. An analysis by the Pew Research Center, for example, finds that income inequality between Asian Americans skyrocketed between the early 1970s and the mid-2010s. Whereas they had the most even distribution of income of any major racial or ethnic group in 1970, by 2016, Asian Americans in the top 10 percent of the income ladder were making 10.7 times more than Asian Americans in the bottom 10 percent—a larger divide than the one experienced between their Black, White, and Latinx counterparts.
Disaggregated data, therefore, is an essential tool for understanding differences within the Asian American, Native Hawaiian, and Pacific Islander communities, gaining a better grasp of what is driving disparities in economic outcomes, and informing a policymaking process capable of alleviating those inequities.
End Notes
1. Some research and sources of data used in this column refer Asian American women, but not to Pacific Islanders or Native Hawaiians. In those instances, the term “Asian American” is used. When referring to our own analysis of American Community Survey data from the U.S. Census Bureau, the term “Asian Americans, Native Hawaiians, and Pacific Islanders” is used in order to highlight the experiences of the workers featured in our estimates. But there are also instances in which research and sources cited in this column use the term “Asian American and Pacific Islander.” In those cases, we use the term as it is used in the source material.
2. Authors’ calculations based on U.S. Census Bureau, “Current Population Survey, Historical Data, Table P-38: Full-Time, Year-Round Workers by Median Earnings and Sex” (n.d.), available at https://www.census.gov/data/tables/time-series/demo/income-poverty/historical-income-people.html. Median earnings are in 2019 dollars. Data for Asian American women are for “Asian alone.”