Equitable Growth’s Jobs Day Graphs: February 2022 Report Edition
On March 4, the U.S. Bureau of Labor Statistics released new data on the U.S. labor market during the month of February. Below are five graphs compiled by Equitable Growth staff highlighting important trends in the data.
Total nonfarm employment increased by 678,000 in February, and the employment rate for prime-age workers rose to 79.5 percent.

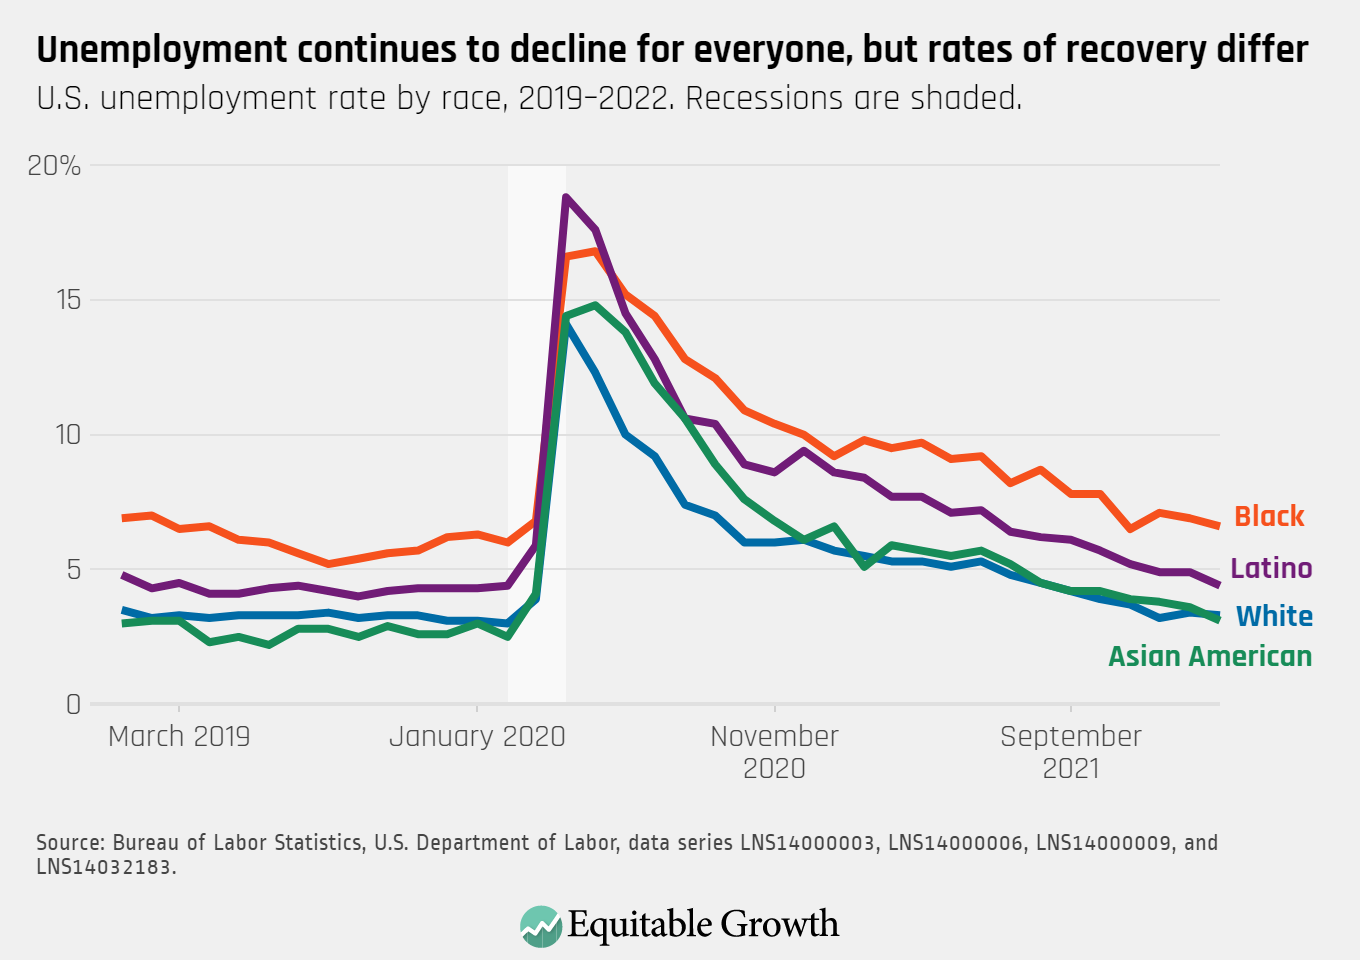
The unemployment rate fell slightly to 3.8 percent in February. It remains higher for Black workers (6.6 percent) and Latino workers (4.4 percent) compared to White workers (3.3 percent) and Asian American workers (3.1 percent).
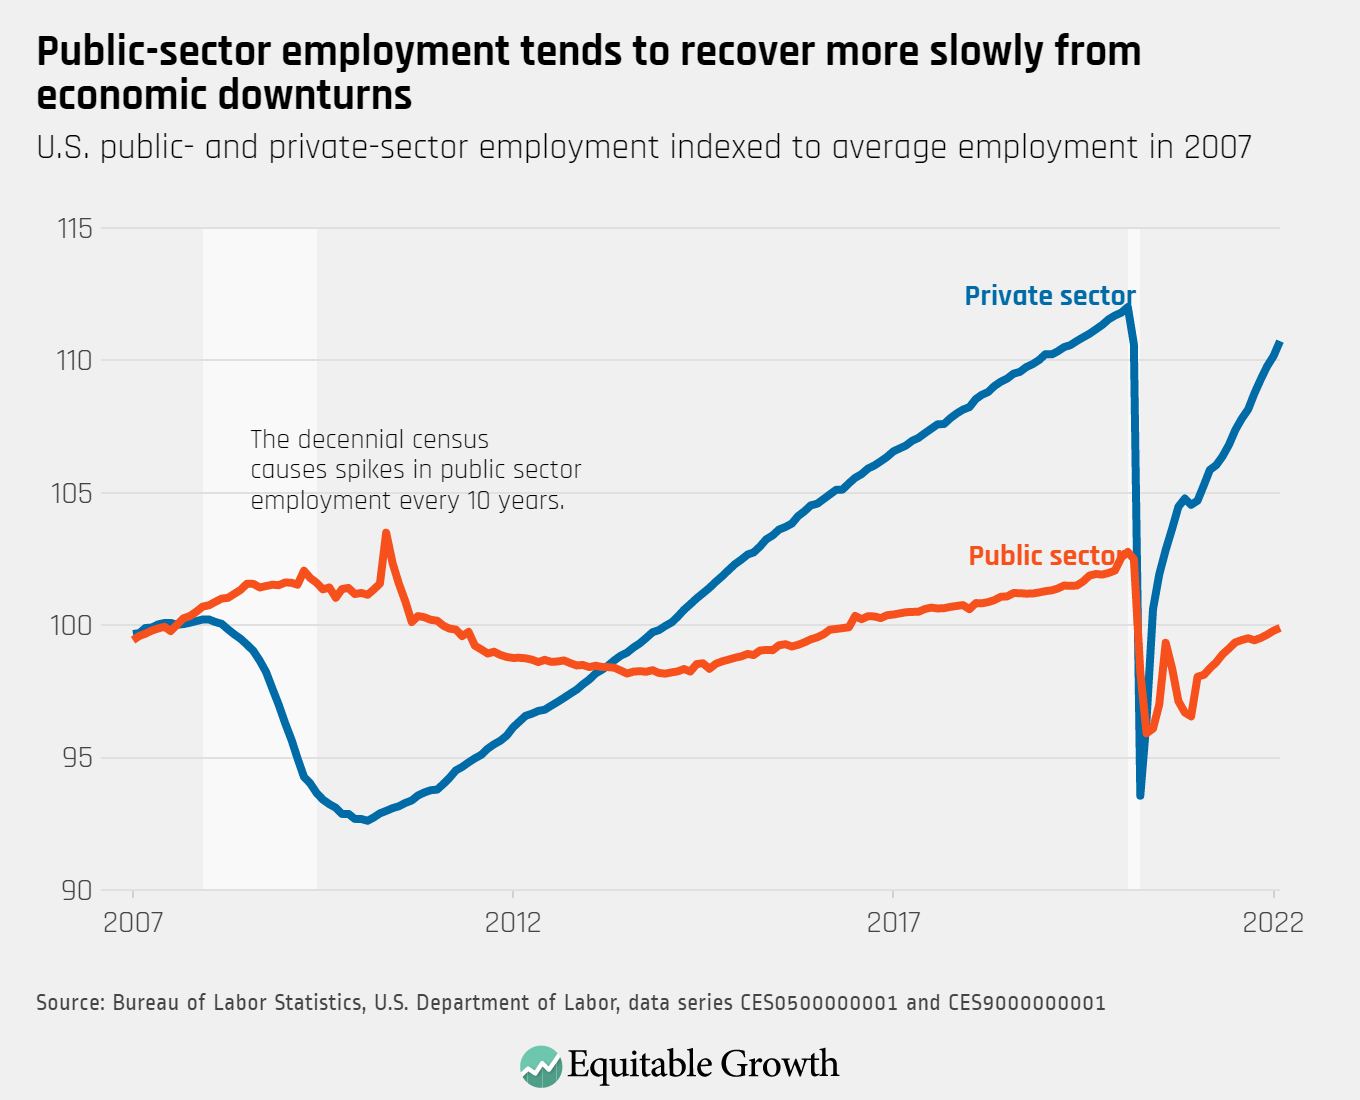
Private-sector employment continued to rise in February, while public-sector employment made modest gains and remains well below pre-crisis levels.
Unemployment rates fell to 4.3 percent for workers with less than a high school degree and 4.5 percent for high school graduates. The unemployment rate is 3.8 percent for workers with some college, and 2.2 percent for college graduates.

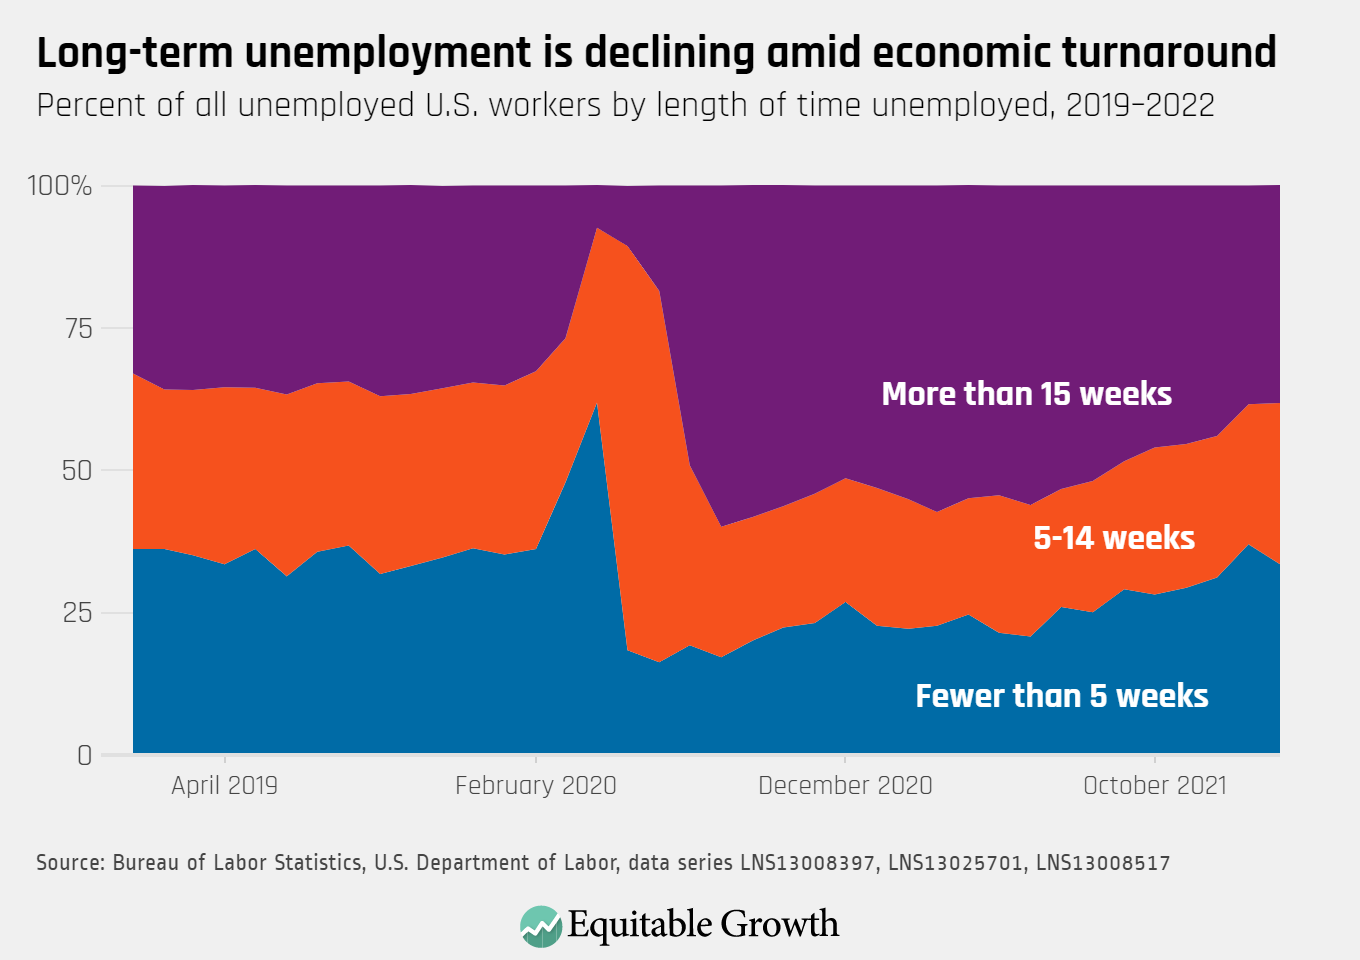
The proportion of unemployed U.S. workers facing long-term unemployment did not change dramatically last month, as 38.3 percent of unemployed workers have been out of work for more than 15 weeks. Another 28.3 percent have been out of work for 5-14 weeks, and 33.5 percent for fewer than five weeks.