Equitable Growth’s Jobs Day Graphs: March 2022 Report Edition
On April 1, the U.S. Bureau of Labor Statistics released new data on the U.S. labor market during the month of March. Below are five graphs compiled by Equitable Growth staff highlighting important trends in the data.
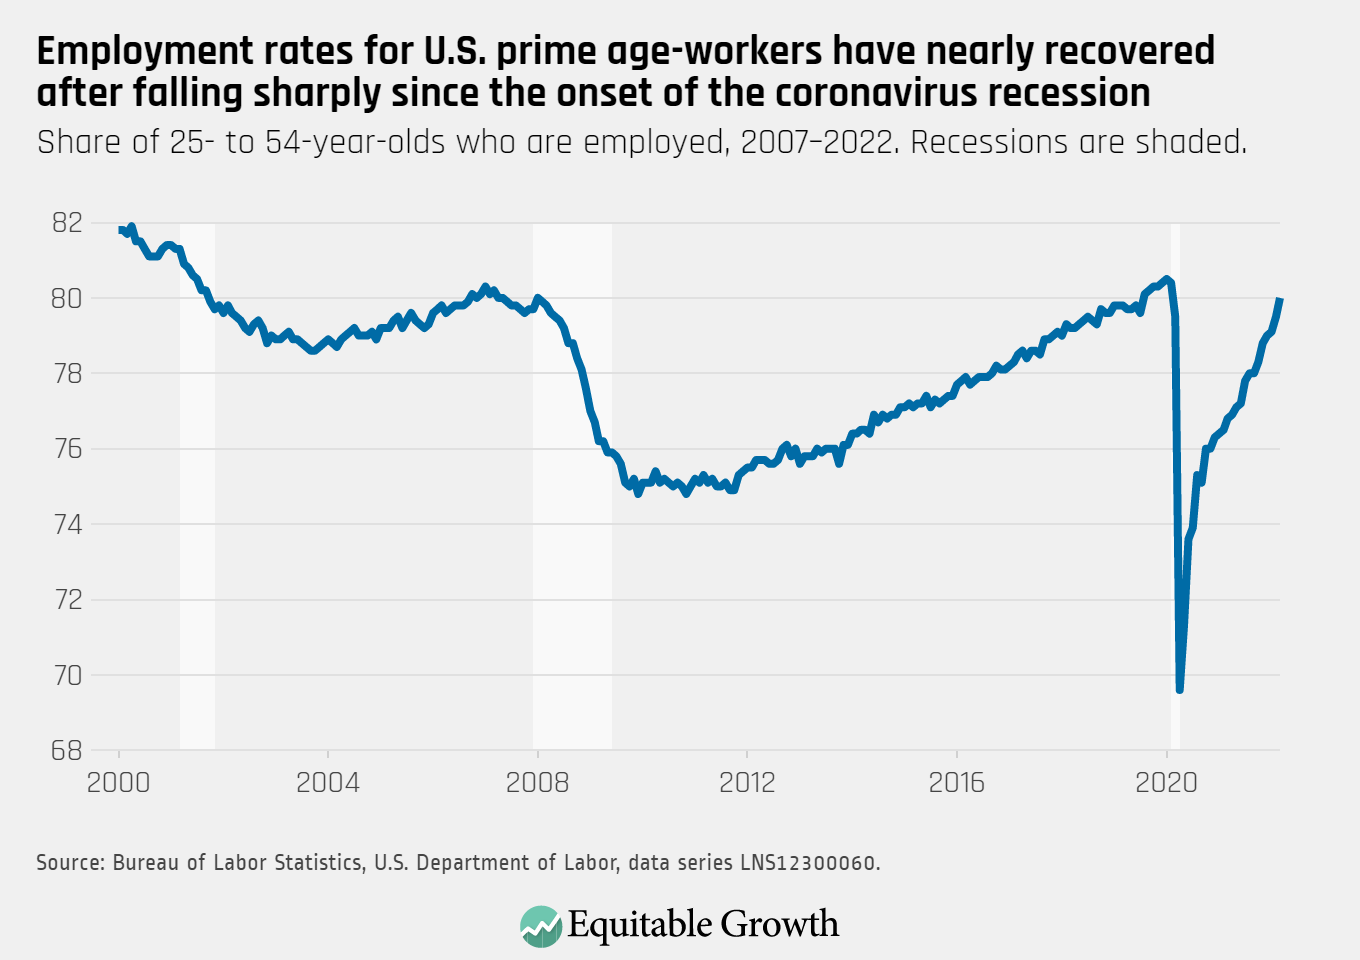
Total nonfarm employment rose by 431,000 in March, and the employment rate for prime-age workersincreased to 80.0 percent.
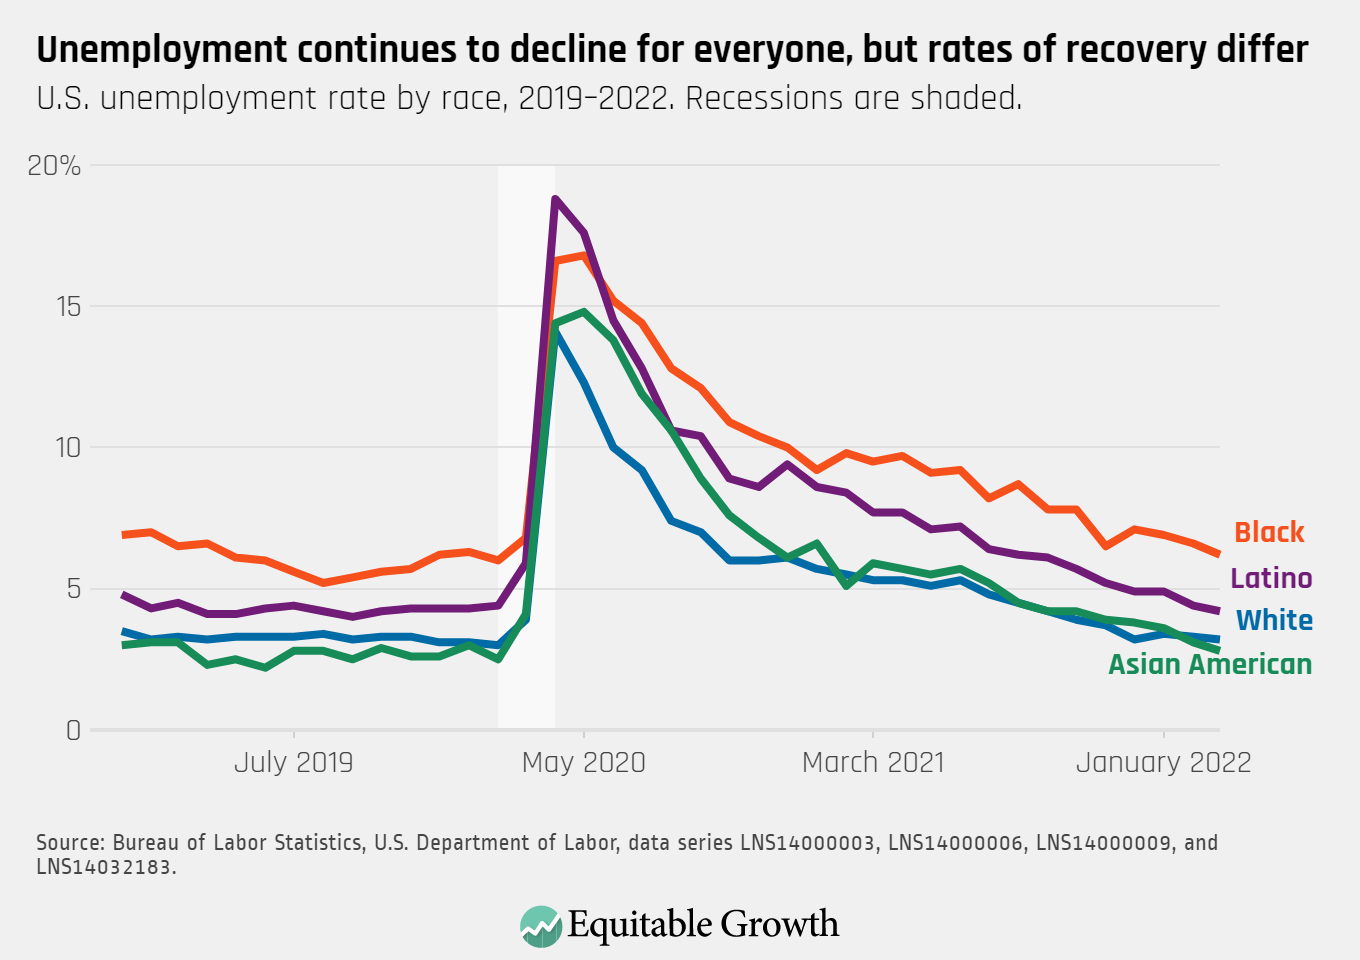
The unemployment rate fell to 3.6 percent. It remains higher for Black workers (6.2 percent) and Latino workers (4.2 percent) compared to White workers (3.2 percent) and Asian American workers (2.8 percent), but declined for all groups.
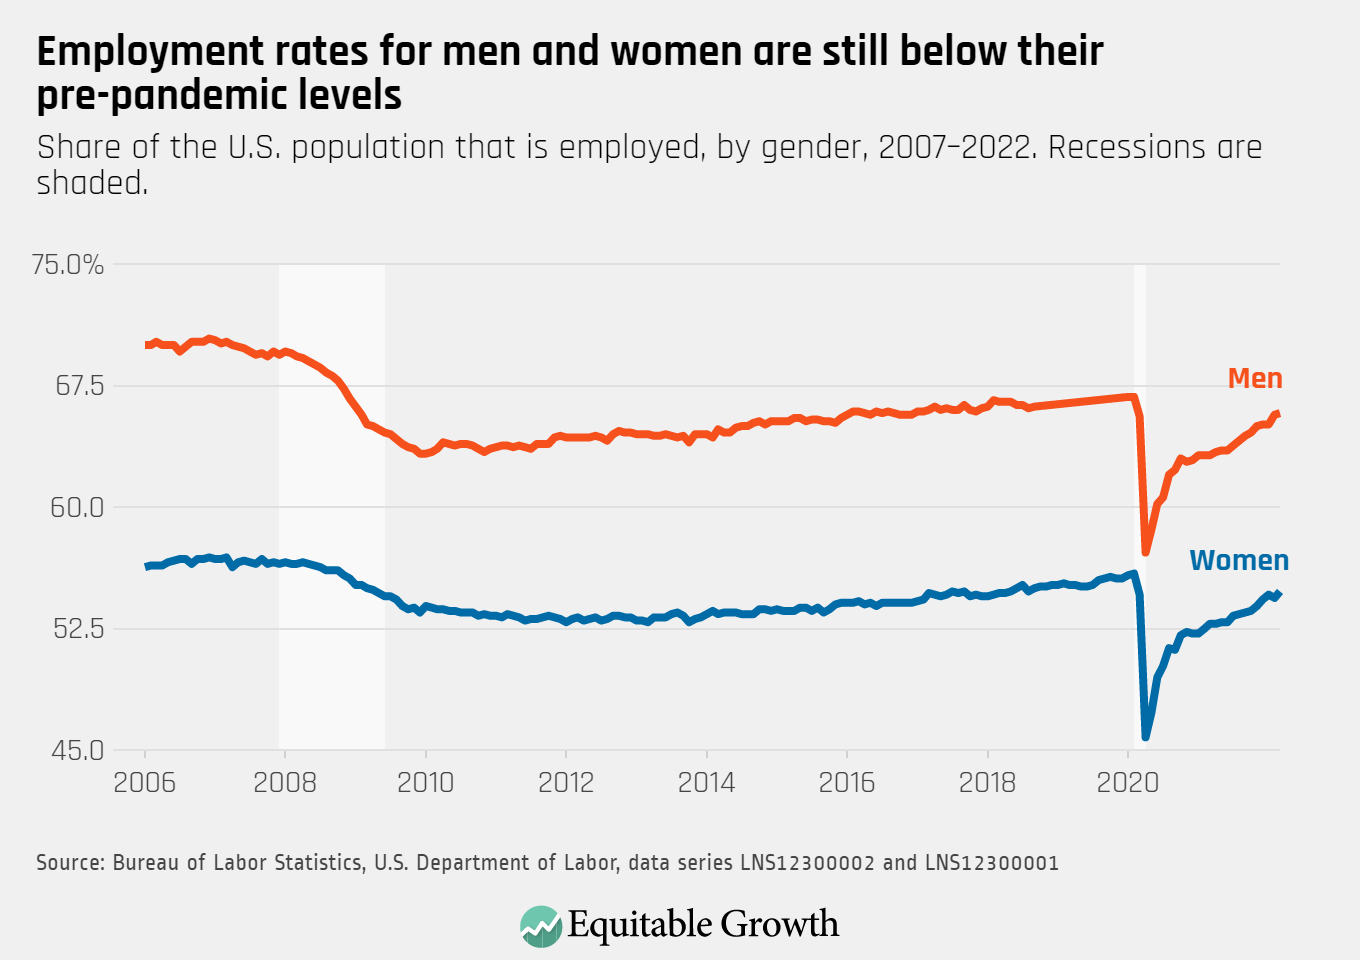
The overall employment rate rose in March to 65.8 percent for men and 54.8 percent for women, remaining below pre-pandemic levels for both groups.
Employment in many major industries, such as retail and construction, is now back to or approaching pre-pandemic levels, but employment in leisure and hospitality has yet to recover.

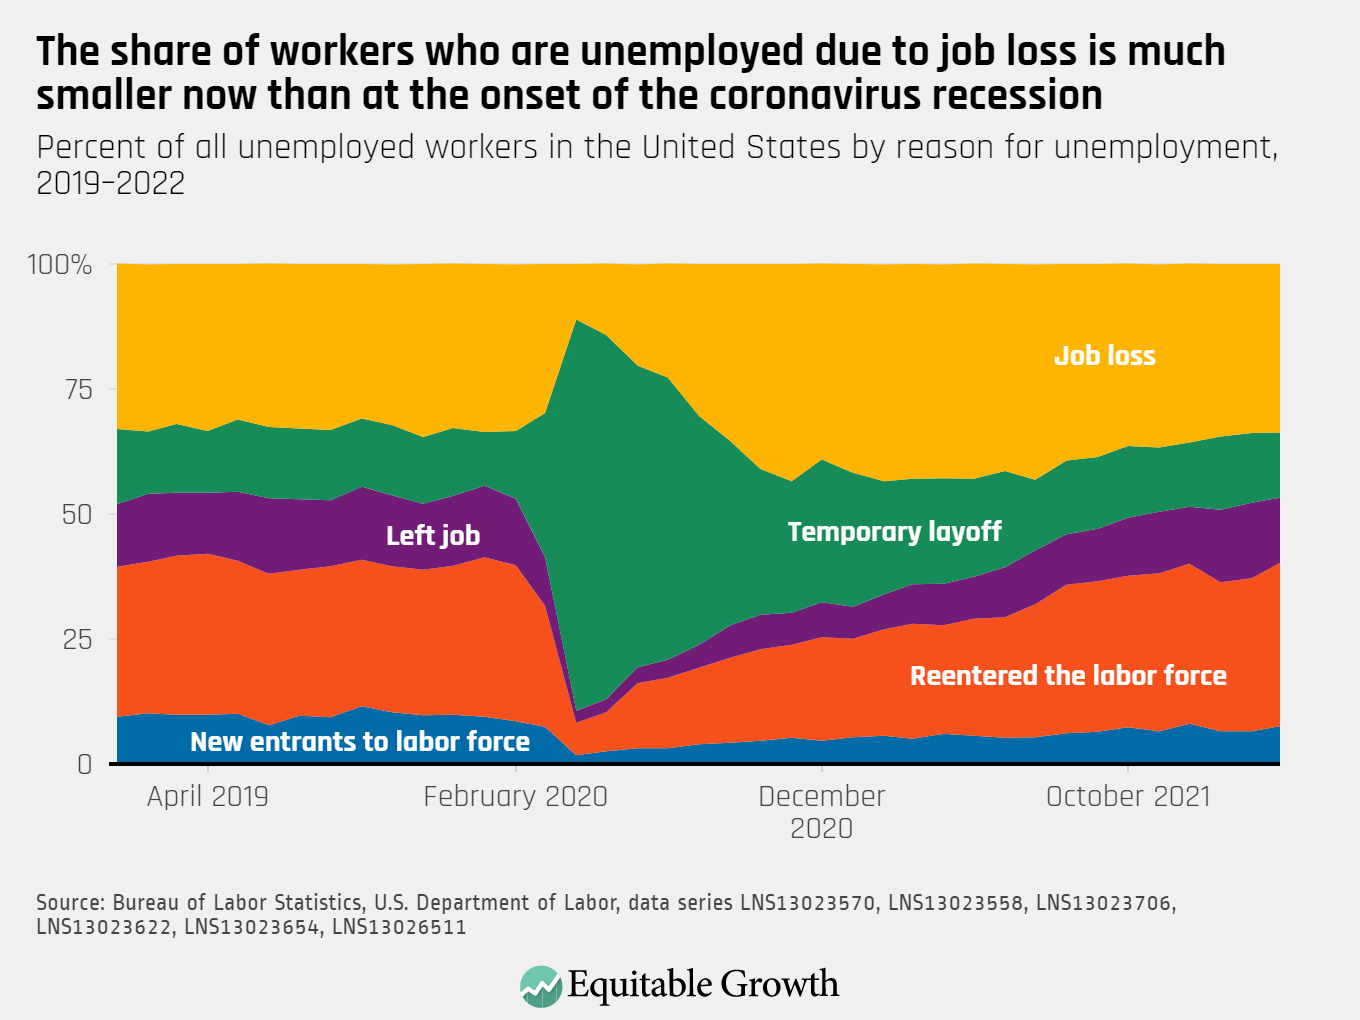
The number of unemployed workers fell by 318,000. One-third (33.7 percent) are unemployed due to job loss, and another third (32.7 percent) re-entered the labor force; 13.0 percent left their jobs, 13.0 percent are on temporary layoff, and 7.6 percent are new entrants.