Why the Infrastructure Investment and Jobs Act is good economics

""

Overview

President Joe Biden, in November 2021, signed the Infrastructure Investment and Jobs Act into law, providing $1.2 trillion in new government investments to create millions of jobs, increase U.S. economic competitiveness abroad, and help address the climate crisis. The multiple provisions of the law are now or will soon:

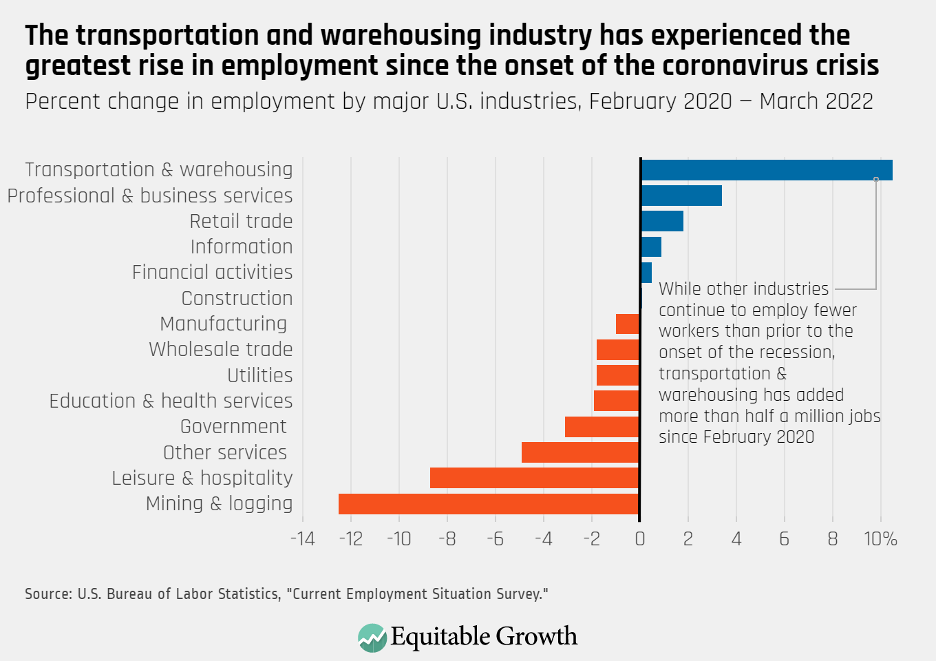
  • Create hundreds of thousands of jobs within the transportation sector, with investments in passenger and freight rail, bridges, roads, airports, ports, and public transit
  • Guarantee safe drinking water by eliminating the nation’s lead-tainted service lines, especially in disadvantaged communities that need refurbishing the most
  • Reduce supply chain bottlenecks to help ease inflation and lower the cost of goods and services
  • Build a national network for electric vehicle charging stations
  • Manufacture solar panels, wind farms, batteries, and electric vehicles to help address climate change
  • Make high-speed internet affordable and accessible

These much-needed investments are not only delivering significant macroeconomic benefits now, and will continue to do so well into the future, but also potentially addressing longstanding economic inequalities. Indeed, the new infrastructure investments and the jobs created by these investments can reduce these inequalities, increase unionization, and address climate change because they rest on sound economic principles.

In this issue brief, we demonstrate why the Infrastructure Investment and Jobs Act of 2021 and its focus on equitable growth is good economics. First, we outline the ways in which the law helps to address urgent needs currently facing the United States. Next, we discuss how the law’s focus on equity, unionization, and climate are crucial for a healthy economy with strong, stable, and broadly shared growth. We conclude by discussing the impact the law can have on addressing inequalities in our economy and share recommendations for a path forward.

The Infrastructure Investment and Jobs Act addresses urgent needs

The passage of this law in November 2021 signaled a commitment by the federal government to reinvigorate physical infrastructure in the United States. The bulk of the investments are going toward roads and bridges, power systems, railways, broadband, water systems, and public transit. The deterioration of the nation’s physical infrastructure is well-documented. Following World War II, the United States made public investments to build an interstate highway system, airports, a network of waterworks, and expanded port facilities and other infrastructure that significantly boosted the country’s economic output. Much of this infrastructure is now in critical need of repair.

Take roads, for example. According to the latest research from the American Society of Civil Engineers, almost half of U.S. roads are in poor or mediocre condition due to wear and tear. Research indicates this deterioration costs motorists nearly $130 billion each year in extra vehicle repairs and operating costs.

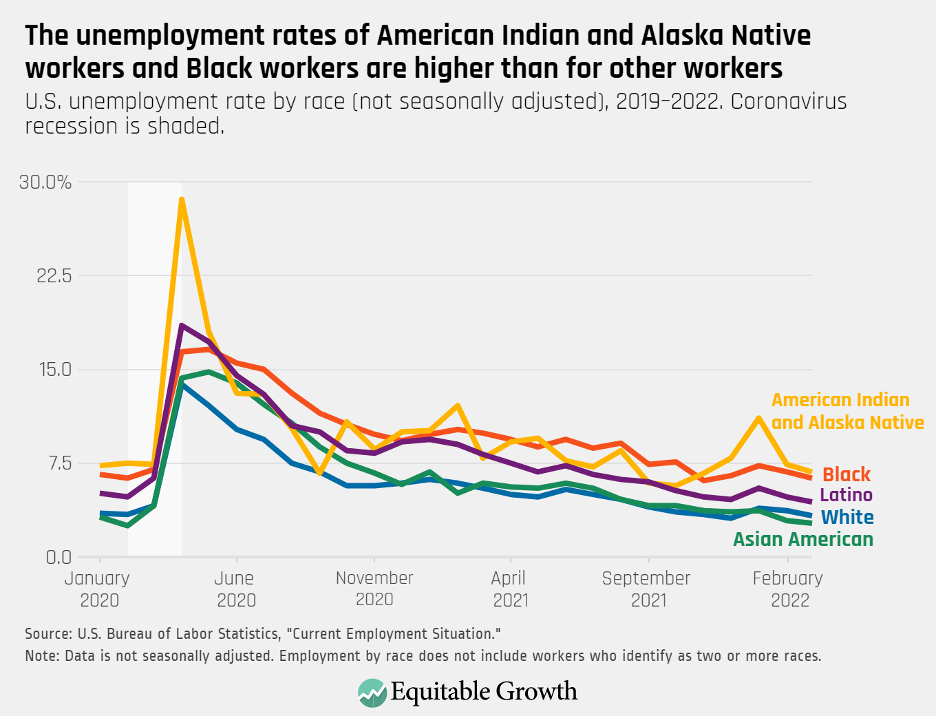
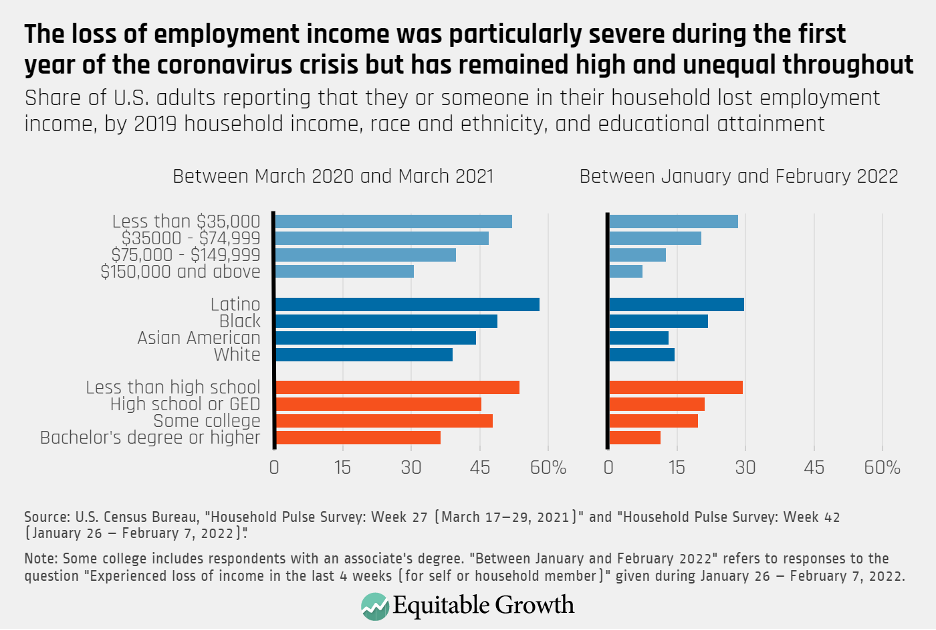
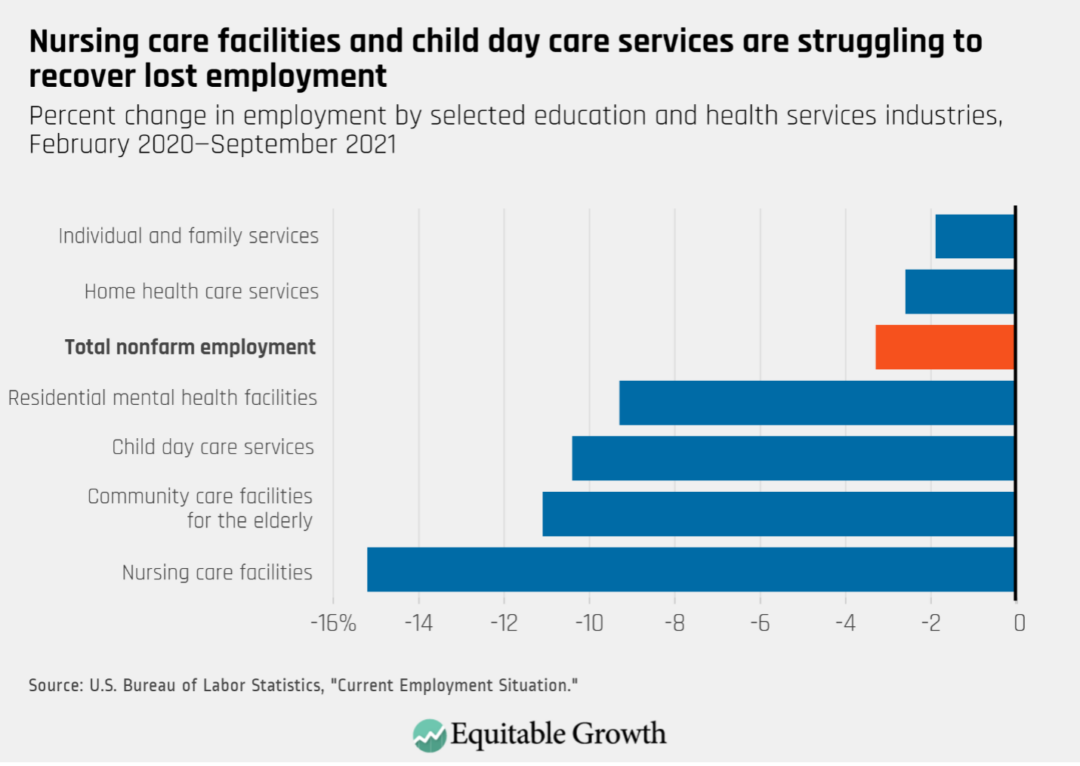
Water infrastructure is another example of an area badly needing investment. Neglected and old water infrastructure poses a serious public health risk, with some estimates showing that up to 10 million U.S. households and 400,000 schools and child care centers lack safe drinking water. This lack of clean drinking water disproportionately affects Black, Latino, and Indigenous individuals.

In addition to improving older infrastructure, expanding infrastructure such as broadband is imperative. Some estimates indicate that 30 million people in the United States live in areas where broadband infrastructure is inadequate. According to the latest data from the Organisation for Economic Co-operation and Development, the United States has the second-highest broadband costs among the 35 developed OECD countries studied.

Disparities in access to quality broadband infrastructure are pronounced. Research by the U.S. Department of Housing and Urban Development finds a strong association between household income and in-home connectivity—a pattern that persists across both rural and urban communities. The study finds that, overall, two-thirds of U.S. adults ages 18 and older had access to broadband internet in their homes, but just 41 percent of adults with household incomes of less than $20,000 had access, while 90 percent of adults with household incomes higher than $100,000 had access.

Moreover, a report by Dominique Harrison of the Joint Center for Political and Economic Studies finds that in rural counties in the Southern region of the country with populations that are at least 35 percent Black, 38 percent of Black residents in these areas lack home internet access. This is nearly double the rate of White residents in the same counties. The consequences of not having internet access are severe. Students need broadband to access the internet to do homework and apply to colleges. Working families need it to apply for jobs and to more easily access various government services, and seniors are increasingly reliant on broadband accessibility to connect to the growing world of telehealth.

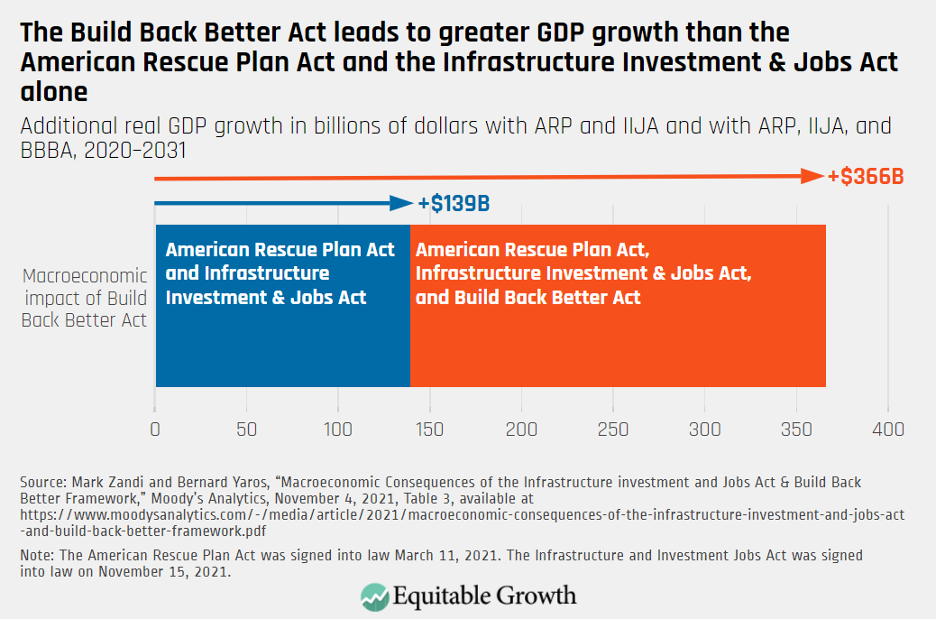
There are macroeconomic benefits to the new investments happening or starting to happen because of the Infrastructure Investment and Jobs Act as well. Investments in infrastructure generally tend to yield a high rate of return, meaning increases in public investments in infrastructure significantly result in increased output and productivity. It is well-documented that infrastructure investments have large multipliers—that is, a proportionally higher increase in Gross Domestic Product for every dollar increase in investment—with infrastructure spending having substantially higher multipliers than other fiscal interventions, such as tax cuts.

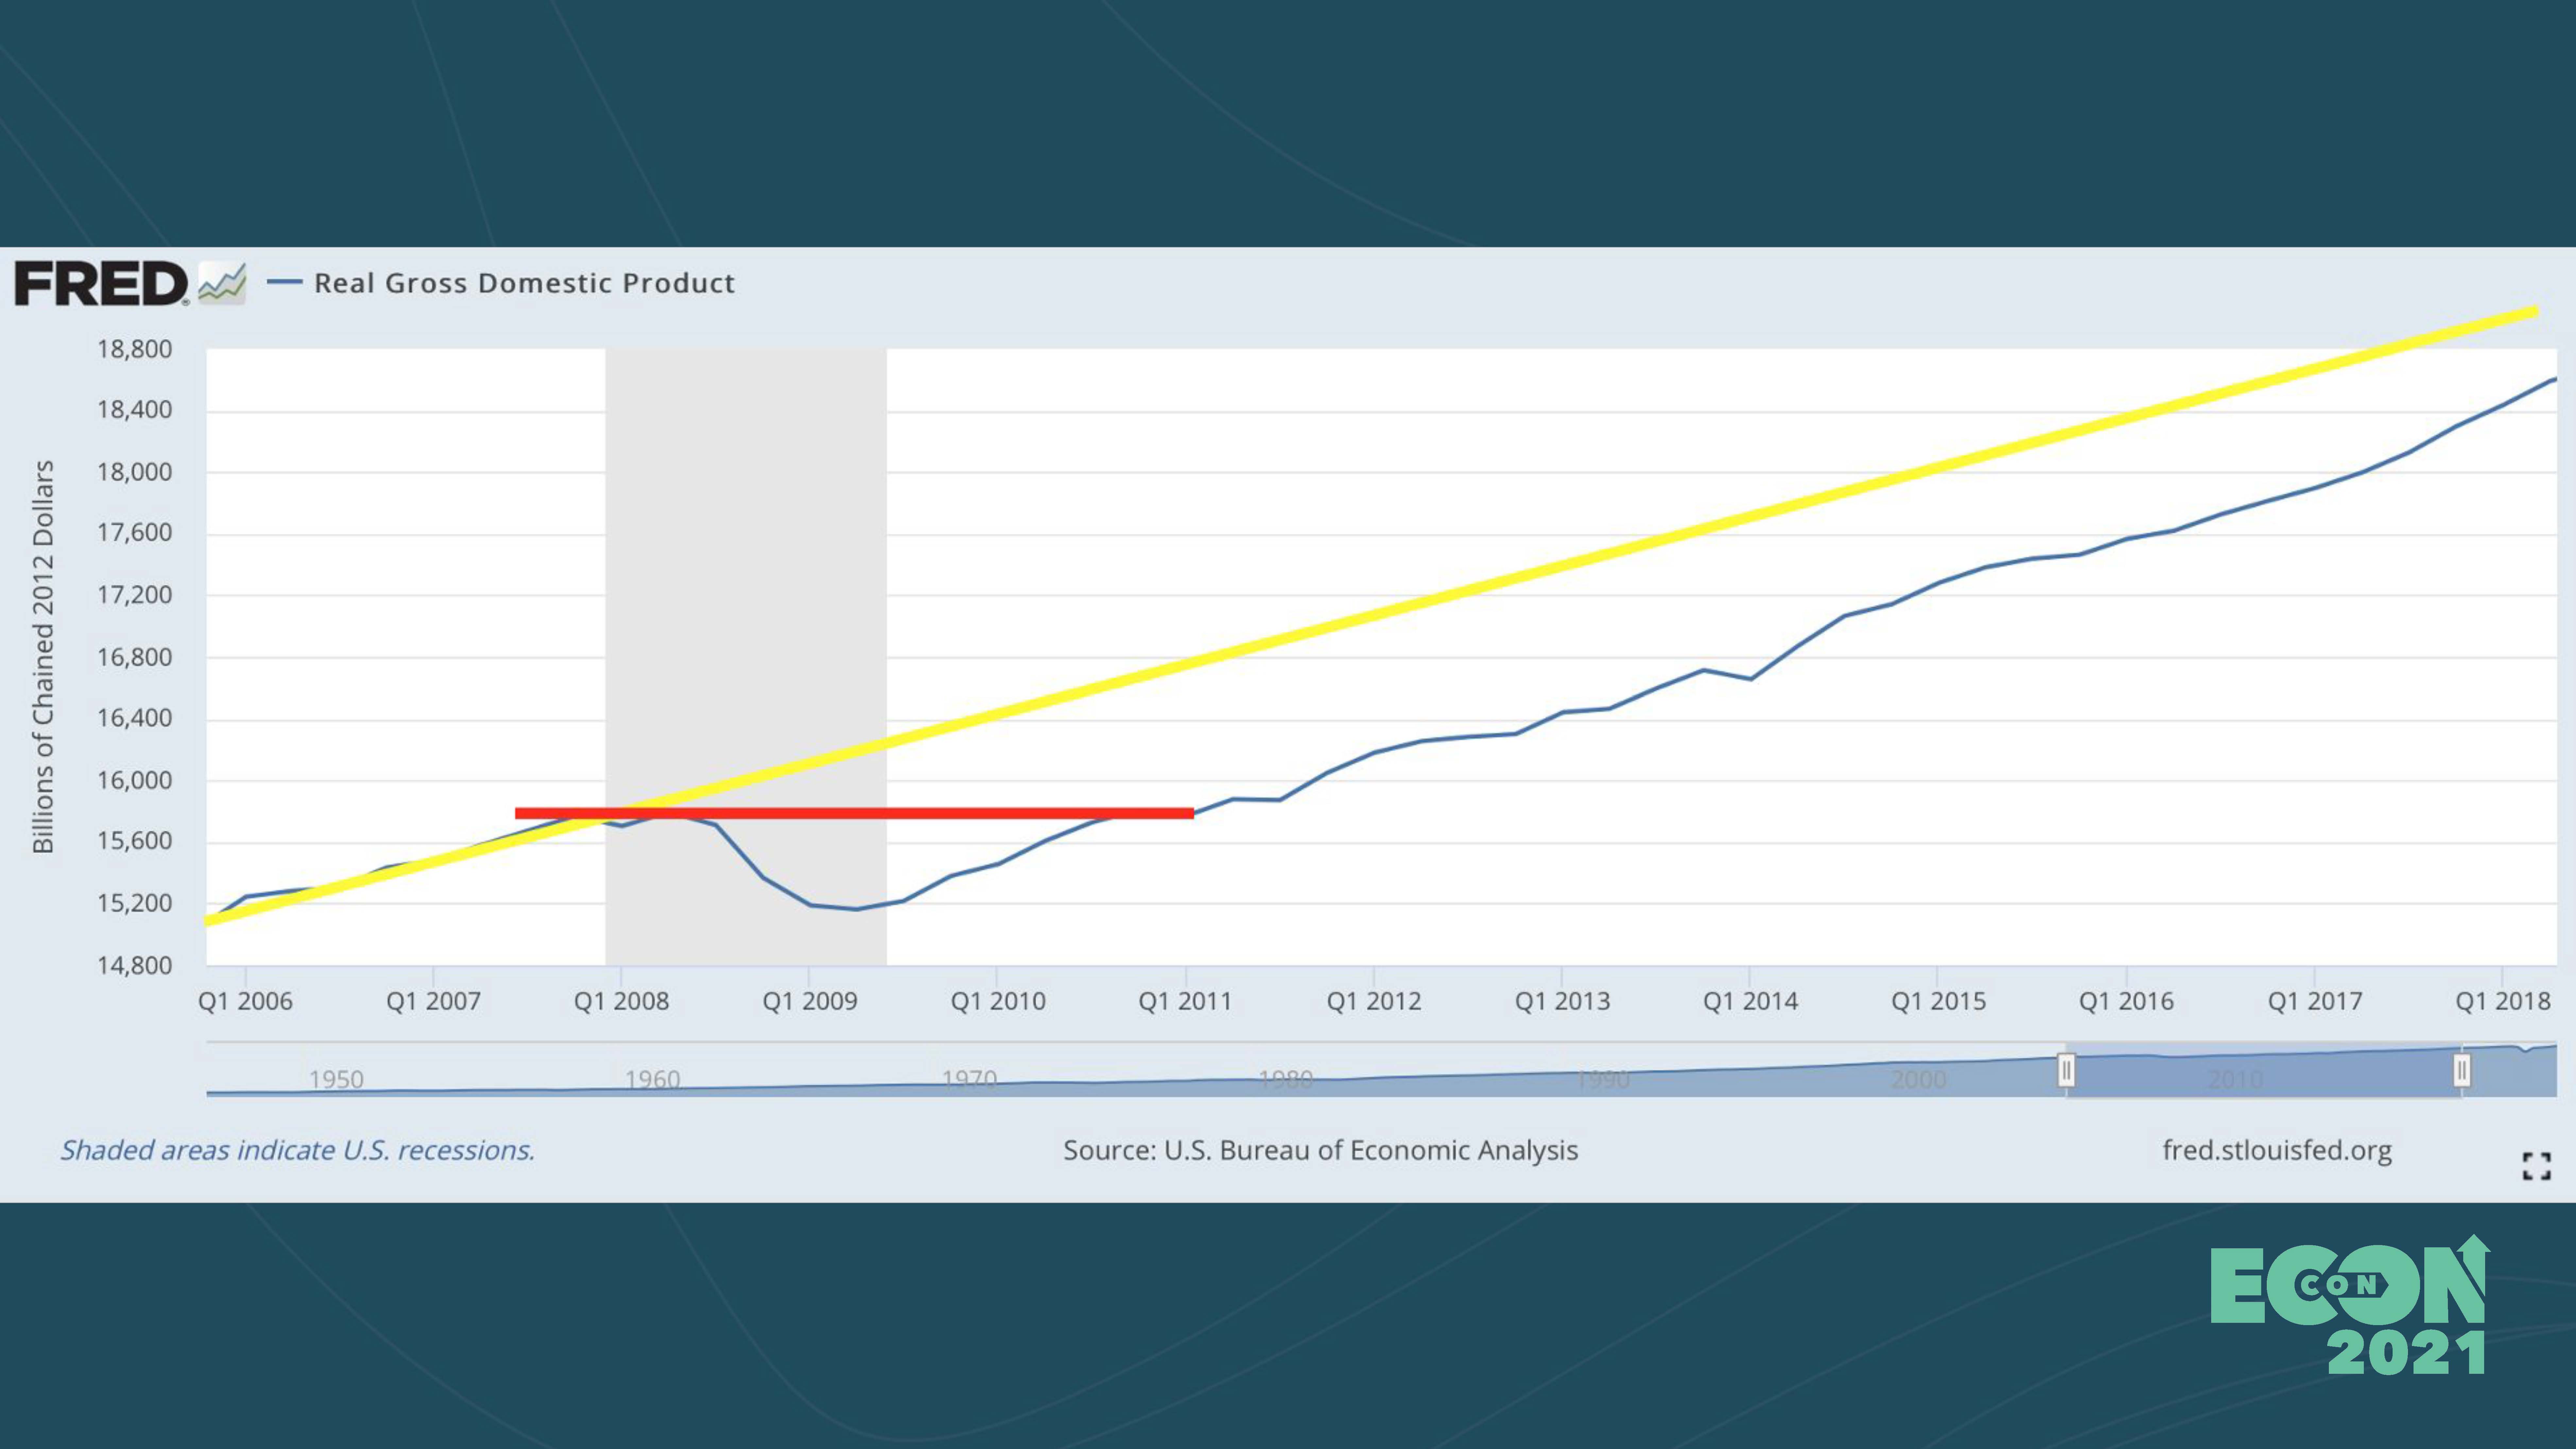
In particular, Mark Zandi and Bernard Yaros of Moody’s Analytics write that at the apex of economic growth generated by the new infrastructure investments in 2023, real GDP is forecast to increase 2.9 percent, compared to 2.3 percent if only the American Rescue Plan (which was passed in March 2021) had been passed into law. Zandi and Yaros also project that in the long term, the U.S. economy receives a bump in productivity growth due to the increase in the stock of public infrastructure. Recent projections made by the Congressional Budget Office, which take the Infrastructure Investment and Jobs Act into account, suggest productivity will increase 1.5 percent on average over the next decade.

The Infrastructure Investment and Jobs Act also encompasses the important need to address economic inequity, unionization, and climate in any large job-creation efforts in the United States. Each of these issues cannot be easily separated from one another. In fact, these components frequently intersect, forming a matrix that provides a more comprehensive picture of economic growth and well-being. We next examine why these components matter and how they contribute to building an economy with broadly shared growth.

Economic equity, unionization, and climate

The investments that the Infrastructure Investment and Jobs Act makes to reduce economic inequalities, increase unionization, and address climate change rest on sound economic principles. We outline some of the ways the law addresses these three pillars and examine how these pillars are important for promoting strong, broadly shared economic growth.

One of the ways the law helps to ameliorate inequalities in the U.S. labor market is by mandating that the “overwhelming majority” of the funds will be subject to Davis-Bacon requirements. These requirements ensure that contractors pay workers on construction projects—in which the new funding makes major investments—a prevailing wage, so that local wages, labor markets, and workers won’t be undercut. While there are limitations to this approach, as we discuss below, it is nevertheless one tool to raise the wage floor and, similar to minimum wage increases, can address gender and racial inequalities and wage divides.

These public investments also focus on tackling climate change, such as $7.5 billion in investments to build out a national network of electric vehicle chargers in the United States. These kinds of investments will result in the creation of green manufacturing jobs. As one of the co-authors of this issue brief testified before the Joint Economic Committee, economic research demonstrates the importance of investments in green energy.

For instance, Columbia University economist Joseph Stiglitz, alongside other colleagues, argues that renewable energy and energy efficiency investments typically have high multipliers, delivering even greater returns over time. They also tend to create more jobs, compared to fossil fuel investments, including ones that can’t be taken offshore, such as those in home energy retrofitting. Further, recent research from Ioana Marinescu of University of Pennsylvania and E. Mark Curtis of Wake Forest University suggests there is a pay premium for green jobs, especially for green jobs with a low educational requirement.

Moreover, according to recent research from Heidi Garrett-Peltier, an economist at the University of Massachusetts Amherst, for every $1 million invested in renewable energy or energy efficiency, almost three times as many jobs are created than if the same money were invested in fossil fuels. Investing more money in the fossil fuel industry will not address high and growing unemployment rates. Indeed, the Federal Reserve is not even requiring companies to keep workers as a condition for getting loans in the fossil fuel industry.

Leah Stokes and Matto Mildenberger, both assistant professors of political science at the University of California, Santa Barbara, highlight that many U.S. unions maintain strong ties to carbon-intensive industries, such as auto manufacturing or heavy industry. By contrast, many jobs in the clean energy sector—from clean energy deployment to electric vehicle manufacturing—remain nonunionized.

In part, this pattern reflects the decline in union participation across new U.S. industrial sectors. In order to address labor market disparities—such as gender and racial wage divides—government funding for clean energy projects should prioritize unionized jobs. Indeed, with funds dedicated to infrastructure projects that can help create unionized jobs, the 2021 infrastructure investment law takes a step in the right direction to increasing worker bargaining power.

The benefits of prioritizing unionized jobs for creating broadly shared growth cannot be understated. Unions are shown to have an inverse relationship with income inequality. Moreover, while union members have higher wages than their nonunionized peers—what researchers call the union wage premium—organized labor may create conditions that make all workers better-off. Strong unions are able to set job-quality standards that nonunion businesses have to meet in order to compete for workers, which is known as the spillover effect.

Unions play an important role in addressing racial inequality. Even though the majority of union members were White and male during the height of the U.S. labor movement in the mid-20th century, organized labor strongly supported redistributive public policies that contributed to narrowing racial and gender pay gaps. Research shows, for example, not only that there is a larger union wage premium for Black workers, but also that unions reduce racial animosity among workers.

There are other ways these new investments address racial equity. In addition to investments in both water and broadband infrastructures discussed above, there are investments to clean up Superfund sites, which are contaminated sites caused by hazardous waste being dumped, left out in the open, or otherwise improperly managed. These sites include manufacturing facilities, processing plants, landfills, and mining sites. Investments in cleanup efforts will benefit Black and Hispanic communities, which, compared to predominantly White communities, are located disproportionately within 3 miles of a Superfund site.

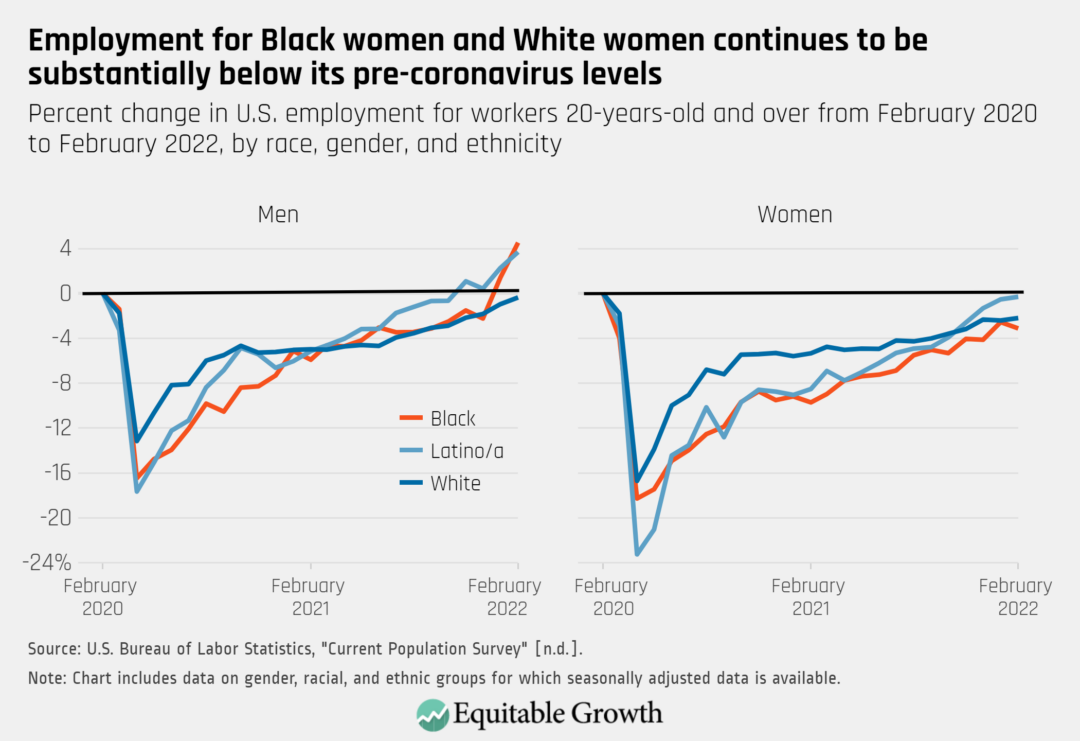
Or consider the hundreds of thousands of new jobs that will be created over the course of a decade, alongside the quality—not just the quantity—of those jobs. Research by Kate Bahn of the Washington Center for Equitable Growth and Mark Stelzner of Connecticut College shows that characteristics specific to race and gender, such as the lower levels of wealth in Black and Latino households and increased household responsibilities for women, make workers of color and women more susceptible to exploitation by employers, with Black women and Latina workers facing both race and gender penalties and thus being exploited even further.

These hurdles reduce worker power by restricting workers’ ability to seek other, better-paying, and more interesting jobs, which gives employers more power to reduce wages for these particular groups of workers. Research conducted by one of the co-authors of this issue brief demonstrates that Black women experience a “double gap,” which is the reinforcing confluence of the gender wage gap and the racial wage gap. The double gap helps to explain why Black women workers earn the least in wages, on average, compared to their working counterparts among White men, White women, and Black men. The double gap costs Black women workers approximately $50 billion in involuntarily forfeited earnings—a large and recurring annual loss to the Black community.

For decades, the prevailing wisdom in policymaking circles was that there is a trade-off between equity and economic growth. This conventional belief argues that reducing economic inequality would require such heavy-handed interference in markets that growth would be stifled. Yet there is mounting evidence that suggests otherwise. For the past near-half century, economic inequality has risen in income and wealth, yet the U.S. economy has not experienced stronger or more sustained economic growth. Advancing economic policies that seek to redress these structural inequalities will benefit all U.S. workers and their families and help promote an economy with strong, stable, and broadly shared growth. Failing to address these inequalities leaves our whole economy vulnerable.

Robert Lynch of Washington College finds that closing racial and gender disparities would have resulted in an increase in U.S. GDP of $7.2 trillion in 2019. According to Lynch, GDP could have totaled $28.6 trillion instead of $21.4 trillion that year. Lynch also finds that federal, state, and local tax revenues would have been $1.82 trillion higher in 2019, while the overall U.S. poverty rate would have dropped from 10.5 percent to 6.6 percent, lifting 12.2 million people out of poverty. What’s more, there would have been a $429 billion improvement in the finances of the U.S. Social Security system in 2019.

Remaining questions and recommendations

The Infrastructure Investment and Jobs Act of 2021 is a historic piece of legislation that makes much-needed investments in traditional infrastructure, yet many of these investments in traditional infrastructure will create jobs in industries traditionally dominated by men. Questions remain about how to ensure the jobs created by this law are equitably distributed and do not leave women, including women of color, at the margins of the U.S. economy yet again.

Black women, for example, experience significant occupational segregation, with five occupations accounting for more than half of all the jobs in which Black women work. This is consistent with a large body of economic literature that shows women, including Black women, tend to be crowded primarily in low-wage occupations. These occupations, in fact, are often low wage precisely because of their association with Black women, especially compared to other occupations that may require similar levels of training or skills but are dominated by White male workers.

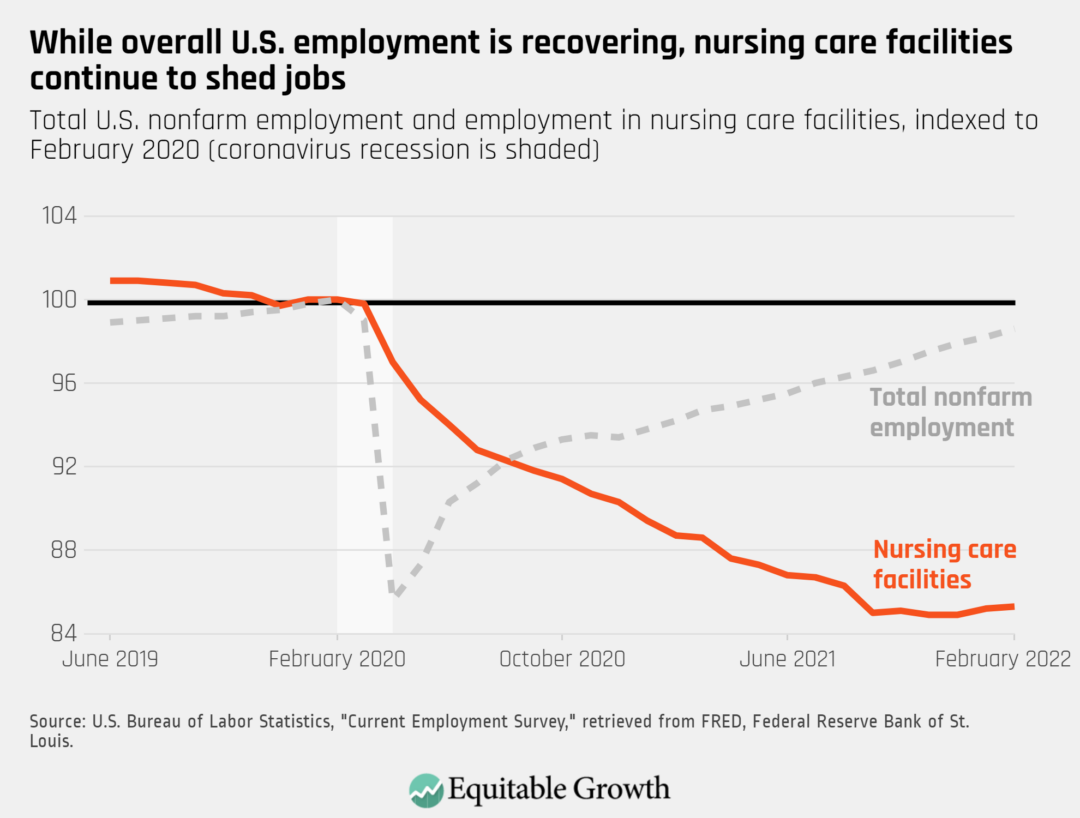
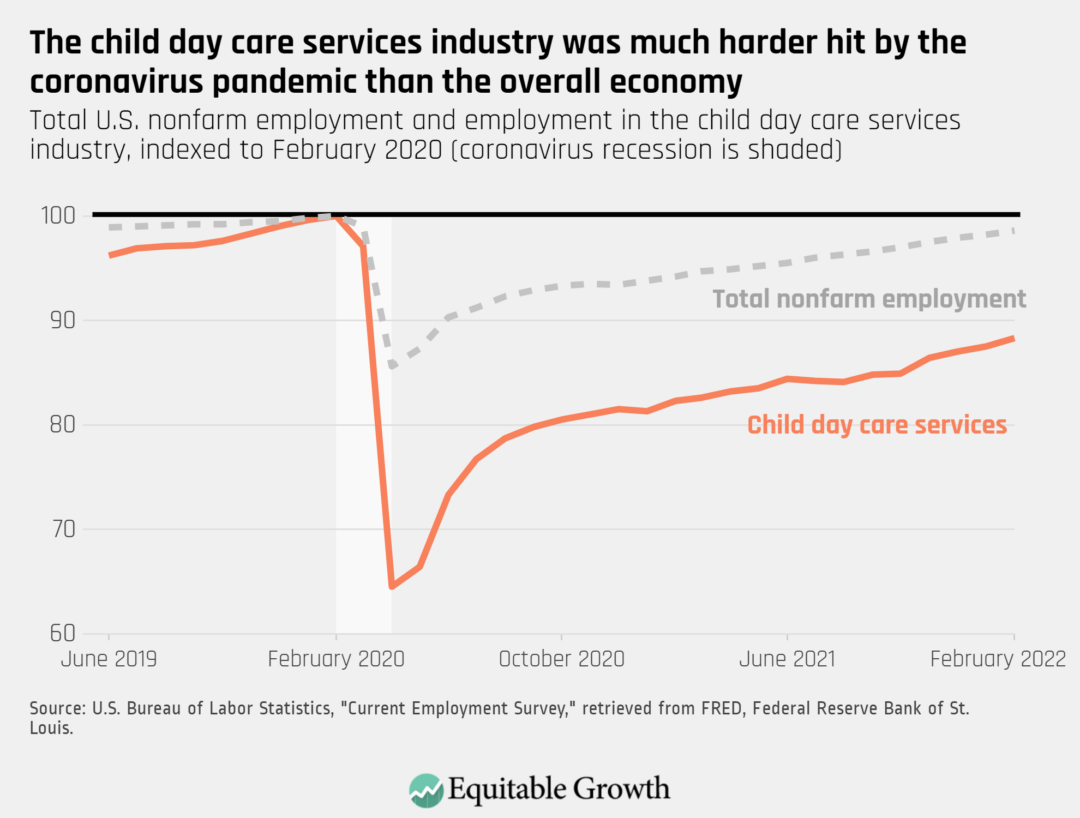
Indeed, there exists an overrepresentation of Black women in certain industries and occupations—often in care and service sectors— resulting from myriad factors, including the systemic devaluation of certain kinds of work, discrimination, and uneven occupational integration. In general, the overwhelming majority of domestic workers are women. More than half of domestic workers are Black, Latina, or Asian American and Pacific Islander women, with some studies finding that more than 90 percent of domestic workers are women of color.

Significant questions remain about how the jobs created by the Infrastructure Investments and Jobs Act will be equitably distributed and targeted, given significant levels of occupational segregation within the U.S. economy. It will therefore be imperative to improve pathways for people underrepresented in infrastructure jobs to be able to obtain these jobs, such as creating pathways for women to have construction jobs. Another way forward is by making investments in social infrastructure, such as the care economy, which remains key to overcoming the endemic economic divides across race, gender, and income.

Questions also remain regarding how investments are incorporated into transportation infrastructure more equitably. It’s not clear, for example, how these new investments in transportation infrastructure will affect equitable access to transportation and how increases or decreases in transportation equity will affect growth, since the economic consequences of inequitable transportation options are often borne by low-income people, who are disproportionately people of color. To better understand this question, we need better measurement.

With the significant investments in transportation, it will be important to ensure that inequities in transportation are addressed. These inequities include “transportation insecurity,” a term coined by Alix Gould-Werth of the Washington Center for Equitable Growth, Jamie Griffin of the University of Michigan, and Alexandra Murphy of the University of Michigan, which describes the condition of being unable to regularly move from place to place in a safe or timely manner because of a lack of resources necessary for transportation.

A diagnosis of problems surrounding transportation are only as good as the tools to measure it. In this vein, the U.S. Department of Transportation could adopt the Transportation Security Index, which was also created by the aforementioned scholars. The Transportation Security Index, which is modeled after the Food Security Index, is composed of items that ask respondents about symptoms of transportation insecurity, such as taking a long time to plan out everyday trips, feeling stuck at home, or worrying about burdening others with requests for assistance with transportation. As such, it is an important tool that can be used to determine whether people can get to where they need to go in a safe or timely manner and evaluate interventions that are designed to strengthen the U.S. economy by moving people from a state of transportation insecurity to one of security. 

Moreover, while the prioritization of union jobs in the Infrastructure Investment and Jobs Act is an important first step, there are still significant actions worth considering. Current challenges to unionization, such as rulings by the U.S. Supreme Court that have limited the ability of public-sector unions to collect dues, as well as made it more difficult for workers overall to band together and sue their employers for workplace misconduct, calls for new advocacy efforts for legislative remedies to enable more effective unionization.

One such example is the Clean Slate Agenda, which was developed by Sharon Block and Benjamin Sachs of Harvard Law School. They created a series of proposals for structural legal changes that would protect workers and give them the ability to countervail employers’ power. Their recommendations include:

  • Sectoral collective bargaining that enables unions to negotiate with industries rather than individual firms, increasing organized labor’s power to lift wages, set industrywide standards, and reach agreements that benefit a greater number of workers
  • Laws that expand and protect workers’ right to engage in collective action, including the creation of funds that allow workers to engage in strikes or walkouts without jeopardizing their financial security
  • An inclusive labor law reform that places the need to address gender, racial, and ethnic inequalities at its center by extending protections to domestic, incarcerated, and undocumented workers, as well as expanding rights and protections for independent contractors

Other proposals include the creation of labor market institutions, such as wage boards, which set minimum pay standards by industry and occupation and lead to wage gains for those at the bottom and middle of the income distribution. Enacting the PRO Act, which would make it easier for workers to organize into unions, would also curtail employers’ ability to misclassify workers as independent contractors, who do not have the right to unionize under federal U.S. law.

These measures would expand workers’ rights and allow unions to balance power in the labor market, ensuring that the economic gains they create are broadly shared.

Conclusion

The Infrastructure Investment and Jobs Act of 2021 is a major piece of legislation that rests on sound economic principles to help the U.S. economy reach its full potential. By placing greater focus on equity, unionization, and climate, the law and its swath of new investments are a step in the right direction. Yet to achieve strong, stable, and broadly shared growth, further investments and policies, such as those outlined above, are needed.

Michelle Holder is the president and CEO of the Washington center for Equitable Growth. Shaun Harrison is her research assistant.

Jobs report: U.S. employment data shows continuing strong job gains, with employment in the warehousing and transportation industry well-above pre-pandemic levels

""

The U.S. economy experienced another month of strong employment gains between mid-February and mid-March, adding 431,000 new jobs. According to the most recent Employment Situation Summary released this morning by the U.S. Bureau of Labor Statistics, the overall unemployment rate is now nearly at its pre-pandemic rate of 3.5 percent, falling from 3.8 percent in February to 3.6 percent in March. The share of 25- to 54-year-olds with a job—a statistic known as the “prime-age employment-to-population ratio”—climbed from 79.5 percent to 80 percent, and is now less than a percentage point below its February 2020 level.

These aggregate U.S. labor market statistics reveal that, by some measures, several groups of workers have now fully bounced back from the coronavirus recession in 2020 and are benefiting from a tight labor market. At 5.2 percent, the jobless rate for workers without a high school diploma is well-below its pre-pandemic rate. There also were more than 500,000 more men employed in March 2022 than in February 2020, at the start of the coronavirus-induced recession.  

But other workers have yet to recover. With employment still below its pre-pandemic levels, the jobs recovery has been slower for women in general and for Black women in particular. The unadjusted unemployment rate for American Indian and Alaskan Native workers is at 6.8 percent—a statistic we use here because the BLS does not currently publish this group of workers’ jobless rate on a seasonally adjusted basis—while the adjusted rate for Black workers is at 6.3 percent, putting the jobless rates of these groups at about 3.5 percentage points and 3 percentage points above the jobless rate of White workers. (See Figure 1.)

Figure 1

U.S. unemployment rate by race (not seasonally adjusted), 2019-2022. Coronavirus recession is shaded.

Transportation and warehousing is experiencing the biggest jump in employment

The latest month-over-month job gains were strongest in the leisure and hospitality industry, followed by professional and business services. Over the past two years, however, no sector registered a stronger percentage increase in employment than the transportation and warehousing industry.

While most other major industries continue to employ fewer workers than they did prior to the pandemic, on net the transportation and warehousing sector added more than 600,000 jobs between February 2020 and March 2022. Even though it was not immune to the coronavirus recession’s initial shock to employment, net losses in the sector were relatively small and the bounce-back relatively quick. Indeed, since February 2020 transportation and warehousing industry experienced a 10.5 percent increase in employment. (See Figure 2.)

Figure 2

Percent change in employment by major U.S. industries, February 2020 – March 2022

Within this industrial sector, big and somewhat persistent losses in subsectors such as sightseeing transportation and passenger transportation have been more than offset by massive gains for warehousing and storage as well as couriers and messengers. These two subsectors are now at record-high levels of employment. Overall, the transportation and warehousing industry has grown its share of employment over the past two years, going from representing 3.8 percent of the U.S. workforce in February 2020 to representing 4.2 percent in March 2022. (See Figure 3.) 

Figure 3

Percent change in employment by selected transportation and warehousing subsectors, February 2020 – March 2022

At least in part, the surge in warehousing and transportation jobs reflects an important pandemic-driven shift in spending. Many consumers stayed home during and after the coronavirus recession and spent more dollars buying goods online. The jump in e-commerce sales for goods such as furniture, electronics, and building materials, in turn, made demand for the services that store, process, ship, and deliver those orders skyrocket.

As a result, throughout the pandemic big employers such as Amazon.com Inc. and Walmart Inc. have hired hundreds of thousands of workers to staff warehouses and distribution centers. And parts of the industry that experienced important disruptions over the past two years, such as commercial airlines, are now expecting this upcoming summer to be the busiest one yet.

Many transportation and warehousing jobs remain poorly paid, unsafe, and precarious

The number of jobs added in the transportation and warehousing sector is a bright spot in the U.S. job market’s recovery, but the industry continues to experience longstanding job-quality concerns that have only become more urgent as pressures on the sector rise. Average pay in the industry—an industry in which men, Black workers, and Latino workers make up a disproportionately high share of the workforce—is currently at $27.79 an hour, almost $4 below the national average.

A 2020 report by Sam Abbott and Alix Gould-Werth at the Washington Center for Equitable Growth shows that in the case of warehouses, pressure to reduce costs and speed-up delivery time led managers to put in place staffing practices that both put a great strain on workers and are built around a business model that relies on irregular work and low-quality schedules.

Domestic outsourcing—a process by which firms subcontract certain roles so that workers are not direct employees—also increased warehouses’ reliance on temporary workers and third-party logistics companies to manage their workforces, further hurting workers’ earnings and opportunities to move up the career ladder. And invasive surveillance and monitoring mechanisms, such as productivity trackers and automated production quotas, led to high rates of workplace injuries and stress, as well as being associated with high turnover rates.

The coronavirus pandemic exacerbated these tough working conditions. Many warehouse workers faced even more pressure to meet productivity quotas and gained little support from employers in terms of access to paid sick leave and Personal Protective Equipment.

Or take trucking. Drivers often receive low pay, have little access to employer-provided benefits, and work long hours—many of which they are not compensated for. The trucking industry relies heavily on independent contractors, meaning that workers are excluded from many income support programs such as Unemployment Insurance, do not receive employer-provided benefits, and are paid on a per-load basis.  

In addition, these employment practices and bad working conditions have ripple effects that have contributed to recent supply chain woes. Steve Viscelli at the University of Pennsylvania argues, for instance, that independent contractor status for port drivers worsen supply-chain bottlenecks. Because drivers are paid by the load rather than by the hour, shipping companies bare no costs when using truckers’ time inefficiently, exacerbating delays when unloading cargo.

Job growth needs to be matched by better job quality for the economic recovery to be sustainable and equitable

As one of the fastest growing industries in the U.S. economy, ensuring economic security and good job-quality for warehousing and transportation workers is essential to achieve broad-based growth and supply-chain resilience. An important first step would be to rein back the misclassification of workers as independent contractors—a practice that is especially pervasive in parts of the industry such as trucking and ground delivery. This misclassification hurts the earnings and economic security of middle- and low-wage workers, and deprives workers of labor rights and protections they are entitled to by law.

Policymakers also need to update laws, regulations, and enforcement approaches to address the ways employers are using technology in these sectors, including workplace monitoring technologies and algorithmic management. One example is a new law that went into effect in California earlier this year requiring that employers’ warehouse production targets or quotas are transparent and don’t prevent workers from taking required breaks.

Yet without adequate enforcement resources, such laws rely on worker complaints for enforcement, which research shows may be least effective for most vulnerable workers. In building these resources, policymakers at both the federal level and in states and localities can support strategic and co-enforcement approaches to strengthen labor standards to protect low-wage workers in high-violation sectors such a transportation and warehousing.

Underlying all of these approaches to boost job quality is the necessity to both raise wage standards and provide institutional support for worker power. Many warehousing and transportation workers want to join or form a union because workers can improve their working conditions and have a say in practices that affect them and their families. This includes the types of policies that strengthen unions and workers’ ability to bargain as well as policies such as just cause job protections that help protect workers from being unfairly fired or retaliated against.

The American Rescue Plan helped U.S. families amid the coronavirus pandemic and provides a roadmap for policymakers today

""

When the coronavirus pandemic began to spread across the United States in March 2020 its impact was immediate and severe. The U.S. unemployment rate skyrocketed from a 50-year low of 3.5 percent in February 2020 to a post-Great Depression high of 14.7 percent in April of that same year. Over the same period, the U.S. labor market shrank by more than 20 million jobs. Industrial production plummeted. And the U.S. economy contracted by 3.4 percent in 2020—the worst economic downturn since 1946. 

In the two years that followed, the U.S. government enacted major pieces of legislation to respond to dual health and economic crises. Today marks the one year anniversary of  one of those measures, the American Rescue Plan, which provided $1.9 trillion in critical public health investments to fight COVID-19, support struggling families, and grant aid to states, localities, tribes, and territories.

This much-needed legislation helped to lay the groundwork for a robust recovery from the pandemic-induced recession. Specific investments included:

  • Nearly $100 billion to combat the public health crisis, including funding for vaccine development and distribution
  • More than $100 billion to expand and improve the Child Tax Credit and Earned Income Tax Credit, which bolstered family economic security for low- and middle-income families, reduced poverty for millions of children and improved the ability of their parents to invest in their children’s critical human capital development
  • Up to $1,400 for individuals in direct Economic Impact Payments, also known as stimulus checks, to cope with the continuing economic fallout from the pandemic
  • An extension of $300 per week supplemental Unemployment Insurance payments
  • An extension of voluntary employer tax credits for paid time off due to COVID-19
  • $350 billion in funding for state and local governments to save jobs and sustain aggregate demand in the face of budget shortfalls, which at that point left 1 in 20 state and local workers unemployed
  • $12 billion for nutritional assistance, including the Supplemental Nutrition Assistance Program, which research shows pays health and economic dividends far into the future for both direct recipients and the economy at large

As my colleagues Carmen Sanchez Cumming, Raksha Kopparam, and Maryam Janani-Flores detailed in their “economic state of the union” piece last week, the unprecedented speed and size of the American Rescue Plan and previous policy responses, such as the Coronavirus Aid, Relief, and Economic Security, or CARES Act, helped millions of workers and households withstand the economic pain brought on by the coronavirus pandemic.

The bounce back in Gross Domestic Product, for example, was much quicker in the United States than in most other high-income countries. The aggregate unemployment rate is now close to its pre-pandemic level. And workers in the bottom of the wage distribution have been experiencing real wage growth. Indeed, the recovery in overall employment has been extraordinarily quick compared to previous U.S. economic downturns. (See Figure 1.)

Figure 1

Percent loss in employment since the start of the recession

Elsewhere, Mike Konczal and Emily DiVito at the Roosevelt Institute, Elise Gould and Heidi Shierholz of the Economic Policy Institute, and staff at the Center on Budget and Policy Priorities have all highlighted the important ways in which the American Rescue Plan significantly improved the lives of working families and achieved an historic economic recovery. And yet, each of these analyses also remind us that we cannot stop here.

The continuing reverberations from the pandemic shed light on the systemic inequities embedded in the U.S. economy. These inequities include racial and ethnic disparities in access to income supports, big burdens on mothers and other caregivers, and vulnerability to health risks and worse working conditions on the job, particularly for employees in low-wage positions. 

Two years after the onset of the coronavirus recession, disparities remain stark, with many workers, families, and communities still hurting. Throughout the pandemic, Black women and Latinas have faced the greatest difficulties paying for their regular expenses. Additionally, the interaction between gender and racial wage divides—or what I’ve coined  “the double gap”—are enduring amid the pandemic, as data shows Black women earn less than White men within the same frontline essential occupations. Moreover, our current bout with inflation poses a serious threat to the economic recovery.

Fortunately, the American Rescue Plan strengthened the ability of U.S. families to cope with rising prices—a global problem now exacerbated by Vladimir Putin’s invasion of Ukraine—by improving the U.S. labor market and spurring faster economic growth than the rest of the world.
What’s more, the 2021 legislation helped reduce racial and gender disparities. Direct cash payments and the expanded Child Tax Credit, for example, reduced Black child poverty by more than 33 percent by some estimates. The American Rescue Plan provided $39 billion to help child care providers stay open and compensate early childhood educators.

Expanding and extending policies such as these will be paramount in addressing racial and gender inequities in our society going forward, and will help promote a stronger, more resilient U.S. economy. Even with the historic enactment of the American Rescue Plan and its largely successful implementation, there is an ongoing need to address the structural fragilities in our economy that make us so vulnerable to economic shocks in the first place.

Decisive government investments in our nation’s social infrastructure remain key to overcoming the endemic economic divides across race, gender, and income. With U.S. economic growth currently strong, now is the time to make these investments so that the ongoing recovery is not just strong but also more enduring because it is more equitable.

February Jobs Day report: U.S. employment growth is still strong, but some care sector workers are being left behind

""

The U.S. economy continued its streak of strong month-to-month employment gains, adding 678,000 jobs between mid-January and mid-February. According to data released this morning by the U.S. Bureau of Labor Statistics, the national unemployment rate continued to inch down toward its pre-coronavirus recession level of 3.5 percent, reaching 3.8 percent last month. The U.S. labor force participation rate, which has been one of the slowest-to-recover indicators throughout the crisis, made important gains over the past two months, jumping from 61.9 percent in December to 62.3 percent in February.

Across demographic groups, Black workers are currently experiencing a 6.6 percent unemployment rate, followed by Latino workers (4.4 percent), White workers (3.3 percent), and Asian American workers (3.1 percent). Overall, the workers of all these racial and ethnic groups experienced a decline in their unemployment rate last month. (See Figure 1.)

Figure 1

U.S. unemployment rate by race, 2019-2022. Recessions are shaded.

In addition, starting in February 2022 the BLS began publishing monthly unemployment data for American Indian and Alaska Native workers, showing that this group of workers is experiencing a higher jobless rate than any other major racial or ethnic group. While an important first step, experts Robert Maxim, Randall Akee, and Gabriel R. Sanchez at The Brookings Institution explain that shortcomings with the data highlight the need for policymakers and data collection agencies to continue working so that a more complete representation of how American Indian and Alaska Native workers are experiencing the labor market is visible and available in the monthly employment report. (See Figure 2.)

Figure 2

U.S. unemployment rate by race (not seasonally adjusted), 2019-2020. Coronavirus recession is shaded.

Women’s employment and labor force participation have yet to recover

The most recent BLS data released today highlights that women workers continue to face disproportionately harsh labor market outcomes. In the early days of the coronavirus pandemic, women’s employment dropped dramatically, due to care responsibilities, occupational segregation, and other factors. And these same challenges continue to hinder the jobs recovery. The agency’s Employment Situation Summary shows that Black, Latina, and White women workers have all seen a substantially slower bounce back in employment than their male counterparts. (See Figure 3.)

Figure 3

Percent change in U.S. employment for workers 20-years-old and over from February 2020 to January 2022, by race, gender, and ethnicity

Compounding the slower recovery in employment is that many women left the labor force altogether to take care of their family and communities. As of February 2022, women’s labor force participation rate was 1.3 percentage points below its pre-coronavirus recession level. Women are unlikely to fully reenter the economy without a robust care infrastructure.

Taken together, the ongoing pandemic and economic hardships remain especially hard on women—and particularly on Black women. This causes important ripple effects in several areas of the economy, including severe disruptions to sectors that provide care services. These sectors are closely tied to women’s economic security and labor market outcomes because they both employ high shares of women and provide the caregiving infrastructure that research shows is critical to supporting women’s labor force participation throughout the economy.

Critical care economy sectors continue to lose jobs, harming women’s employment options

Let’s take a closer look at the importance of the care economy to women’s labor force participation. Even though overall U.S. employment is recovering at a remarkably strong pace, sectors such as nursing care facilities not only have not recovered from the initial blow of the coronavirus pandemic, but also continue to shed jobs almost two years into the recovery. (See Figure 4.)

Figure 4

Total U.S. nonfarm employment and employment in nursing care facilities, indexed to February 2020 (coronavirus recession is shaded)

Other care sectors are recovering jobs, but experienced such massive employment losses at the onset of the coronavirus recession that they are still well below their pre-pandemic employment levels. The child day care services sector, for instance, saw a 35 percent decline in employment between February and April 2020 alone, and is still at a 12 percent jobs deficit (See Figure 5.)

Figure 5

Total U.S. nonfarm employment and employment in the child day care services industry, indexed to February 2020 (coronavirus recession is shaded)

Why are these care sectors struggling to join in the jobs recovery? At least part of the answer is that the coronavirus crisis made already-precarious jobs even more difficult and insecure. Nursing homes, for example, came under the spotlight early in the pandemic as many facilities became hotspots of coronavirus infections. Health risks in conjunction with stressful working conditions, extremely low pay, and lack of access to benefits for staff—a workforce predominantly made up of women workers—deepened an understaffing crisis that was already hurting the sector well before the onset of the pandemic. 

Indeed, care work is consistently undervalued. Views around paid and unpaid care work in the United States are informed by stereotypes around gender, race, and ethnicity. The poor job quality for care workers today is also part of a racist legacy of excluding domestic workers from labor protections under the National Labor Relations Act of 1935. Home care workers have only recently been included in the Fair Labor Standards Act’s federal minimum wage and overtime protections, and many domestic workers are still denied basic labor rights and protections.

Today, women account for 88.6 percent of home health care workers and 94 percent of child care workers, according to an analysis by the Economic Policy Institute, with women of color and immigrant women making up disproportionate shares of both workforces. Wages and job quality remain low, and benefits are scarce. EPI reports that home health care workers and child care workers are far less likely to have employer-sponsored health insurance or retirement coverage than the workforce as a whole.

As the labor market continues to bounce back (the country is currently 2.1 million jobs below its February 2020 employment level), it will be essential that care sectors of the economy add many more good-quality jobs. Research by Rachel Dwyer at The Ohio State University shows that while the number of care economy jobs grew at a faster pace than virtually any other job group in the three decades that followed the early 1980s, the undervaluing of these jobs was also a substantial contributor to the gendered and racialized job polarization of the overall U.S. economic structure. 

Invest in the care economy and its workforce for a more equitable recovery

As Equitable Growth highlighted in October, poor job quality in care-providing sectors has hindered employment growth and presented a clear risk to the country’s long-term economic trajectory. The lack of public investment in care sectors in the United States is a policy choice that leaves workers and families more vulnerable to economic shocks and slows the country’s broader recovery. As economists Sandra Black at Columbia University and Jesse Rothstein at the University of California, Berkeley explain, the lack of public investment in areas such as child care and long-term care insurance—despite clear market failures—shifts large costs and risks to families and exacerbates economic fragilities. 

These vulnerabilities cause ripple effects throughout the economy, contributing to a system that fails families, care workers, and society at large. For instance, as Equitable Growth Policy Analyst Sam Abbott writes, the child care market depends on parent fees, and therefore is “particularly exposed” to economic conditions in ways that make the child care market slower to recover than other parts of the economy. Yet, Abbott notes, public investment was a source of resiliency for care providers during the coronavirus pandemic and recession, as “child care programs that received public funding, rather than solely relying on parental fees, were better able to retain their enrollment and staff during the coronavirus recession.”

Care investments and improved job quality also have direct implications for public health during the pandemic, as Georgetown University’s Krista Ruffini described in a recent working paper. Ruffini finds that higher wages and better workplace conditions for nursing home staff can improve the safety and health of workers and residents, with a clear role for both raising the minimum wage and greater public investments to support staff wages.

Investing in the care economy and in job quality for low-wage workers can not only strengthen care access and support women’s labor force participation but also protect vulnerable workers during times of crisis and drive more equitable growth during periods of recovery. Research shows that raising labor standards, wages, and job quality for care providers and other workers, along with policies to support worker power and strengthen the country’s social infrastructure, is vital to improving economic security for workers and their families.

The Economic State of the Union in 2022, presented in 11 charts, and what policymakers can do to make the recovery more equitable and resilient

""

Today, President Joe Biden will give his State of the Union Address, approximately 1 year into his administration and 2 years after COVID-19 struck the United States.

The coronavirus recession was incredibly severe. As the pandemic hit, the U.S. unemployment rate skyrocketed from a 50-year low of 3.5 percent in February 2020 to a post-Great Depression high of 14.7 percent in April of that same year. Over those same two months, the country’s employment collapsed. The U.S. labor market shrank by more than 20 million jobs. Industrial production plummeted. And the U.S. economy contracted by 3.4 percent over 2020—the worst year for economic growth since 1946. 

The coronavirus recession officially ended in April 2020, but the federal policy response extended well into 2021 to ensure a robust economic recovery. By the end of 2021, real U.S. Gross Domestic Product growth hit 5.7 percent. Below are 11 charts that showcase the trajectory of our economy over the past 2 years and the important policy decisions that are still up ahead:

One of the most telling features of the coronavirus recession and continuing pandemic is that it hit already vulnerable groups especially hard. Both in the first year after the onset of the recession and in early 2022, lower-income households, Black and Latino households, and those with lower levels of formal education experienced especially large losses in employment income. (See Figure 1.)

Figure 1

Share of U.S. adults reporting that they or someone in their household lost employment income, by 2019 household income, race and ethnicity, and educational attainment

In response, the U.S. government enacted a series of measures shortly after the pandemic hit to mitigate the effects of the health and economic crises. Between March and April 2020, the U.S. Congress passed four major pieces of legislation, the most consequential being the Coronavirus Aid, Relief, and Economic Security Act. The CARES Act included provisions to expand eligibility and provide extra support through the Unemployment Insurance system, additional funding for food assistance through the Supplemental Nutrition Assistance Program, loans and guarantees for small businesses through the Paycheck Protection Program, and Economic Impact Payments.

The next year followed with the American Rescue Plan, signed into law in March 2021. It included an extension of many CARES Act programs as well as new initiatives such as the expansion of the Child Tax Credit. Provisions included in these bills began to expire in the first year of the pandemic and through 2021. (See Figure 2.)

Figure 21

Selected beginning and end dates of policies and events the first two years of the coronavirus pandemic

The unprecedented speed and size of the policy response helped millions of workers and households withstand the economic pain brought on by the coronavirus pandemic. The bounce back in Gross Domestic Product, for example, was much quicker in the United States than in most other high-income countries; the aggregate unemployment rate is now close to its pre-pandemic level; and workers in the bottom of the wage distribution are experiencing real wage growth.

Indeed, the recovery in overall employment has been extraordinarily quick compared to previous U.S. economic downturns. (See Figure 3.)

Figure 3

Percent loss in employment since the start of the recession

Yet the crisis shed light on the systemic inequities embedded in the country’s economy. These inequities include racial and ethnic disparities in access to income supports, big burdens on mothers and other caregivers, and vulnerability to health risks and worse conditions on the job, particularly for workers in low-wage positions. 

For instance, lower-income workers have been least likely to successfully apply and receive jobless benefits throughout the coronavirus crisis. Both in the coronavirus recession and the previous Great Recession of 2007­–2009 and its aftermath, Black workers were among the least likely to access Unemployment Insurance benefits. Though differences in application behavior play an important role in shaping these disparities, even conditional on application, regular Unemployment Insurance eligibility criteria systematically disadvantages workers with shorter job tenures, unpredictable or insufficient hours, and lower wages—workers who are also disproportionately workers of color. (See Figure 4.)

Figure 4

Share of U.S. adults who applied and either did or did not receive Unemployment Insurance benefits, by race, ethnicity, and 2019 household income

Two years after the onset of the coronavirus recession, disparities are stark and many workers, families, and communities are still hurting. Throughout the pandemic, Black and Latina women have faced the greatest difficulty paying for their regular expenses. Additionally, the interaction between gender and racial wage divides—or what Equitable Growth’s President and CEO Michelle Holder refers to as “the double gap”—have been exacerbated in the pandemic, as data shows Black women earn less than White men within the same frontline essential occupations. (See Figure 5.)

Figure 5

Share of respondents who found it “very difficult” to make regular expenses by race and gender, June 2020-January 2022

Moreover, many types of income supports were taken away prematurely, hurting many and especially those already disadvantaged. The result? Many workers, families, and communities are in serious danger of being left behind amid the current economic recovery. Data show that as households depleted their Economic Impact Payments, they began turning to credit card debt, loans, borrowing from friends or family, or selling off assets in order to meet regular expenses. (See Figure 6.)

Figure 6

Millions of households who reported using these seven sources to meet spending needs by week, June 2020-January 2022

Fast-forward to today. A wide-range of indicators reveal a nuanced story about the health of the U.S. economy. On one hand, coronavirus cases are now well-below their early January 2022 peak, those at the bottom of the earnings distribution are seeing real wage gains. And labor demand has skyrocketed, giving workers more power to negotiate higher pay and better working conditions. As such, job openings in the U.S. reached a record high of 11.1 million in July 2021—an almost 60 percent increase from February 2020—and have remained elevated since. The jump in open positions has been particularly stark in industries such as manufacturing and leisure and hospitality. (See Figure 7.)

Figure 7

Job openings by selected major U.S. industries, indexed to job openings in February 2020

At the same time, the U.S. economy is still at a 2.9 million jobs deficit compared to February 2020. Both the effect of the health crisis and the recovery in the U.S. labor market have been uneven. For instance, employment levels for Latino men and Black men have only just risen above their pre-coronavirus levels, and other groups still have not recovered. Black women have experienced some of the toughest labor market outcomes, seeing the largest drop in labor force participation and the slowest jobs recovery. As of January 2022, 262,000 fewer Black women were employed than in February 2020—a 2.6 percent drop. (See Figure 8.)

Figure 8

Percent change in U.S. employment for workers 20-years-old and over from February 2020 to January 2022, by race, gender, and ethnicity

In the midst of it all, inflation has risen. Supply chain breakdowns due to the pandemic are a major reason. Yet some large firms continue to collect record profits, claiming that they need to raise prices for consumers to account for increasing costs of production, transportation, and labor. Many economists disagree. An analysis of price and wage growth across more than 100 industries by the Economic Policy Institute, for instance, shows that industries that increased wages to attract workers, such as hotels and other accommodations, have not seen an unusually large spike in prices. (See Figure 9.)

Figure 9

Price inflation and wage growth across 110 industries, December 2020-November 2021

The notion that inflation warrants fiscal austerity is misplaced. Opposition to much needed government spending in social and physical infrastructure is holding back necessary reforms and investments. Under the weight of the coronavirus pandemic, the child care sector contracted dramatically, leaving parents scrambling to find the child care they need to return to work. Legislation such as the proposed Build Back Better Act would strengthen the labor market and allow parents to return to work knowing that their children are safe and well cared for. (See Figure 10.)

Figure 10

Share of adults not working by their reason for not working and income group, December 2021 – January 2022

Swift and decisive government action caused the coronavirus recession to be much less severe than it could have been. Still, many households, particularly those headed by Black, Latino, women, or low-income individuals, are still reeling from the pandemic’s impacts on the economy. The Build Back Better Act contains many social and physical infrastructure proposals that are backed by economic evidence. One study finds that the full bill’s passage would increase Gross Domestic Product. By not passing the Build Back Better Act, policymakers would lose out on an opportunity to make the investments that could make the country’s economy more resilient and equitable. (See Figure 11.)

Figure 11

Additional real GDP growth in billions of dollars with ARP and IIJA and with ARP, IIJA, and BBBA, 2020-2031

Conclusion

President Biden today is expected to reaffirm his commitment to enacting key parts of his Build Back Better plan. As these 11 charts demonstrate, decisive government investments in our nation’s social infrastructure remain key to overcoming endemic economic divides across race, gender, and income. With U.S. economic growth still strong, now is the time to make these investments so that the recovery is not just strong but also equitable and thus more enduring.

Getting cash transfer payments to recipients faster boosts household spending and stimulates the economy

""

Cash transfer programs are a widespread economic policy tool often used to stimulate spending or encourage savings among consumers. The United States most notably uses direct cash payments as part of its fiscal stimulus programs during economic downturns, such as during the Great Recession of 2007–2009. More recently, the federal government paid more than $850 billion directly to U.S. households during the coronavirus pandemic through three rounds of economic impact payments between March 2020 and March 2021.

Yet these programs that send money directly to households are relevant in other economic contexts aside from acute economic crisis. More than 130 countries around the world use direct cash payments as part of their social infrastructure and anti-poverty programs. Additionally, many developed economies are considering so-called universal basic income policies, which would send cash payments to households on a regular basis.

Whether the goal is to alleviate poverty or encourage consumer spending, our new working paper shows that the success of these programs depends on when households actually receive the funds. Using real-world data from two widely different cash transfer programs, we examine whether the timing of one-time cash transfer payments relative to when they are publicly announced has large impacts on household consumption behavior.

Our study demonstrates that household spending does not merely depend on the size of the transfer but also on the amount of time households anticipate receiving their payment. We find that in both developing and developed country settings, households scheduled to receive cash transfers earlier are more likely to spend and less likely to save, compared to those who receive cash transfers later.

Below, we explain the methodology behind our working paper and its findings, before detailing its implications for policy design.

The timing of cash transfers impacts household consumption and savings behavior

Standard economic theory says that households may respond to “unanticipated” payments by increasing their spending patterns, but should respond little, if at all, to the arrival of “anticipated” payments. This suggests that households spend more when they receive an unexpected cash transfer but do not necessarily increase their spending if the payment was previously publicly announced.

The effectiveness of widely publicized, previously announced fiscal stimulus payments, however, suggests that this story is incomplete. Studies show that households still increase their spending upon receiving a payment even if they know about it in advance. What effect, then, does the amount of time that households spend waiting for the cash to arrive have on their spending decisions?

Our working paper seeks to answer this question by comparing two cash transfer scenarios that played out in different economic contexts. We look at data from both the 2008 U.S. economic stimulus payments that were disbursed amid the financial crisis of 2007 and the ensuing Great Recession, as well as data on the distribution of one-time cash transfers in randomized controlled trials in Kenya and Malawi.

In the first scenario, the timing of federal government tax rebates sent to low- and middle-income households in the United States during the Great Recession was based on the last two digits of the recipient’s Social Security Number. Over a 3-month period starting in May 2008, checks were sent out to households, which also received written notice from the IRS several days prior to their payment dates. We utilize this to compare weekly spending habits across similarly situated households receiving transfers in different weeks. Specifically, we look at three groups who received checks in the first, second, and third weeks of May. (See Figure 1.)

Figure 1

U.S. households’ 4-week cumulative stimulus payment spending, by week in May 2008 in which payments were distributed

As Figure 1 shows, the spending response for households in each of the three groups receiving transfers differs across different weeks. Households randomly assigned—Social Security Numbers are effectively assigned at random—to receive payments at the earliest-possible date had double the spending increase over the 4 weeks after receiving their rebate, compared to the average household. In fact, we find that an additional 1 week of waiting for a transfer decreases the propensity to spend that transfer as much as would increasing the size of the transfer by $340. This suggests that the timing of payments plays an important role in their effectiveness at boosting spending.

We then examine the relevance of liquidity, or whether a household has at least 2 months of income available either in cash, a bank account, or otherwise accessible in case of an unexpected decline in income or increase in expenses. As seen in Figure 1, we find that these divergent spending habits by payment timing remain across households regardless of their liquidity status. While households that do have some available savings tend to spend less out of their stimulus payments and save more than those that do not have savings, the households with savings that received their payment at the earliest possible date spent about as much as households without savings that had to wait an extra 2 weeks to receive their payments.

Turning to the second scenario and context of our study, we analyze data from existing randomized controlled trials distributing one-time cash payments to households in Kenya and Malawi. These programs were not instituted as a response to economic crisis, as seen in the U.S. scenario, but rather as part of randomized controlled trials by researchers and nongovernmental organizations to understand the impact of cash transfers on households in poverty.

We find that the differential spending behavior by the timing of the transfer delivery seen in the U.S. context holds in these two other settings as well. In other words, we find that shorter waiting times between payment announcement and receipt led to increases in household spending rates, while those households that experienced delays in payments increased their total household savings rates.

Implications for designing cash transfer program policies

The results of our working paper have implications for designing cash transfer programs intended to boost consumer spending, as well as those that aim to alleviate poverty. Taken together, the data and our model suggest that a payment delay of even just 1 week can have a large impact on how much of that payment a household spends versus saves—an important distinction for policymakers, depending on their broader economic priorities.

Our study suggests, for instance, that households treat large, one-time payments, such as stimulus checks, differently from a smaller series of regular transfers. Researchers have argued that large payments tend to feel more like wealth and less like disposable income, so households may save more of a large lump-sum payment and spend more of a series of smaller payments. Yet in 2009 and 2010, when the United States implemented a series of small transfers to households with the Making Work Pay Tax Credit, these payments were only half as effective in stimulating U.S. household spending, compared to the one-time stimulus payments in 2008.

Our model addresses this tension by highlighting the crucial role of anticipation and timing. The unexpectedly diminished effectiveness for consumption of the smaller series of payments in 2009 and 2010 can be explained by the fact that households had more time to anticipate receiving those transfers, thus shifting their focus to saving rather than spending.

This implies that different household responses to both the size of a payment and how and when it is distributed must be taken into account when determining a policy’s effectiveness. Household spending behavior following one-time transfers, for instance, might not be an accurate indication of the efficacy of universal basic income policies—which tend to be smaller and delivered on a monthly basis rather than in one larger lump-sum—for reducing poverty.

Our findings also indicate that policymakers must consider their ultimate goals—boosting spending or building wealth—when designing the disbursement of cash transfers. If increasing consumption is the top priority, then cash payments should be rapidly sent out to households with little notice of their arrival. If longer-term investments and savings are the goal, however, then policymakers should consider providing more advance warning of the impending payments to households.

—Neil Thakral is an assistant professor of economics and international and public affairs at Brown University and the Watson Institute. Linh T. Tô is an assistant professor of economics at Boston University.

The economic evidence behind 10 policies in the Build Back Better Act

""

Overview

The U.S. House of Representatives late last week passed a key plank of President Joe Biden’s economic agenda, the Build Back Better Act. Coming on the heels of the president signing the Infrastructure Investment and Jobs Act on November 15, House passage of the other half of the president’s Build Back Better agenda signals momentum toward long overdue—and complementary—improvements in both the country’s physical and social infrastructure.

The Build Back Better Act enjoys privileged parliamentary status as a “budget reconciliation” bill, which means it can be passed by the U.S. Senate by a simple majority. It now moves across the Capitol, where it will likely be amended. But there is growing consensus in Congress on the core of the bill, which is designed to create jobs, cut costs, and grow the U.S. economy.

Misconceptions about inflation and debt have dominated the debate over the Build Back Better Act even though nearly all of the proposed spending is offset by provisions that would raise new government revenue. Most importantly, the $1.68 trillion of investments in the nation’s social and physical infrastructure would help expand the supply of labor and goods, and thus help ease cost pressures facing consumers, while contributing to sustained growth.

Indeed, the evidence detailed below demonstrates that, overall, the Build Back Better Act would deliver strong, stable, and broad-based economic growth up and down the income ladder and across the broader economy. (See Figure 1.)

Figure 1

Additional real GDP growth in billions of dollars with ARP and IIJA and with ARP, IIJA, and BBBA, 2020-2031

The Build Back Better Act includes 10 broad ways that would achieve these results. Specifically, the House-passed legislation would:

  • Establish a national paid family and medical leave program
  • Expand access to child care and establish a universal pre-Kindergarten program
  • Make the Child Tax Credit permanently refundable and extend its expansion
  • Extend the Earned Income Tax Credit expansion
  • Invest in home- and community-based services
  • Reduce costs of prescription drugs
  • Enhance labor law enforcement capabilities
  • Increase antitrust enforcement funding
  • Make investments to combat climate change
  • Improve tax enforcement and impose taxes on large corporations and high-income earners

Let’s now turn to each of these 10 consequential provisions in the bill and the economic evidence that underpins the reasoning for their anticipated success.

Establishes a national paid family and medical leave program

The Build Back Better Act authorizes a new national paid family and medical leave program of up to 4 weeks for U.S. workers. This paid leave program would allow individuals to take time to care for and bond with a new baby, care for a family member with a serious health issue, and care for themselves if struck by a personal health issue.

Today, many U.S. workers have to choose between caring for a loved one or bringing home a paycheck. Only 20 percent of private-sector workers access paid family leave through their employers, and new research finds that Black and Hispanic women have significantly less access to employer- or government-sponsored paid leave than White and Asian women.

Caregiving responsibilities are a significant driver of women’s exit from the U.S. labor force, as witnessed during the coronavirus pandemic, which disrupted more than half of family caregiving arrangements. Yet multiple studies find that access to paid leave increases the labor force participation rate of mothers, which we know is correlated with increased Gross Domestic Product. In one study, new mothers with paid leave are 18 percentage points more likely to be working a year after the birth of their child. (See Figure 2.)

Figure 2

Gross Domestic Product per capita, in U.S. Dollars, by women's labor force participation across select countries, 2017

Similarly, a synthesis of research finds that paid medical leave protects families during a health shock, ensuring financial stability even when things go wrong. Moreover, researchers have seen paid leave improve child well-being, strengthening the human capital of the next generation.

Expands access to child care and establishes a universal pre-Kindergarten program

The Build Back Better Act invests in children and supports caregivers by delivering a universal free pre-Kindergarten program for 3- and 4-year-olds and allocating an estimated $100 billion to expand accessible, affordable, and high-quality child care, including by providing higher wages for child care workers.

Currently, child care is inaccessible and unaffordable for many U.S. families. Roughly half of U.S. families live in “child care deserts,” and the average annual price for center-based care was more than $11,000 for infants and $9,000 for 4-year-olds in 2019. For communities of color, child care is in even shorter supply. Further, the 2020 median hourly salary for child care workers was $12.88—or $26,790 per year—leaving child care workers without economic security and destabilizing the child care industry overall.

Detailed in Equitable Growth’s child care report and factsheet, research shows that achieving affordable, accessible, high-quality care and early education has benefits for both parents and their children. Studies find that a 10 percent reduction in child care costs increases maternal employment between 0.5 percent to 2.5 percent, and for every additional 100 child care slots that open up, a 2007 study in Maryland finds that women’s labor force participation rate goes up by 0.3 percentage points. Similarly, evidence from a universal preschool program in Washington, DC shows that mothers of these children increased their labor force participation rate by 10 percentage points.

For children, high-quality early care and education can lead to long-term improvements in their human capital—better education, economic, developmental, and social outcomes—all of which is also good for the broader U.S. economy. In fact, research finds that President Biden’s proposed universal preschool program—similar to the one included in the Build Back Better Act—pays for itself within 10 years and generates $4.93 in economic return in 35 years for every dollar spent.

Makes the Child Tax Credit permanently refundable and extends its expansion

The legislation makes the Child Tax Credit permanently refundable, important for lower-income families, and extends the expansion of the Child Tax Credit of up to $3,600 enacted earlier in 2021 as part of the American Rescue Plan in advanced monthly payments.

According to two studies, the expanded Child Tax Credit is projected to reduce childhood poverty in the United States between 40 percent and 45 percent, with poverty rates falling particularly rapidly for Black and Hispanic children. Additional research shows that income support programs, such as the Child Tax Credit program, also allow families to make investments in their children’s human capital development, improving children’s chances of upward intergenerational mobility and increasing both their future earnings and corresponding tax revenue.

Extends the Earned Income Tax Credit expansion

The Build Back Better Act extends the expansion of the Earned Income Tax Credit in the American Rescue Plan for low-wage workers without qualifying children through 2022.

The Earned Income Tax Credit has historically been successful at encouraging work and lifting families out of poverty. Research shows that the Earned Income Tax Credit for single parents led to increases in employment rates and a reduction in poverty. In one study, an increase in the Earned Income Tax Credit of $1,000 increased employment for single mothers by 7.3 percentage points and decreased poverty for families by 9.4 percentage points. For a childless adult making poverty-level wages specifically, federal taxes would push them further into poverty, but expanding the Earned Income Tax Credit can offset that effect.   

Invests in home- and community-based services

The Build Back Better Act invests $150 billion in home- and community-based services that will allow more seniors and individuals with disabilities to receive services in their homes.

Seniors and individuals with disabilities have shown significant interest in and experienced benefits from home- and community-based services. In 2018, more than 800,000 Americans were on a Medicaid waiver waitlist to receive home- and community-based services, or approximately 45 percent of the total population receiving these services. Research also shows that seniors who transition from institutional care to home- and community-based services have a greater quality of life, including fewer unmet care needs.

The use of home- and community-based services, compared to institutional care, is good for the economy as well. One study finds that transitioning from nursing home facilities leads to an 18 percent to 24 percent decline in healthcare spending in a patient’s first year in home- and community-based care. Economists have also pointed out that investing in home- and community-based services will create jobs and boost growth.

Reduces costs of prescription drugs

The Build Back Better Act reduces out-of-pocket prescription costs by allowing Medicare to negotiate the price of prescription drugs that lack competition.

Evidence shows that rising drug prices—in which lack of competition plays an important role—impact national healthcare spending and harm access to medicines. Drug prices made up one-fifth of overall U.S. healthcare spending in 2020, or $476 billion in 2018—an increase of approximately $100 billion since 2014. What’s more, a 2019 study documents that 3 out of 10 Americans did not take a prescription drug as prescribed—such as by not filling a prescription or cutting pills—because of high costs.

Limited competition keeps prescription drug costs, and resulting national healthcare spending, high. One study finds that increased competition via generic drug entrants in the marketplace helped drop the price of drugs on average by 51 percent in the first year and 57 percent in the second year. Another study found that the U.S. healthcare system saved more than $1 trillion with the use of generic competitor drugs between 1999 and 2010.

Enhances labor law enforcement capabilities

The Build Back Better Act makes significant investments in the enforcement of labor laws. It provides more than $2 billion to rebuild agencies focused on worker protection, including the National Labor Relations Board, which protects the right of workers to organize into unions, and the Wage and Hour Division of the U.S. Department of Labor, which enforces labor laws, such as the federal minimum wage. The proposed law passed by the House also increases financial penalties for violations of wage theft and authorizes new financial penalties for unfair labor practices.

These investments would better protect the rights of workers and maintain a level playing field for compliant employers. Recent research shows that firms would be incentivized to abide by labor laws if there were a high chance of violations being detected. That’s why increasing the capacity of agencies to detect and respond to unfair labor practices, with the possibility of substantial monetary penalties, would likely change the calculation for employers and serve as an effective deterrent.

Increases antitrust enforcement funding

The Build Back Better Act provides $500 million each to the Federal Trade Commission and the U.S. Department of Justice’s Antitrust Division—the two federal antitrust enforcers—to support their work cracking down on unfair competition. This additional funding is a much-needed increase, as resource constraints over the past several years have limited these agencies’ ability to take enforcement actions against anticompetitive behavior. (See Figure 3.)

Figure 3

Percent change in antitrust funding and in merger filings, 2010-2019*

In an Equitable Growth co-authored report, we recommend an increase of $600 million in appropriations for the Federal Trade Commission and the U.S. Department of Justice’s Antitrust Division to implement a deterrence strategy to antitrust activities, including increasing investigations into problematic anticompetitive behavior and taking 60 to 100 enforcement actions a year rather than the current rate of roughly 40 enforcement actions per year.

Makes investments to combat climate change

The Build Back Better Act invests $555 billion to mitigate climate change, including promoting the shift to clean energy technologies and addressing the disproportionate harms that climate change brings to low-income communities and communities of color.

Tackling climate change is an essential investment in the U.S. economy. Extreme heat due to the effects of climate change leads to an increase in workplace injuries and is estimated to cost $525 million to $875 million in just California alone. Other research finds that students’ cognitive learning is hampered on hotter days, which can harm human capital formation important for broader economic growth. Research also finds that three times as many jobs are created for every $1 million invested in renewable energy or energy efficiency versus fossil fuels, and that these investments produce high returns over time.

Ensuring these investments are equitable in nature is particularly critical. Low- and middle-income communities and communities of color face a “double threat” of significant costs from climate-related hazards and fewer financial resources to pay for the costs associated with climate change mitigation measures. One example of how the proposed legislation would achieve this end is that it allows consumers to take advantage of the electric vehicle tax credit at the time of sale, so that low- and middle-income buyers do not have to be financially strained by the full cost of the vehicle until they can claim the tax credit at the end of the year.

Improves tax enforcement and imposes taxes on large corporations and high-income earners

The Build Back Better Act includes provisions that move the United States toward a more equitable tax system and aims to cover the costs of the bill, though the federal government has the capacity to deficit-finance these growth-enhancing investments. It invests $80 billion in the Internal Revenue Service so that it can combat tax evasion by high-income earners, adds a surtax to Americans making incomes higher than $10 million, establishes a new “minimum tax” on profitable U.S. corporations, and imposes a 15 percent country-by-country minimum tax on foreign profits consistent with the recent international agreement on a global minimum tax on multinational corporations.

Lower taxes on those at the top of the income ladder results in rising inequality, which has obstructed, subverted, and distorted the pathways to broadly shared growth. In contrast, research finds that higher top tax rates are correlated with higher economic growth for most Americans.

Further, strengthening the IRS’s capacity to audit high-income earners would help address the annual $700 billion in U.S. revenues lost to tax evasion. One study finds that the top 1 percent of income earners hide 20 percent of their income from tax collectors.  

Multinational corporations have also found ways to not pay taxes. Historically, the U.S. tax system has encouraged profit shifting by multinational corporations to tax havens in other countries, costing the United States more than $100 billion in revenues per year. With the Build Back Better Act, the global minimum tax of 15 percent on large multinational corporations’ profits earned overseas will begin to crack down on this tax evasion. (See Figure 4.)

Figure 4

Estimates of U.S. tax revenue losses due to income shifting by U.S. multinational corporations, in billions of U.S. dollars

In addition, the 15 percent global minimum tax on profitable corporations in general would help to counteract corporations’ relatively low effective tax rate—as low as 10 percent for some industries—especially as we know that the tax cuts in 2017 were economically wasteful.

Conclusion

Taken together, these policies make significant investments in U.S. workers and their families with the potential to have positive short- and long-term economic outcomes on individuals, households, and the broader U.S. economy. To be sure, the House missed out on opportunities to address certain structural issues in our economy, such as reforming our patchwork Unemployment Insurance system, taxing the unrealized capital gains of billionaires, and improving IRS tax reporting. And, certainly, there could be retrogressive changes to the proposed law in the Senate.

Nonetheless, these 10 policy provisions detailed above go a very long way toward addressing longstanding economic fragilities rooted in economic inequality and exacerbated across racial and gender lines. Should these broad policies become enacted into law, the evidence demonstrates they would deliver on the promise of structural economic change that would help U.S. workers and their families and the broader economy achieve strong, stable, and broad-based growth.

October U.S. Jobs report: Employment growth picked up steam last month

""

Job gains in the U.S. labor market picked up in October, according to the latest Employment Situation Summary released today by the U.S. Bureau of Labor Statistics. Between mid-September and mid-October a total of 531,000 jobs were added to U.S. economy as COVID-19 cases declined after surging in the late summer, compared with the 483,000 jobs added in August and the 312,000 jobs added in September. In addition, the agency made substantial revisions to its August and September employment estimates, increasing the 3-month average job gains to 442,000; without the revisions that average number would have been of just over 363,000 jobs.

A key measure for the labor market, the prime-age employment-to-population ratio, or the share of 25- to 54-year-olds who have a job, rose from 78 percent  to 78. 3 percent. And the overall unemployment rate continued to fall, dropping from 4.8 percent in September to 4.6 percent in October. These indicators show that the U.S. economy is on its way to a robust jobs recovery, yet some metrics used to measure the detailed health of the labor market failed to make much progress.

The labor force participation rate, for example, continues to be well below its pre-coronavirus levels. At 61.6 percent, the share of U.S. adults who are either employed or actively looking for work stayed flat over the last month and remained at roughly the same level since June of 2020.

As of October, there are 3million fewer workers in the labor force than there were prior to the start of the coronavirus recession in February 2020. A still low labor force participation rate is particularly worrying because this indicator previously never returned to its pre-crisis levels in the aftermath of either the 2001 recession or the Great Recession of 2007–2009. The only sector to shed jobs in October—the public sector—lost more than 150,000 jobs over the past three months.

Across race and ethnicity, the unemployment rate continues to be highest for Black workers—the racial or ethnic group whose unemployment rate tends to be most sensitive to both economic contractions and expansions. At 7.9 percent, the jobless rate for Black workers remained unchanged between September and October, and is almost double the unemployment rate of White workers (4 percent). The jobless rate for Asian American workers also remained flat, staying at 4.2 percent. Latinx workers are currently experiencing a 5.9 percent jobless rate—2.9 percentage points above the unemployment rate for White workers. (See Figure 1.)

Figure 1

U.S. unemployment rate by race, 2019-2021. Recessions are shaded.

There also are large differences in employment and labor force participation by age group. A year after the onset of the coronavirus recession, for example, the youngest workers in the U.S. economy were faring better than their older counterparts. Workers between the ages of 16 and 19 experienced employment declines of only 4.4 percent between February 2020 and February 2021.

Conversely, the pandemic initially hit the oldest workers much harder than early- and mid-career workers, and over the same period adults 65-years-old and older experienced a massive 10 percent decline in employment. For instance, according to an analysis of Bureau of Labor Statistics data by the Urban Institute, the labor force participation rate for U.S adults ages 65 and older fell 11.1 percent between February 2020 and February 2021—the largest 12-month drop in 60 years.

Alongside this drop in both employment and labor force participation, retirement rates increased dramatically amid the pandemic. According to a recent report from the Kansas City Federal Reserve, for example, the number of retirees increased by 3.6 million retirees between February 2020 and June 2021 or more than twice as many as would have been expected under previous trends.

The Kansas City Federal Reserve authors find that the overall increase is not driven by a greater number of retirements. Instead, they cite “a steep decline in the percentage of retirees returning to work” during this time, possibly due to health concerns for this higher-risk group during the pandemic. (See Figure 2.)

Figure 2

Monthly transition rates between retirement, employment, and U.S. unemployment, January 2018-June 2021

This shift may not reflect a permanent transition to retirement for all of these workers, however, as many may return to work as risks subside, particularly for those who are still young enough to return to the labor force. (See Figure 3.)

Figure 3

Increase in the number of U.S. retirees since February 2020 (in millions), by age

Many older workers face important challenges in the U.S. labor market and barriers to a good retirement

Retirement trends are likely to normalize as the U.S. economy continues to recover, yet this spike in the number of retirees has put a spotlight on the challenges that older workers experience in the labor market. Hiring discrimination, for example, may make it more difficult for older workers to find new jobs after separations during the pandemic.

Indeed, a working paper by Gordon Dahl at the University of California, San Diego, and Matthew Knepper at the University of Georgia suggests that age discrimination charges in hiring and firing rose in the period of higher unemployment after the Great Recession. Examining data from a correspondence study using fictitious resumes of college-educated women with significant work experience, the authors also find that the callback rate for older women versus younger women fell by 15 percent for every percentage point increase in the local unemployment rate.

Other research finds that age discrimination in hiring appears to be more prevalent against older women than older men, and older women may be subject to a disproportionate amount of monopsony power compared to other workers. Age discrimination intersects with discrimination by race as well, with one study finding disproportionate hiring discrimination among Black applicants in the oldest and youngest age groups. In addition, the Urban Institute also found that older adults who are able to find new jobs after being unemployed during the Great Recession and recovery received lower wages.

There also are large inequities in retirement readiness by gender and race, with many female workers and workers of color having no retirement savings other than Social Security. White families are far more likely to have access to an employer-sponsored retirement plan, and more likely to participate in one, according to a Federal Reserve analysis of the Survey of Consumer Finances. The analysis finds that while 60 percent of White families participate in a retirement plan, the same is true for only 45 percent of Black families and 34 percent of Hispanic families. White families typically have much higher levels of household wealth overall compared with Black and Hispanic families, as the analysis notes, further contributing to disparities in retirement readiness. 

Access to employer-sponsored retirement plans has fallen over time, and the types of plans workers participate in has shifted from defined-benefit plans, often called pensions, to 401(k) and other defined-savings accounts, which may not ensure adequate income in retirement. Overall, employer-sponsored retirement plan coverage declined less for workers in unions compared with other workers between 1999 and 2011, and workers in unions remain far more likely to participate in retirement plans than those who are not in unions, as the Economic Policy Institute notes.

Then there’s the need for older workers to be able to access to both good working conditions and a good retirement as the U.S. workforce ages. The pandemic pushed many U.S. workers into retirement, but longer trends reflect that both due to choice and necessity many older workers have been extending their careers over the past few decades. That many older workers are delaying or forgoing retirement could exacerbate other inequities, since older workers without a college degree are more likely to hold physically demanding jobs, and older workers with health problems are losing out on the financial benefits of a late retirement.

The trend toward later retirement can have other effects on the U.S. labor market, too. One is that it creates bottlenecks in career ladders that may affect the career progressions and wages for younger workers.

Conclusion

The latest Jobs report in October shows that more than 7.4 million workers who want a job and are actively looking for one did not have one, and the U.S. economy is still at a 4.2 million job deficit with respect to February 2020. These workers across the spectrum of age, gender, and race and ethnicity will return to the labor force most immediately when the pandemic is brought under more control so that those who want to return to work can do so without the fear of getting sick.

More broadly, as both the workforce and the population age, it will become increasingly important to invest in the country’s social infrastructure by ensuring that people can reach accessible and high-quality elder care, that the workers who care for the country’s older adults are fairly compensated and have good working conditions, and that the country’s families have access to robust Social Security benefits and disability benefits. It will also be important to effectively enforce labor laws that are meant to protect older adults from employment discrimination.

Empowering U.S. workers with the legal and institutional support they need to reach good labor market outcomes and be treated fairly at work—as well as to be able to have a good retirement if they choose to stop working or are unable to work—will be essential for broad-based and sustainable economic growth.

Dispatch from EconCon 2021: Addressing racial and gender stratification in the U.S. economy is key to an equitable and sustainable recovery

""

The 2-day EconCon 2021 conference, held virtually from October 6–7, featured speakers, panelists, and moderators from across the progressive policy and academic landscape. They were tasked by the co-hosts of the event, including the Washington Center for Equitable Growth, with examining “once-in-a-generation policy changes and transformative investments” to address U.S. economic inequality perpetuated most severely by the consequences of racial and gender stratification stretching back centuries and hobbling the U.S. economic recovery to this day.

The co-hosts put together an engaging schedule specifically to “underscore how fragile and unequal our economy has been, especially for communities of color, women, and other vulnerable people” in the wake of the coronavirus recession and the continuing pandemic in order to raise up policy solutions to “ensure an equitable, full recovery and a stronger, more sustainable economy for the future.” One central theme within this broad conference template that rose to the fore of the discussions were three words penned last summer by Janelle Jones—now the chief economist at the U.S. Department of Labor and previously a leader at Groundwork Collective, the leading co-sponsor of the EconCon 2021 event.

Those three words—“Black Women Best”—underpin Jones’ observation that when those who are last to recover from economic recessions—Black women—prosper equitably in the U.S. economy, then everyone will prosper in the process. These three words were repeated in multiple sessions and fireside chats over the course of the 2-day event.

One of the sessions, titled “Centering Black Women in our Economic Recovery to Ensure a Full Recovery for All,” zeroed in directly on this issue. The panel featured Taifa Smith Butler, Rebecca Dixon, and Michelle Holder—three Black women who are executive leaders of nonprofit organizations in the nation’s capital. Holder, the president and CEO of Equitable Growth, opened this session by fielding a question from moderator Anna Gifty Opoku-Agyeman, one of the co-founders of Sadie Collective: How are women of color experiencing the U.S. economy amid the pandemic?

Holder set the scene by noting that Black women on average earn the lowest wages and salaries yet can boast the highest rate of labor force participation in the country. She said this “conundrum” is the result of past racial and gender stratification, amplified over the centuries and exacerbated by the coronavirus recession and ongoing pandemic. The legacy of Black women’s enslavement, conditioned by their “exclusion from the cult of domesticity” embraced by White society for only White women in the post-Civil War era, especially in the Jim Crow South, still influences Black women’s employment and wealth-creating opportunities in the present.

“Black women kept working,” said Holder of the post-slavery era extending into today’s modern economy. “Black men were earning so little that Black women had to work to make ends meet,” she added. Similar conditions prevail today, where Black women, more often than White women, are either co-breadwinners or the primary breadwinners in their families.

Holder then juxtaposed Black women’s “strong attachment to the U.S. labor force” even when they earn the least in the U.S. economy, noting that they disproportionately hold the low-wage jobs that are now the most disrupted by the coronavirus pandemic. Given that a third of women who work in the United States are mothers, and that about 66 percent of Black children are raised in single-parent homes primarily by single moms—compared to about 25 percent of White children—disruptions to, or lack of, child care options raise particular challenges for Black working moms.

Holder’s co-panelist Rebecca Dixon at the National Employment Law Project added that Black women are held back in the U.S. economy because 90 percent of occupations are racially segregated due to the historical legacy of not just slavery but also sharecropping, property market redlining, and the agricultural and domestic work they did that was excluded—and still is excluded among some care professions—from Social Security. This occupational segregation, Dixon said, “is a perfect Venn diagram of discrimination past and present.”

Holder put a number on the cost of this gender and racial wage divide, which she terms the “double gap”: $50 billion a year in involuntarily forfeited earnings by Black women. This $50 billion (measured in 2017 dollars) probably accrued to a mix of corporate shareholders and executives, and to some extent to White workers, she said, though the breakdown isn’t clear. But the result is that Black women earn 60 cents on the dollar of what White men earn in the U.S. economy today.

Dixon then pointed out that the joint federal-state Unemployment Insurance program adds economic insult to discriminatory injury because Southern state UI programs were “in tatters” even before the pandemic; the majority of Black Americans currently live in the U.S. South.

Taifa Smith Butler of Demos then fielded a question from the Sadie Collective’s Opoku-Agyeman on policy solutions for this “double gap.” Smith Butler said that U.S. policymakers need to “reimagine economic democracy to give Black women the agency to make their own decisions without systems of oppression in place.” Black women, she said, need to get off the “hamster wheel creating wealth for other people.”

Holder then suggested a way to measure the economic well-being of Black women in the United States, harkening back to Janelle Jones’ “Black Women Best.” Holder said U.S. policymakers need to pay close attention to race and gender data on Black female employment and implement measures that move the country in the direction of more wage transparency in workplaces. Smith Butler added that disaggregation of employment and earnings data along race and gender lines must also be broken out by region.

An important session on the second day of the conference added critical details to the need for economic data disaggregation by race, ethnicity, and gender in all its forms. The session, titled “Defining Success: Reimagining Data Measurement,” was moderated by Equitable Growth Director of Economic Measurement Policy Austin Clemens, with panelists Algernon Austin of the Center for Economic and Policy Research and Tracey Ross of PolicyLink. Austin set the table with three figures showing the inequitable economic recovery from the Great Recession of 2007­–2009. (See Figure 1.)

Figure 1

""
""
""

The three slides show various dimensions of the slow recovery from the Great Recession to put the coronavirus recession of 2020 and its aftermath in focus amid today’s uneven economic recovery and continuing pandemic. Clemens and the two panelists then dove into a discussion of the indicators of racial stratification that are essential to discern in U.S. economic data, so that policy solutions can be identified to create strong, broad-based economic growth across the country. They all noted that there can be no understanding of persistent and rising economic inequality without acknowledging racial, ethnic, and gender inequality.

PolicyLink’s Ross said that policymakers, economists, and the press alike “need to reframe what it means to recover” from the coronavirus recession, so that “it’s not just back normal, which was not good enough for too many people.” Recovery, she said, needs to be about “fixing the broken economy, focusing on Black unemployment as one metric, on rural healthcare as another, and other indicators that show that the U.S. economy and society are stronger than they were before going into the crisis.”

The Center for Economic and Policy Research’s Austin noted that policymakers can’t improve what isn’t measured, and what is measured and reported on by the press doesn’t “reflect the lived experiences of average Americans.” He says that federal economic statistical agencies need to move away from average measures and adopt disaggregated ones that will capture more telling trends in Black workers’ employment rates. “Recovery is not the goal post, as that was a society with deep inequalities,” he said. “The Black unemployment rate goes from high, to really high, to high. It never goes to low.”

Clemens, Ross, and Austin discussed other key measures to capture the extent of racial stratification in the U.S. economy and then measure the results of new policy solutions in the subsequent data. They suggested a variety of new metrics, among them housing affordability disaggregated by race and income and by home rental and purchase prices, as well as a breakout of employment by wage category to see when low-wage jobs are recovering, compared to the already-recovering high-income and middle-income jobs. Then, there is the simple measure of paid sick leave. “Everyone is better off if everyone can get paid sick leave,” said Austin.

The panel ended with a discussion on regional economic inequality and its intersection with the baleful consequences of climate change on communities of color in particular. Clemens noted that the federal statistical agencies don’t always have the statistical power to monitor poverty and other economic outcomes in small geographic areas. And Austin pointed to racist and historically anti-Black policies in Mississippi that cascade across high levels of poverty and inequality, and are then exacerbated by poor infrastructure investment in mitigating climate change, which is causing more heat- and asthma-related health problems and more flooding that disproportionately harms Black Mississippians.

All in all, the 2 days of discussion and generation of policy ideas underscored the need for policymakers and economists alike to embrace new measures of economic inequality to understand how structural racism manifests in policies and institutions, and how this deep racial stratification in the U.S. economy and society can be reversed to create a stronger and more sustainable economic recovery for everyone.

As Tracy Williams of the Omidyar Network (another co-host of the event) said when opening one of the first sessions of the conference, “a key part of reimagining capitalism is to center Black women inside an equitable economy.” EconCon 2021 went a long way toward making the case that a smart way to define that success is to understand and measure how Black women are experiencing economic prosperity.

Problems in the U.S. care sectors risk holding back the economic recovery amid another month of disappointing job gains

""

According to the latest Employment Situation Summary by the U.S. Bureau of Labor Statistics, the economy added 194,000 jobs in September—well below expectations and substantially less than the average 806,000 job gained over the previous three months. As the delta variant of the coronavirus sent ripples through the labor market, the prime-age employment-to-population ratio, or the share of 25- to 54-year-olds who have a job, remained flat at 78 percent between mid-August and mid-September. While the overall unemployment rate fell from 5.2 percent to 4.8 percent, some of the reduction in joblessness was the consequence of workers leaving the labor force.

Today’s Jobs report continues to show that the recovery in employment remains uneven. Across the lines of race, ethnicity, and gender, employment is most depressed for women of color. In September 524,000 fewer Black women were employed than in February 2020, a decline of 5.2 percent. Latina women—who did not see any net increases in employment last month and face the second-deepest job losses—are experiencing a drop of 4.7  percent. (See Figure 1).

Figure 1

Percent change in U.S. employment for workers 20-years-old and over relative to February 2020, by race, gender, and ethnicity

The still chilling effect of the delta variant was evident in overall job growth. The education and health care industry, for example, shed 7,000 jobs and the “other services” industry that includes sectors such as personal care services shed 16,000 jobs. Even though in September the leisure and hospitality sector added 74,000 jobs—more than any other industry—these gains still fell short of the massive number of jobs added during the summer.

Another factor holding back stronger employment gains is the slow recovery in some parts of the paid care economy. This sector provides health, education, and social services to workers, families, and communities.

Indeed, last month nursing care facilities, residential mental health facilities, and community care centers for the elderly all saw their workforce shrink. These data reflect reports that care providers such as child care centers and nursing homes are struggling to hire and retain workers after millions of workers in the health care and social assistance industry were laid off between March and April of last year during the depths of the coronavirus recession. While some care sectors such as home health services have recovered at roughly the same pace as the overall U.S. labor market, others are lagging behind. As of September employment at nursing care facilities and community care centers for the elderly remained 15 percent and 11 percent below February 2020 levels. (See Figure 2).

Figure 2

Percent change in employment by selected education and health services industries, February 2020-September 2021

One likely reason for the slow recovery in these care sectors is that the coronavirus pandemic made already challenging and often bad-quality jobs even more difficult. Compensated caregivers in general—among them home health aides, child care workers, and nursing home staff—tend to be poorly paid and are likely to experience precarious working conditions. In 2020, for example, the median wage for childcare workers was just $12.24 per hour and for home health and personal care aides just $13.02 per hour.

In addition, these workers often do not have access to employer-provided benefits and are often subject to particularly invasive forms of worker surveillance. And as the pandemic hit early last year, many of the workers who were not laid off were highly exposed to the coronavirus at work and often received little support from their employers in terms of provision of basic protective equipment such as masks. According to one analysis, nursing home workers held one of the deadliest jobs last year as they provided care in understaffed and underfunded facilities while also lacking access to paid sick leave and earning insufficient wages.

Because women in general and women of color in particular are overrepresented in care occupations, that care work is undervalued and thus is both a driver and a reflection of racial and gender economic inequality.

Bad-quality jobs in the care economy hurt workers, those who are in need of care, and the entire economy

There are broad implications of so many bad-quality care positions. Poor working conditions and low pay translate into high turnover rates among care workers—turnover that is expensive for employers and bad for clients and patients. Nursing home staff turnover was already extremely high before the pandemic, with an average annual turnover rate of 128 percent, and high turnover has been found to be associated with citations for poor infection controls.

This incomplete recovery in care-providing sectors also is a drag on employment growth and long-term economic growth. According to the U.S. Census’ Household Pulse Survey, more than 11 million adults are not working because they are caring for someone sick with coronavirus symptoms, caring for an elderly person, or caring for children who are not in school or daycare.

Then there’s the recent survey by the Urban Institute. It finds that in late 2020, about 20 percent of adults living with children under the age of 6 had to work fewer hours because of greater care responsibilities. More broadly, research finds that when parents in general and mothers in particular do not have access to affordable and high-quality child care, they are also less likely to be in the workforce.

Partly because of the country’s aging population and the labor-intensive nature of most of this kind of work, the U.S. Bureau of Labor Statistics projects that between 2020 and 2030, demand for home health and personal care workers will grow 33 percent—27 percentage points more than the average growth rate for all occupations. Also due to greater demand, five of the 10 fastest growing jobs are in care occupations. This means that the quality of jobs in the paid care economy will affect a growing number of U.S. workers in the years to come, making it increasingly important to act now to ensure that these are well-paying, good-quality jobs.

Investments in the U.S. care infrastructure are essential for a complete recovery and broadly-shared growth

The most direct route to start to counter the undervaluing of paid care workers is to raise pay through policies such as raising the federal minimum wage. Research by Krista Ruffini at the University of California, Berkeley, finds that because direct-care staff at nursing homes are some of the worst-paid workers in the United States, higher minimum wage floors lead to better labor market outcomes for those who do the job, reduce employee turnover, and improve patient care. Other measures that promote job quality, such as access to predictable schedules and safe working conditions, also are essential.

Because the U.S. labor market continues to be short 5 million jobs compared to the abrupt end of the previous economic expansion in February 2020, investments in U.S. care infrastructure will be essential for reaching a complete and resilient recovery.

Insufficient investment in accessible and high-quality child care and home- and community-based services have long held back progress toward a more dynamic and equitable economy—one in which paid caregivers are fairly compensated and those who currently cannot do paid work because they have caregiving responsibilities are able to enter the workforce if they choose to.