The economic benefits of equal opportunity in the United States by ending racial, ethnic, and gender disparities

Racial, ethnic, and gender disparities across the U.S. economy are a personal tragedy for the millions of individuals who suffer from the emotional, psychological, and social consequences. These disparities also are an economic calamity for communities of color, for women, and indeed for all U.S. workers, their families, and their communities, resulting in a United States that is far off from its promise of equal opportunity for all.
In this issue brief, the economic costs of racial, ethnic, and gender inequities are quantified and illuminated by providing estimates of the economic benefits of eliminating them. This analysis imagines an America free of racial, ethnic, and gender disparities, where one’s skin color, ethnic origin, or gender are no obstacle to worker productivity, labor force participation, and advancement—in short, a United States of America where everyone has the same opportunity to achieve their potential.
Specifically, this analysis examines the benefits that would have been realized in 2019 of closing these racial, ethnic, and gender divides by estimating the resulting:
- Increases in the average total earnings of women and Black, Hispanic, and Asian workers
- Growth in Gross Domestic Product
- Rises in tax revenues
- Reductions in poverty
- Improvements in the solvency of Social Security
To achieve an equal-opportunity society where there are no barriers to economic success that are the consequence of race, ethnicity, or gender disparities would obviously require tackling overt racism and sexism.
But true equal opportunity requires more than that. It involves addressing many other disparities that undermine worker productivity, such as unequal access to jobs, education, credit in the form of home mortgages and business loans, affordable child care, high-quality pre-Kindergarten, and senior care; inconsistencies in family leave and workplace policies and in treatment in the justice system; imbalances in access to healthcare and insurance; unequal exposure to damaging levels of environmental pollutants; and inadequate and unequal access to high-quality physical infrastructure, which is essential to maximizing economic efficiency.
All of these disparities, and more, impose greater burdens on women and racial and ethnic workers and their families and communities. And all of these and other inequities undermine the productivity of women and people of color, contribute to inequalities in the distribution of income and wealth, and weaken the national economy.
This study clarifies the significant economic costs of failure to address these inequalities and of not creating equal opportunity. The specific findings are detailed below, but overall, if equal opportunity were the reality, then in 2019:
- Total average earnings of all workers would have been 33.5 percent, or $18,134, higher ($72,263 versus $54,129).
- Collectively, Black, Hispanic, and Asian workers would have earned 60.6 percent more ($71,472 versus $44,495).
- U.S. Gross Domestic Product would have been $7.2 trillion higher and totaled $28.6 trillion instead of $21.4 trillion.
- Federal, state, and local tax revenues would have been $1.82 trillion higher.
- The overall U.S. poverty rate would have dropped from 10.5 percent to 6.6 percent, lifting 12.2 million people out of poverty.
- There would have been a $429 billion improvement in the finances of the U.S. Social Security system.
Although the economic benefits of leveling the playing field identified in this study accrue disproportionately to women and people of color, many policies to achieve equal opportunity would benefit non-Hispanic White males as well. Improvements to the solvency of Social Security, for example, would benefit all people, and enhancements to physical infrastructure would increase the productivity and earnings of all workers.
Yet the magnitudes of these benefits to non-Hispanic White males are not assessed in this analysis. As such, the economic benefits identified are an underestimate of the total economic benefits. Despite the underestimate, these findings demonstrate that enacting economic and social policies that create a more equal-opportunity United States would deliver enormous benefits to all workers, not just to women and people of color, and would support more equitable and sustainable economic growth for decades to come.
U.S. earnings
If equal opportunity prevailed in the United States in 2019, then the average total money income—a reflection of the nation’s prosperity—would have been significantly greater, and racial, ethnic, and gender earnings differences would have largely disappeared. The average total money income of all workers would have been 33.5 percent, or $18,134, higher: $72,263 versus $54,129.
The breakdown by race, ethnicity, and gender is also telling. The average earnings of non-Hispanic White workers would have been 22.8 percent higher ($72,897 versus $59,376) because of the significant increase in the earnings of White women. Black workers would have earned 73.7 percent more ($71,611 versus $41,222). Hispanic workers would have earned 83.4 percent more ($70,578 versus $38,485). And Asian workers would have earned 10.2 percent more ($73,502 versus $66,679). (See Figure 1.)
Figure 1
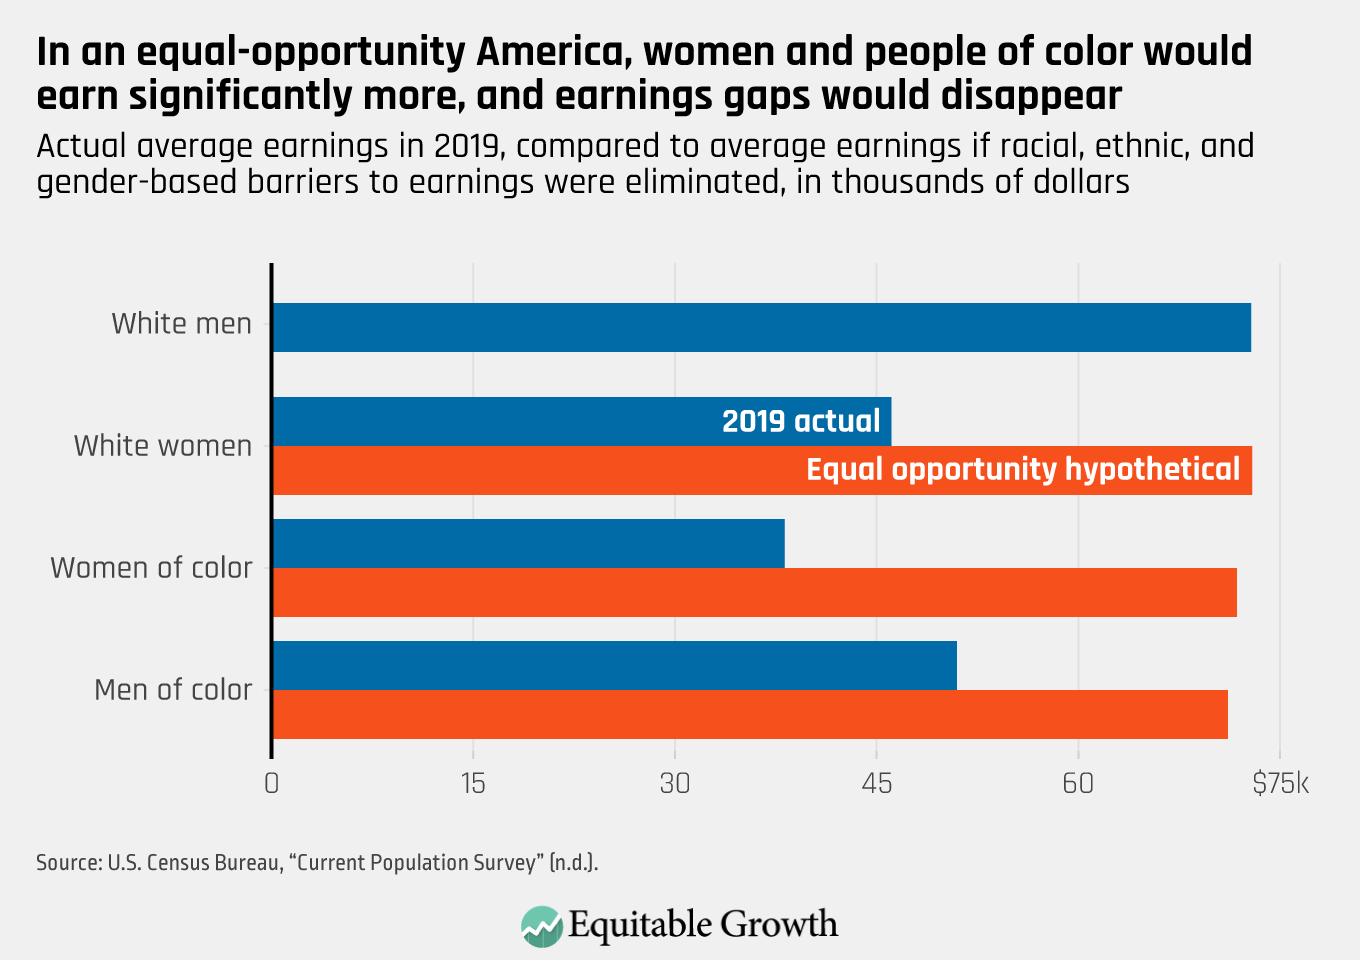
Collectively, Black, Hispanic, and Asian workers would have earned 60.6 percent more ($71,472 versus $44,495), but the gains would have accrued especially to women of color. In particular, men of color would have earned 39.6 percent more ($71,122 versus $50,962), while women of color would have earned 88.2 percent more ($71,805 versus $38,150). Non-Hispanic White women would also have experienced large gains: Their earning would have been 58.2 percent higher, with average total money income of $72,929 instead of $46,100. The earnings of all these groups of workers would have closely matched the $72,863 in earnings of non-Hispanic White male workers, and earnings gaps would have largely disappeared.
The increase in earnings across all workers in the United States in 2019 would have totaled $4.3 trillion. Total money income would have risen from $12.7 trillion to $17 trillion in 2019. Put simply, earnings would have risen substantially if equal opportunity were the defining feature of the U.S. economy and society, with far more equitable earnings for women and workers of color.
U.S. Gross Domestic Product and tax revenues
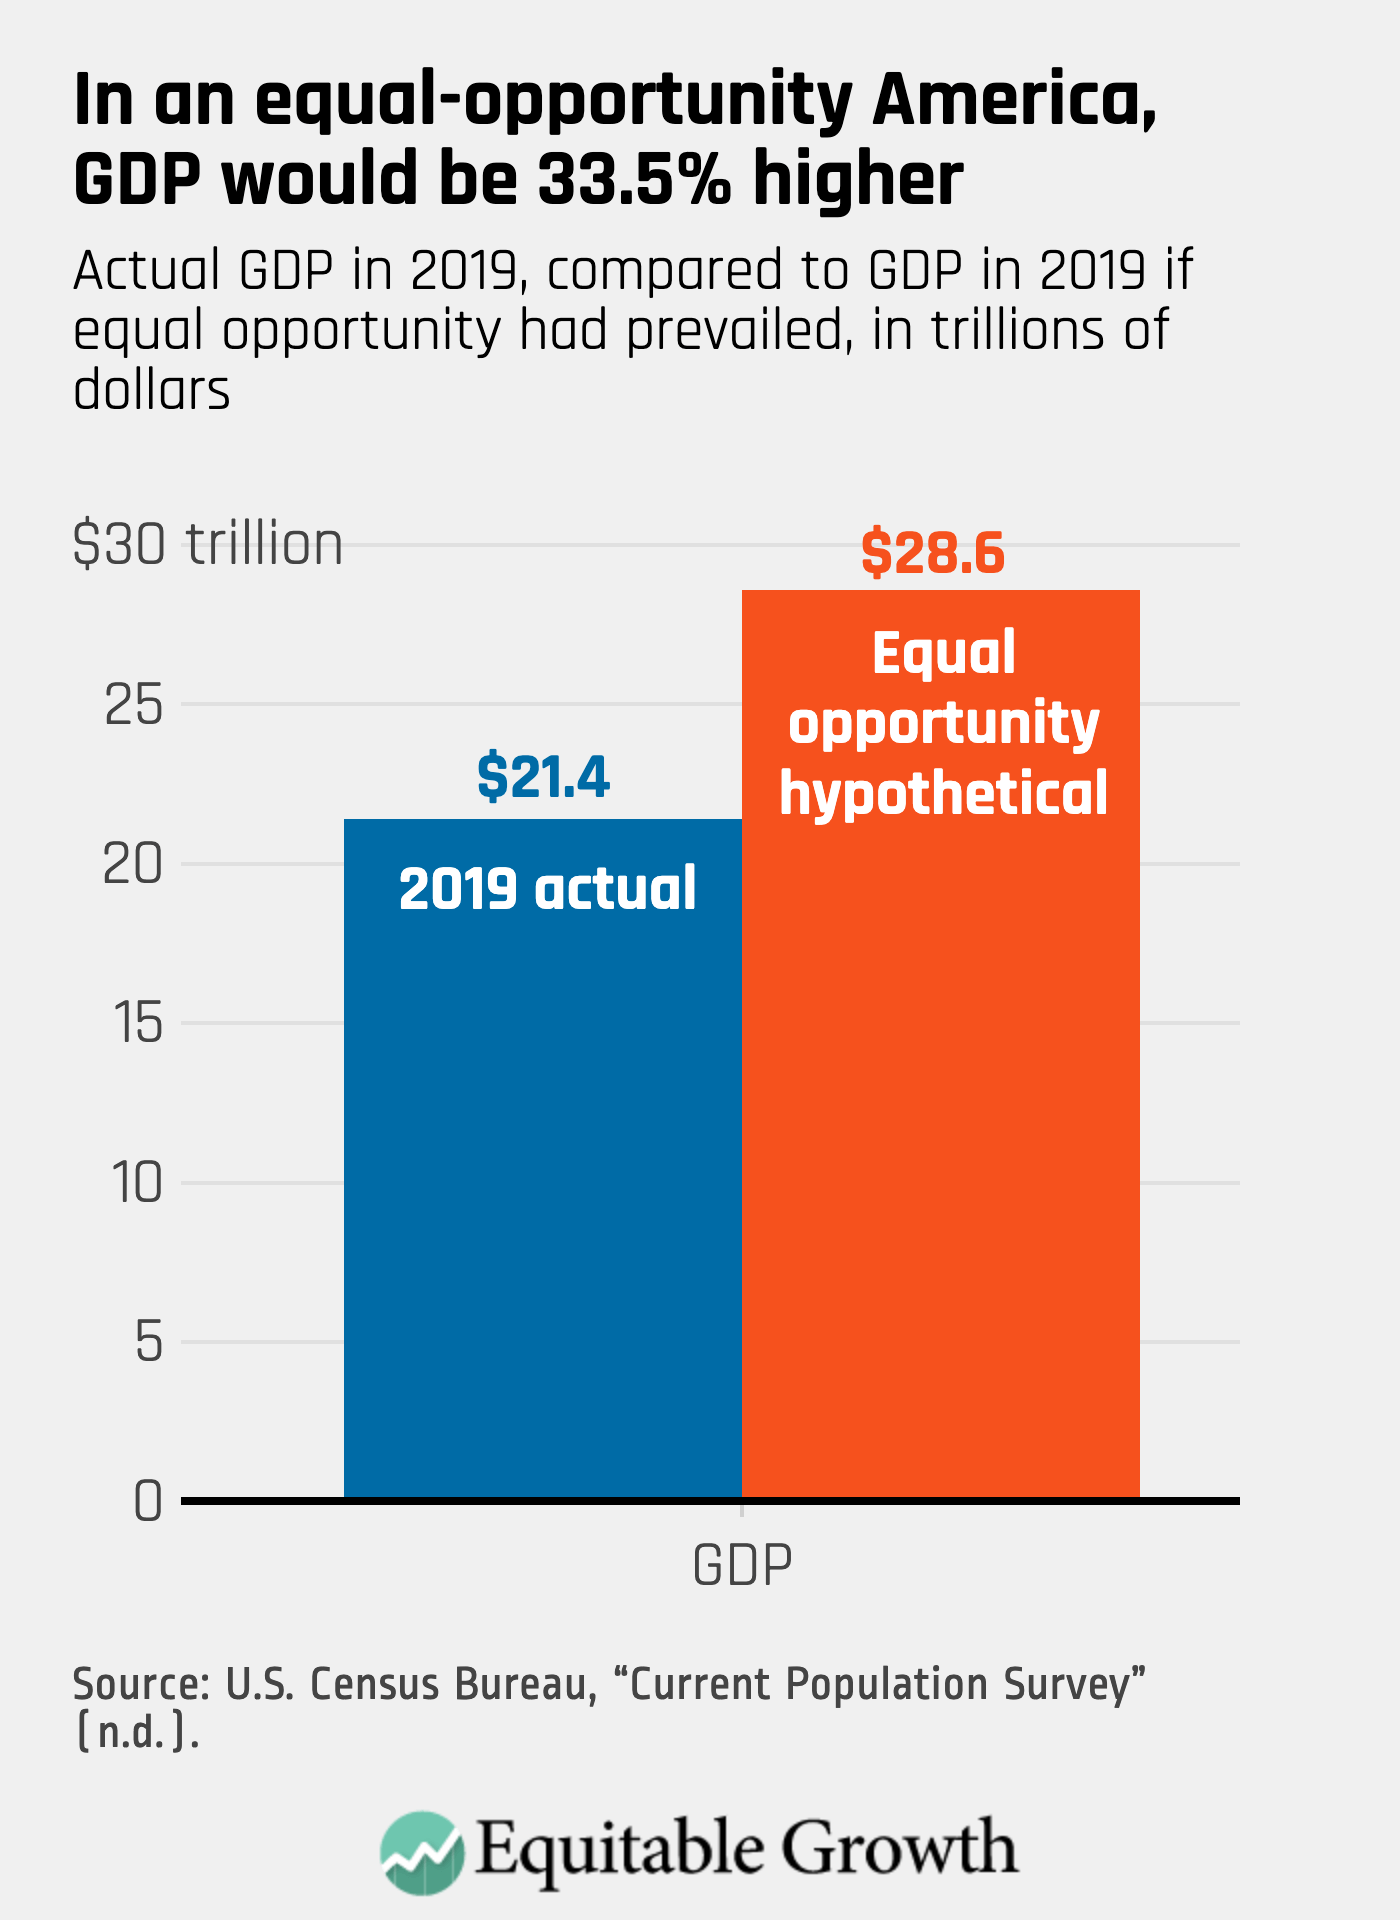
If equal opportunity prevailed in the United States in 2019, then U.S. Gross Domestic Product—the most commonly used measure of the size of the economy—would have been $7.2 trillion higher and totaled $28.6 trillion instead of $21.4 trillion. (See Figure 2.) To get a sense of the magnitude of this $7.2 trillion increase, consider that at the actual 2.2 percent rate of real (inflation-adjusted) growth that the U.S. economy experienced in 2019, it would take more than 13 additional years to reach a GDP of $28.6 trillion.
Figure 2
The larger GDP would have generated a considerable increase in annual tax revenues in 2019. The elimination of racial, ethnic, and gender disparities would have increased federal, state, and local tax revenues by $1.82 trillion in 2019—$1.184 trillion for the federal government and $636 billion for state and local governments.1
The positive impact on government budgets would have been even greater than these tax revenue increases if reductions in means-tested public services and spending were taken into account. With the higher estimated earnings, many fewer people would have needed federal, state, and local food aid, housing assistance, cash assistance, and other support services.
U.S. poverty rates and number of poor people
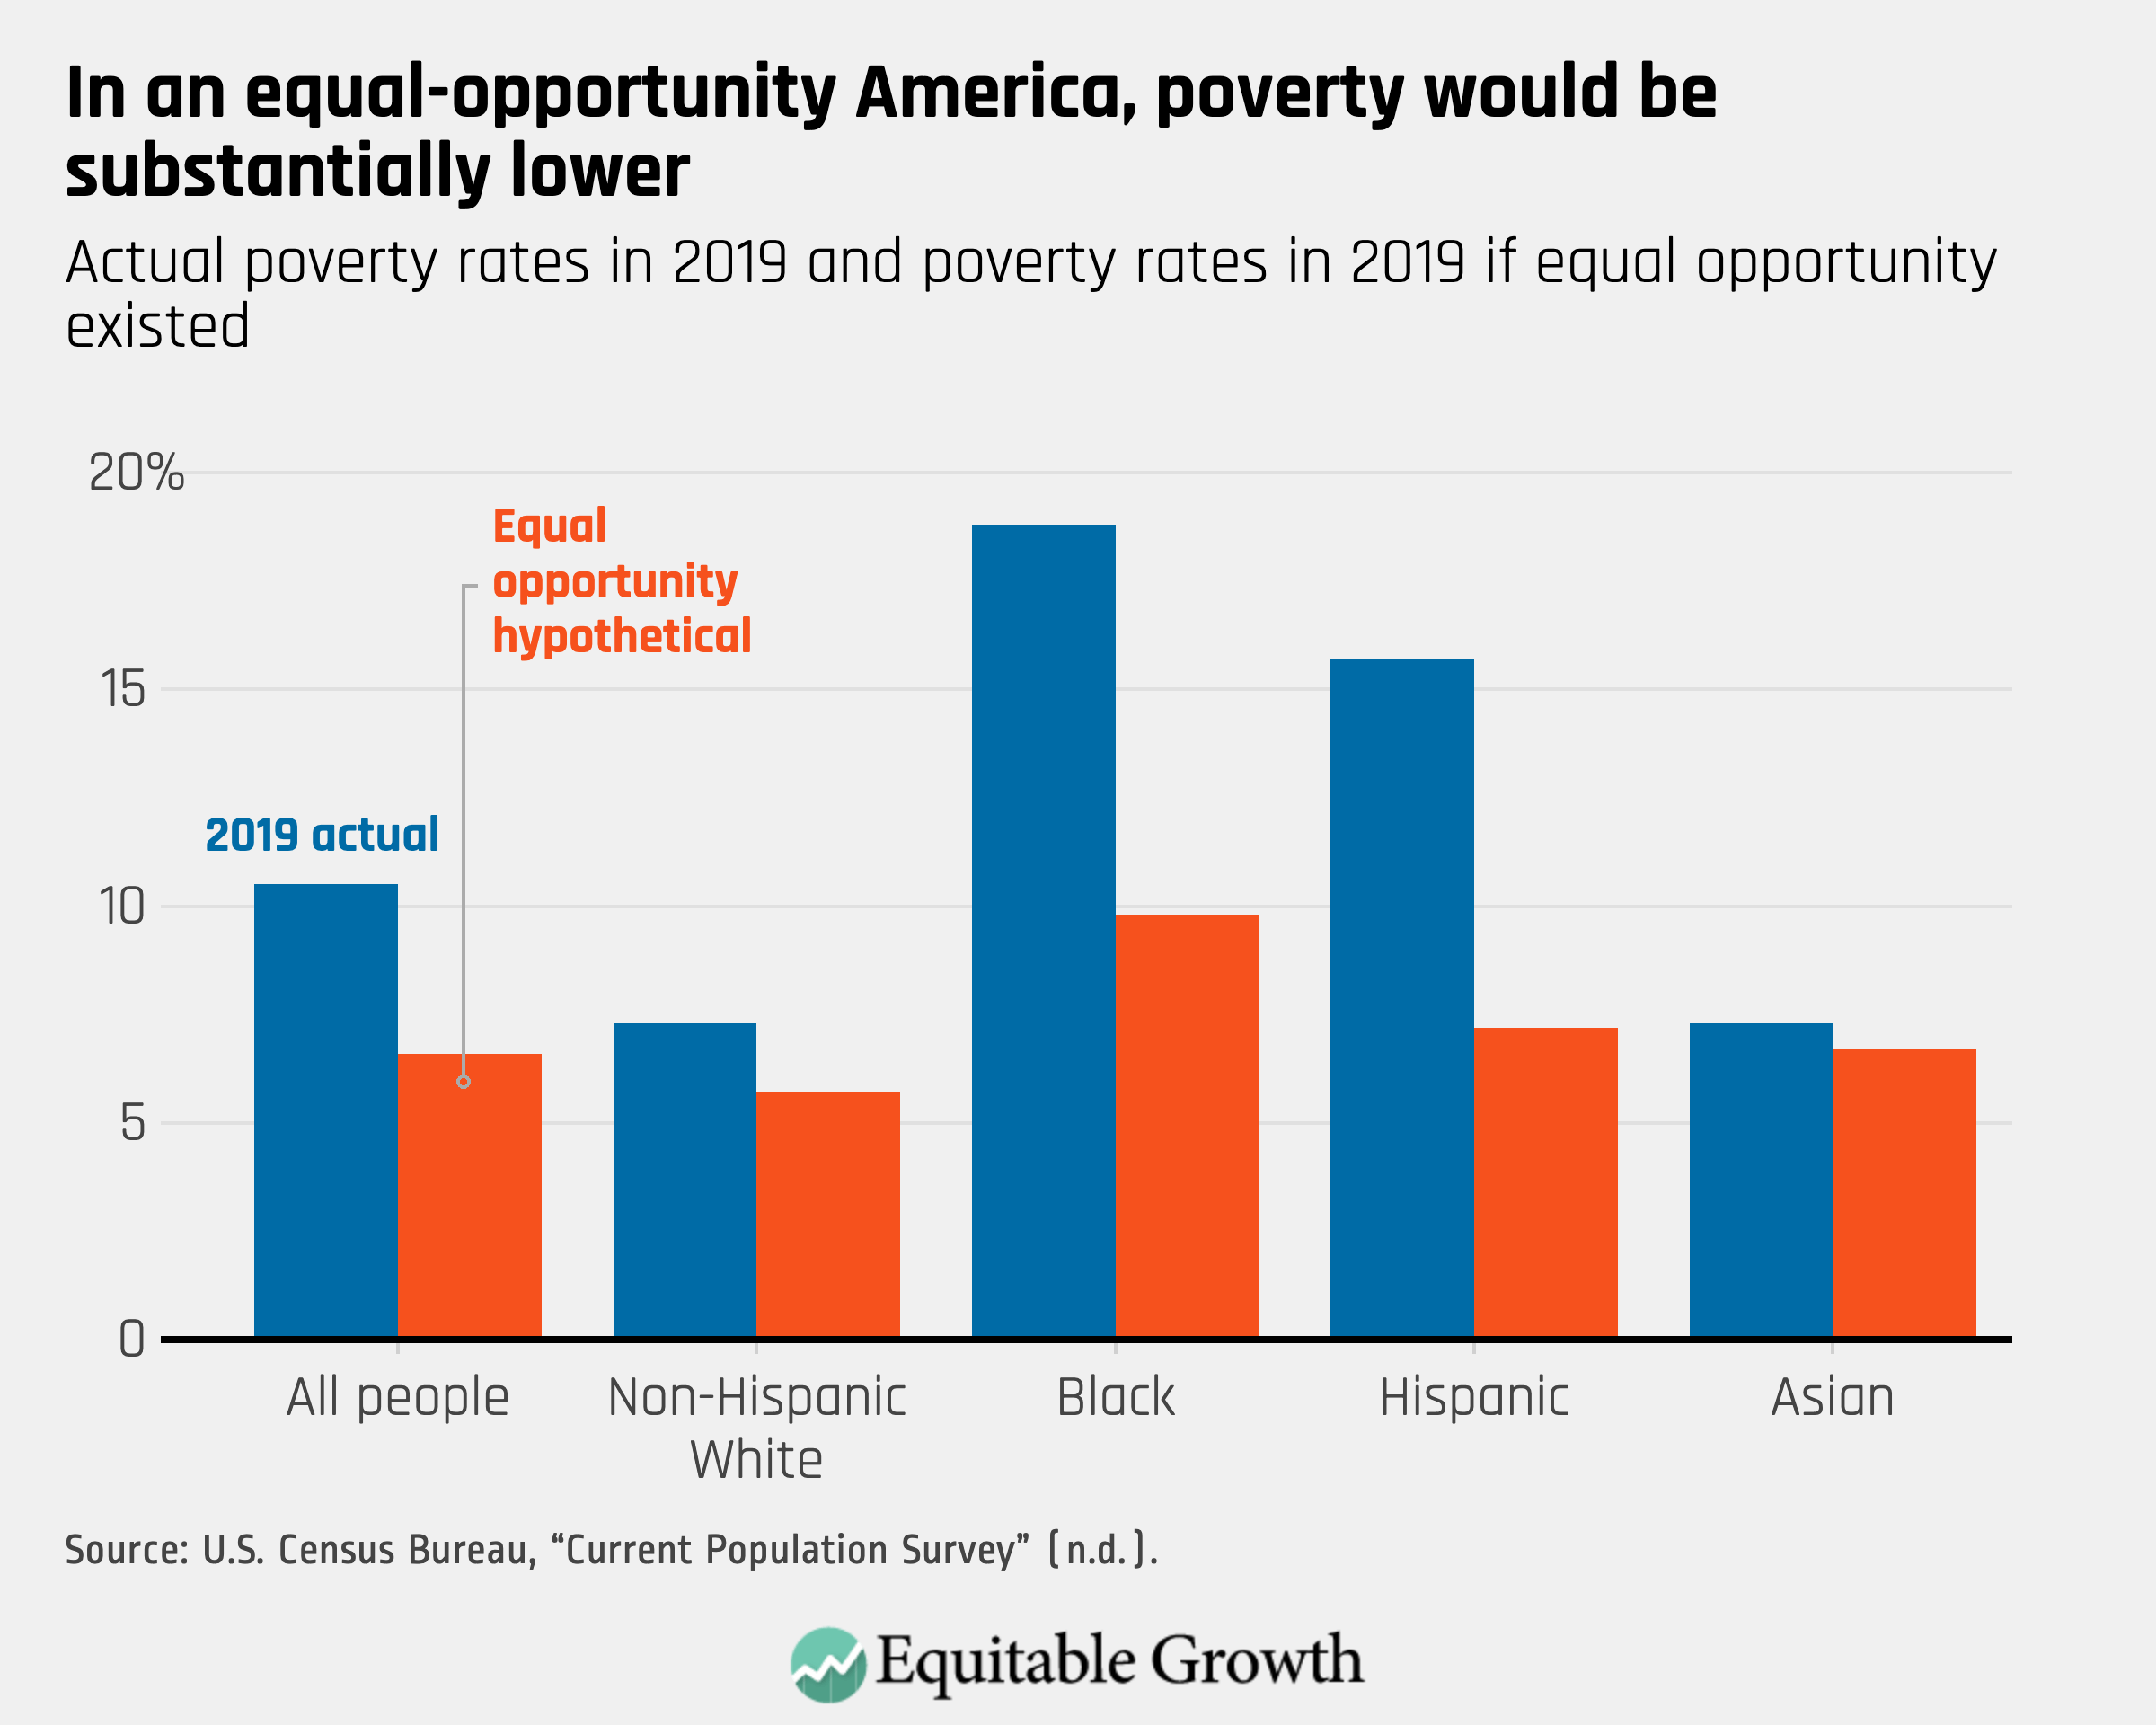
If equal opportunity prevailed in the United States and disparities in income earnings were largely eliminated, then the overall poverty rate would have dropped from 10.5 percent to 6.6 percent in 2019. The poverty rate for non-Hispanic White people in the country would have fallen to 5.7 percent (from 7.3 percent) due to the earnings growth of White women. Across the country, the poverty rate for Black people would have dropped to 9.8 percent (from 18.8 percent); the poverty rate for Hispanic people would have fallen to 7.2 percent (from 15.7 percent); and the poverty rate for Asian people in the country would have declined to 6.7 percent (from 7.3 percent). (See Figure 3.)
Figure 3
Compare these poverty levels to those actually registered in 2019. That year, 34 million people were living in poverty, as defined by the U.S. Census Bureau.2 This translates into 14.2 million non-Hispanic White people and 19.1 million people of color who lived below the federal poverty threshold in 2019.3 The poverty rate for males was 9.4 percent and it was 11.5 percent for females, representing 15 million men and 19 million women.
If race, ethnicity, and gender-based income inequality were largely eliminated in 2019, then this would have had the effect of lifting 12.2 million people out of poverty across the country, including 3 million non-Hispanic White women, 3.9 million Black people, 5.2 million Hispanic people, and 119,000 Asian people. The largest beneficiaries would have been women in general, and women of color in particular. Of the 12.2 million reduction in the total number of people living in poverty, more than three-quarters (9.3 million) would have been women, and roughly half (6.3 million) would have been women of color.
The solvency of the U.S. Social Security system
The effects on the long-run solvency of the U.S. Social Security system from eliminating racial, ethnic, and gender disparities are multifaceted. The projected rise in earnings would have increased the wages subject to Social Security payroll taxes, and thereby raised revenues for the system. In addition, since only the earnings below a maximum ($132,900 in 2019) are subject to Social Security payroll taxes, wage growth that was concentrated among lower-earning communities of color and women would have generated higher tax receipts than wage growth that was more evenly distributed.
In contrast, the higher earnings would have also increased the future benefits paid out by the program because initial Social Security benefits are indexed to wages. This means that greater payroll tax revenues would have been partially offset by larger future benefit payments.
On balance, the impact on the financial solvency of Social Security would have been positive and boosted the solvency of the system for decades to come. For example, the productivity and GDP increases calculated in this analysis are of such a magnitude that they would have generated significant additional Social Security tax revenue. The $7.2 trillion increase in GDP in 2019 would have increased Social Security tax revenues in 2019 by $429 billion, adding to the small $2 billion surplus in total revenues relative to outlays that year.4 The extra $429 billion in tax revenues would, in turn, have contributed to the long-run solvency of the system.
Conclusion
The U.S. economic consequences of eliminating racial, ethnic, and gender inequalities are large, particularly for individuals of color and women. The total earnings in the nation would swell well beyond what they currently are, and the incomes of Black, Hispanic, and Asian workers would be substantially higher. The largest earnings gains would be experienced by non-Hispanic White, Black, Hispanic, and Asian women.
There would be a substantial concomitant rise in GDP and dramatic declines in poverty rates overall, within communities of color and for women in particular. The nation as a whole would benefit from an enormous increase in tax revenue and an improvement in the solvency of the Social Security system.
It is important to emphasize that it is not just people of color and women who would benefit from the creation of an equal-opportunity society. Addressing the inequalities that undermine a level playing field would entail policies that benefit all members of society. Investing in high-quality pre-Kindergarten programs and in the nation’s physical infrastructure, improving the K-12 educational system, providing adequate healthcare and insurance, removing lead from drinking water, strengthening the solvency of the Social Security system, and increasing access to high-quality senior care would raise the productivity, earnings, and economic well-being of people of all races, ethnicities, and genders, including non-Hispanic White males. Since these benefits to non-Hispanic White males were not estimated, the economic benefits of equality of opportunity identified in this study are understated.
It is also important to note that the proportion of people of color in the total U.S. population is anticipated to grow from less than 40 percent in 2019 to more than half by 2045.5 This means the future positive impact of eliminating inequalities on earnings, GDP, tax revenues, poverty rates, and the solvency of Social Security would very likely be substantially larger than that estimated for 2019 in this analysis. The sooner policymakers address these disparities, the sooner we will be able to enjoy the benefits of moderating them.
A large body of research documents disparities in earnings by race, ethnicity, and gender that are not a function of ability, effort, or aptitude.6 This means talent and skill are not being fully recognized and put to their greatest use, let alone fairly rewarded. This results in a misallocation of our nation’s most precious resource—its people—and undermines our long-run economic growth and competitiveness.7 The economic costs of these disparities in economic opportunity are enormous, as this issue brief illustrates. Thus, although it may be difficult to realize an equal-opportunity society, the results for all of us are well worth the effort.
 report
Gender wage inequality
April 9, 2018
 report
The benefits and costs of investing in early childhood education
December 2, 2015

Methodology
Following the practice of the U.S. Census Bureau, this analysis uses non-Hispanic White males as the comparison group for other race groups, Hispanics, and women in the country.8 The analysis then calculates what earnings in the United States would have looked like in 2019 if all racial, ethnic, and gender groups earned the same average “total money income,” adjusted for age differences.9
Total money income is defined as all income from wages and other income sources, such as net income from self-employment and government income supports. Total money income is calculated by analyzing the responses to the Annual Social and Economic Supplement to the Current Population Survey carried out by the U.S. Census Bureau and the U.S. Bureau of Labor Statistics. The Current Population Survey is the most highly regarded source of information on earnings and labor force statistics for the population of the United States.
Accordingly, the hypothetical earnings in the United States in 2019 are estimated assuming that Black, Hispanic, and Asian men and women and White women earned the same average total money income as non-Hispanic White males did in 2019. This is done by assigning various racial and ethnic groups and women the same mean (average) total money income and percentage of income earners, adjusted for age, as that of non-Hispanic White males, as determined by the Current Population Survey of 2020, which estimated income in the United States for 2019.
This methodological approach implies that productivity and labor force participation are equalized across workers of all races, ethnicities, and genders. Average total money income across racial/ethnic groups and women in our hypothetical, disparity-free United States continues to vary somewhat across groups in this model because the age distribution varies by group. Hispanic workers for example, continue to have a lower average total money income than other groups because they are younger on average and not as advanced in their careers, and are thus lower down the salary ladder.
A final methodological note. As is standard in economic research that explores the consequences of narrowing racial, ethnic, and gender-based earnings divides, the model used in this analysis assumes that the relatively higher earnings of non-Hispanic White males in 2019 were a function of their higher productivity and labor force participation. If, instead, the higher earnings of non-Hispanic White males partly reflected their power to extract earnings from economic activity that exceeded the value of their current contributions to production—perhaps as a function of systemic racism and sexism or other factors—then the model overstated the economic benefits of leveling the playing field.
As race, ethnicity, and gender barriers to full participation in the economy are overcome, people of color and women would produce and earn more and grow the economy. Yet as obstacles to equal opportunity crumble, non-Hispanic White males may find that their capacity to extract earnings in excess of their productive contributions may evaporate, and they may earn somewhat less than at present, dampening the overall economic benefits identified in this analysis. This dampening effect would likely be most evident at the highest ends of the income distribution, where the racial, ethnic, and gender-based earnings divides are most pronounced. The resulting decline in the estimated total economic benefits would occur not because non-Hispanic White men would be less productive, but rather because the productivity of people of color and women would match a more accurate but somewhat lower level of actual non-Hispanic White male output than that assumed in this study.
Comparisons to other recent research on the effects of creating equal opportunity
The findings of this analysis are consistent with and similar to those of other recent studies. A 2021 working paper published by the Federal Reserve Bank of San Francisco concluded that closing racial and gender earnings divides would have increased total “earnings” in 2019 by 37.6 percent, or by $2.62 trillion from $6.97 trillion to $9.6 trillion.10 By comparison, the analysis conducted in this study concludes that earnings in 2019 would have increased 33.5 percent, or by $4.3 trillion from $12.7 trillion to $17 trillion.
The differences in these findings are mostly attributable to two factors. First, the Federal Reserve Bank of San Francisco working paper used a narrower definition of earnings—Average Hourly Earnings (those from wages and salaries)—than did this study, which analyzed changes in Total Money Income (which includes earnings from wages and salaries, as well as other forms of income such as self-employment income). Second, the San Francisco Fed’s working paper considered only earnings from people aged 25 to 64, while this study considered earnings from a broader group, people aged 15 and older.
That working paper also assumed that physical capital (man-made goods such as machinery, equipment, tools, and factories that assist in the production of products and services) would remain fixed even as earnings grew, whereas this study assumed that physical capital would grow in tandem with earnings growth. This difference in assumptions had a significant impact on estimated GDP growth. It caused the working paper to assume that GDP in 2019 would grow only by the same $2.62 trillion as would earnings in 2019. Thus, their estimated growth rate of GDP is implicitly only 12.2 percent (from $21.43 trillion to $24.05 trillion), compared to their estimated 37.6 percent growth in earnings. By contrast, this study assumed that GDP in 2019 would grow at the same rate as earnings, which is more consistent with the historical relationship between earnings and GDP. Thus, GDP in this study also grew 33.5 percent, or $7.2 trillion, from $21.43 trillion to $28.6 trillion.
A Citi GPS study in 2020 found that if racial divides between Black and White workers alone had been closed 20 years ago, then the U.S. economy would have generated an additional $16 trillion in output, or $800 billion in extra GDP per year.11 The study also projected that GDP would grow by an additional average of $950 billion per year between 2021 and 2025. This closely matches the $877 billion increase in earnings of Black workers in 2019 calculated in this study but is only a little more than half the estimated $1.48 trillion increase in overall GDP in this analysis that is attributable to creating equal opportunity for Black workers. This difference is largely because the Citi GPS report estimates the economic effects of closing only a subset of Black/White racial divides such as those in access to credit, education, healthcare, and housing.
A McKinsey & Company report in 2019 estimated that closing the Black/White racial wealth divide alone would add between $1 trillion and $1.5 trillion in inflation-adjusted GDP in the U.S. economy in 2028.12 This is similar to the $1.48 trillion addition to GDP in 2019 from creating equal opportunity for Black workers estimated in this study. But it is not clear how comparable the results are from these two studies because of the time difference (2028 versus 2019) and the differences in focus. The McKinsey & Company report calculated the GDP effects of closing only the Black/White wealth divide in housing, private consumption, and stock market investments, while this study analyzed the economic effects of creating equal opportunity for Black workers in all areas of the economy.
A W.K. Kellogg Foundation/Altarum study in 2018 calculated that the GDP of the United States would be 22 percent, or $8 trillion, larger in 2050 if the country eliminated racial earnings differences due to disparities in health, education, incarceration, and employment.13 The increase in GDP is smaller than the 33.5 percent calculated in this study largely because the W.K. Kellogg/Altarum study does not include the effect of closing gender-based earnings divides.
Acknowledgments
I would like to thank Marcus Corbin, Michael Ettlinger, Louisa Koch, Guy Molyneux, Charles Call, and Ed Paisley for their comments and suggestions, Ed Paisley and Emilie Openchowski for their excellent edits, and Dave Evans and Austin Clemens for their assistance with graphics.
End Notes
1. Federal, state, and local tax increases were calculated by applying tax rates as a percentage of GDP from the Bureau of Economic Analysis, “National Income and Product Accounts” (n.d.), Tables 1.1.5, 3.1, 3.2, and 3.3.
2. The poverty rates and number of people in poverty are from Jessica Semega and others, “Current Population Reports, P60-270, Income and Poverty in the United States: 2019” (Washington: U.S. Census Bureau, 2020). The reductions in poverty rates and the number of poor non-Hispanic White women, Blacks, Asians, and Hispanics were calculated by applying the estimated percentage increases in total money income of each group to the actual total money incomes of those members of each group who were earning between fifty percent and 100 percent of poverty level income as reported by the Current Population Report.
3. Nearly 800,000 people living in poverty fell into categories other than non-Hispanic White, Black, Hispanic, and Asian, such as people who identified themselves as American Indian or Native Alaskan.
4. Information on the finances of Social Security in 2019 is from the Office of the Chief Actuary, “The 2020 OASDI Trustees Report: The 2020 Annual Report of the Board of Trustees of the Federal Old-Age and Survivors Insurance and Federal Disability Insurance Trust Funds” (Washington: Social Security Administration, 2020). There was a shortfall in tax revenues relative to outlays of $79 billion, but interest earned on Social Security trust fund reserves generated $81 billion in revenue in 2019. Thus, in 2019, interest on trust fund reserves plus tax revenues exceeded total outlays by $2 billion.
5. U.S. Census Bureau, Population Division, “Table 11. Percent of the Projected Population by Hispanic Origin and Race for the United States: 2015 to 2060 (NP2014-T11)” (2014).
6. Francine D. Blau and Lawrence Kahn, “The Gender Wage Gap: Extent, Trends, and Explanations,” Journal of Economic Perspectives 55 (2017): 789–856; Tomaz Cajner and others, “Racial Gaps in Labor Market Outcomes in the Last Four Decades and over the Business Cycle.” Finance and Economics Discussion Series 2017-071 (Board of Governors of the Federal Reserve System, 2017); Jhacova Williams and Valerie Wilson, “Black Workers Endure Persistent Racial Disparities in Employment Outcomes” (Washington: Economic Policy Institute, 2019); Valerie Wilson and Janelle Jones, “Working Harder or Finding It Harder to Work: Demographic Trends in Annual Work Hours Show an Increasingly Fractured Workforce” (Washington: Economic Policy Institute, 2018).
7. Chang-Tai Hsieh and others, “The Allocation of Talent and US Economic Growth” Econometrica 87 (5) (2019): 1439–1474; Sarah Truehaft, Justin Scoggins, and Jennifer Tran, “The Equity Solution: Racial Inclusion Is Key to Growing a Strong New Economy” (Oakland, CA: PolicyLink/PERE, 2014).
8. The term “non-Hispanic White” refers to people who are not Hispanic and who reported White alone as their race in the Current Population Survey of 2019.
9. Total money income is defined as the arithmetic sum of money wages and salaries, net income from self-employment, and income other than earnings.
10. Shelby R. Buckman and others, “The Economic Gains from Equity.” Working Paper 2021-11 (Federal Reserve Bank of San Francisco, 2021), available at https://doi.org/10.24148/wp2021-11.
11. Dana M. Peterson and Catherine L. Mann, “Closing the Racial Inequality Gaps: The Economic Cost of Black Inequality in the U.S.” (New York: Citi GPS: Global Perspectives & Solutions, 2020).
12. Nick Noel and others, “The economic impact of closing the racial wealth gap” (New York: McKinsey & Company, 2019).
13. Ani Turner, “The Business Case for Racial Equity: A Strategy for Growth” (Battle Creek, MI and Ann Arbor, MI: W.K. Kellogg Foundation and Altarum, 2018).