Equitable Growth’s Jobs Day Graphs: September 2021 Report Edition
On October 8th, the U.S. Bureau of Labor Statistics released new data on the U.S. labor market during the month of August. Below are five graphs compiled by Equitable Growth staff highlighting important trends in the data.
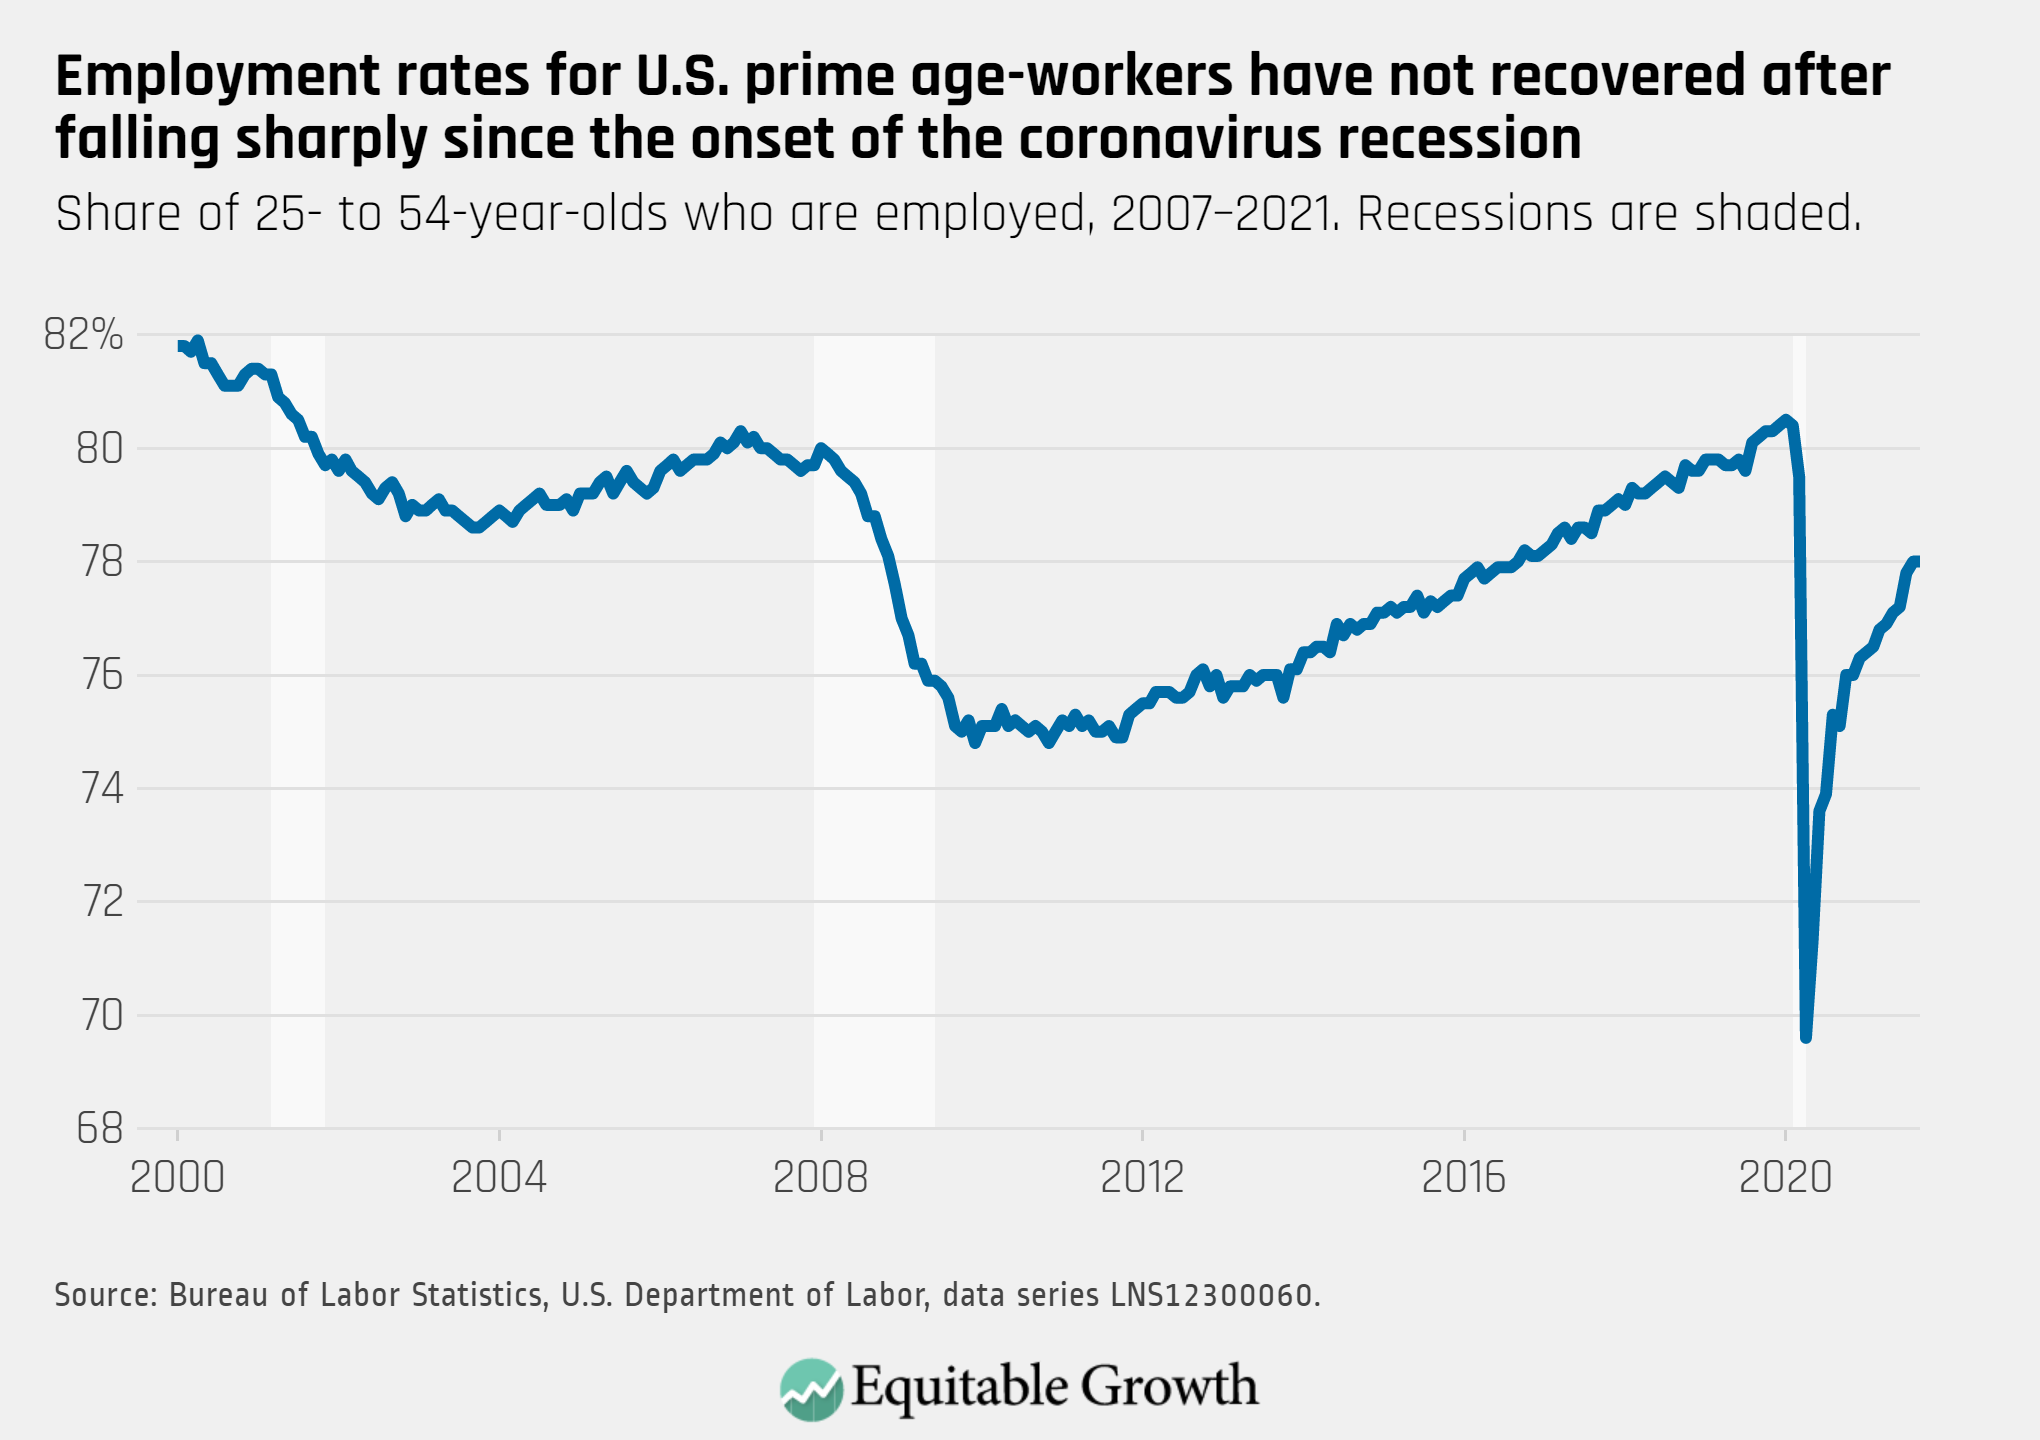
The employment rate for prime-age workers remained steady in September at 78.0 percent, still well below pre-pandemic levels.
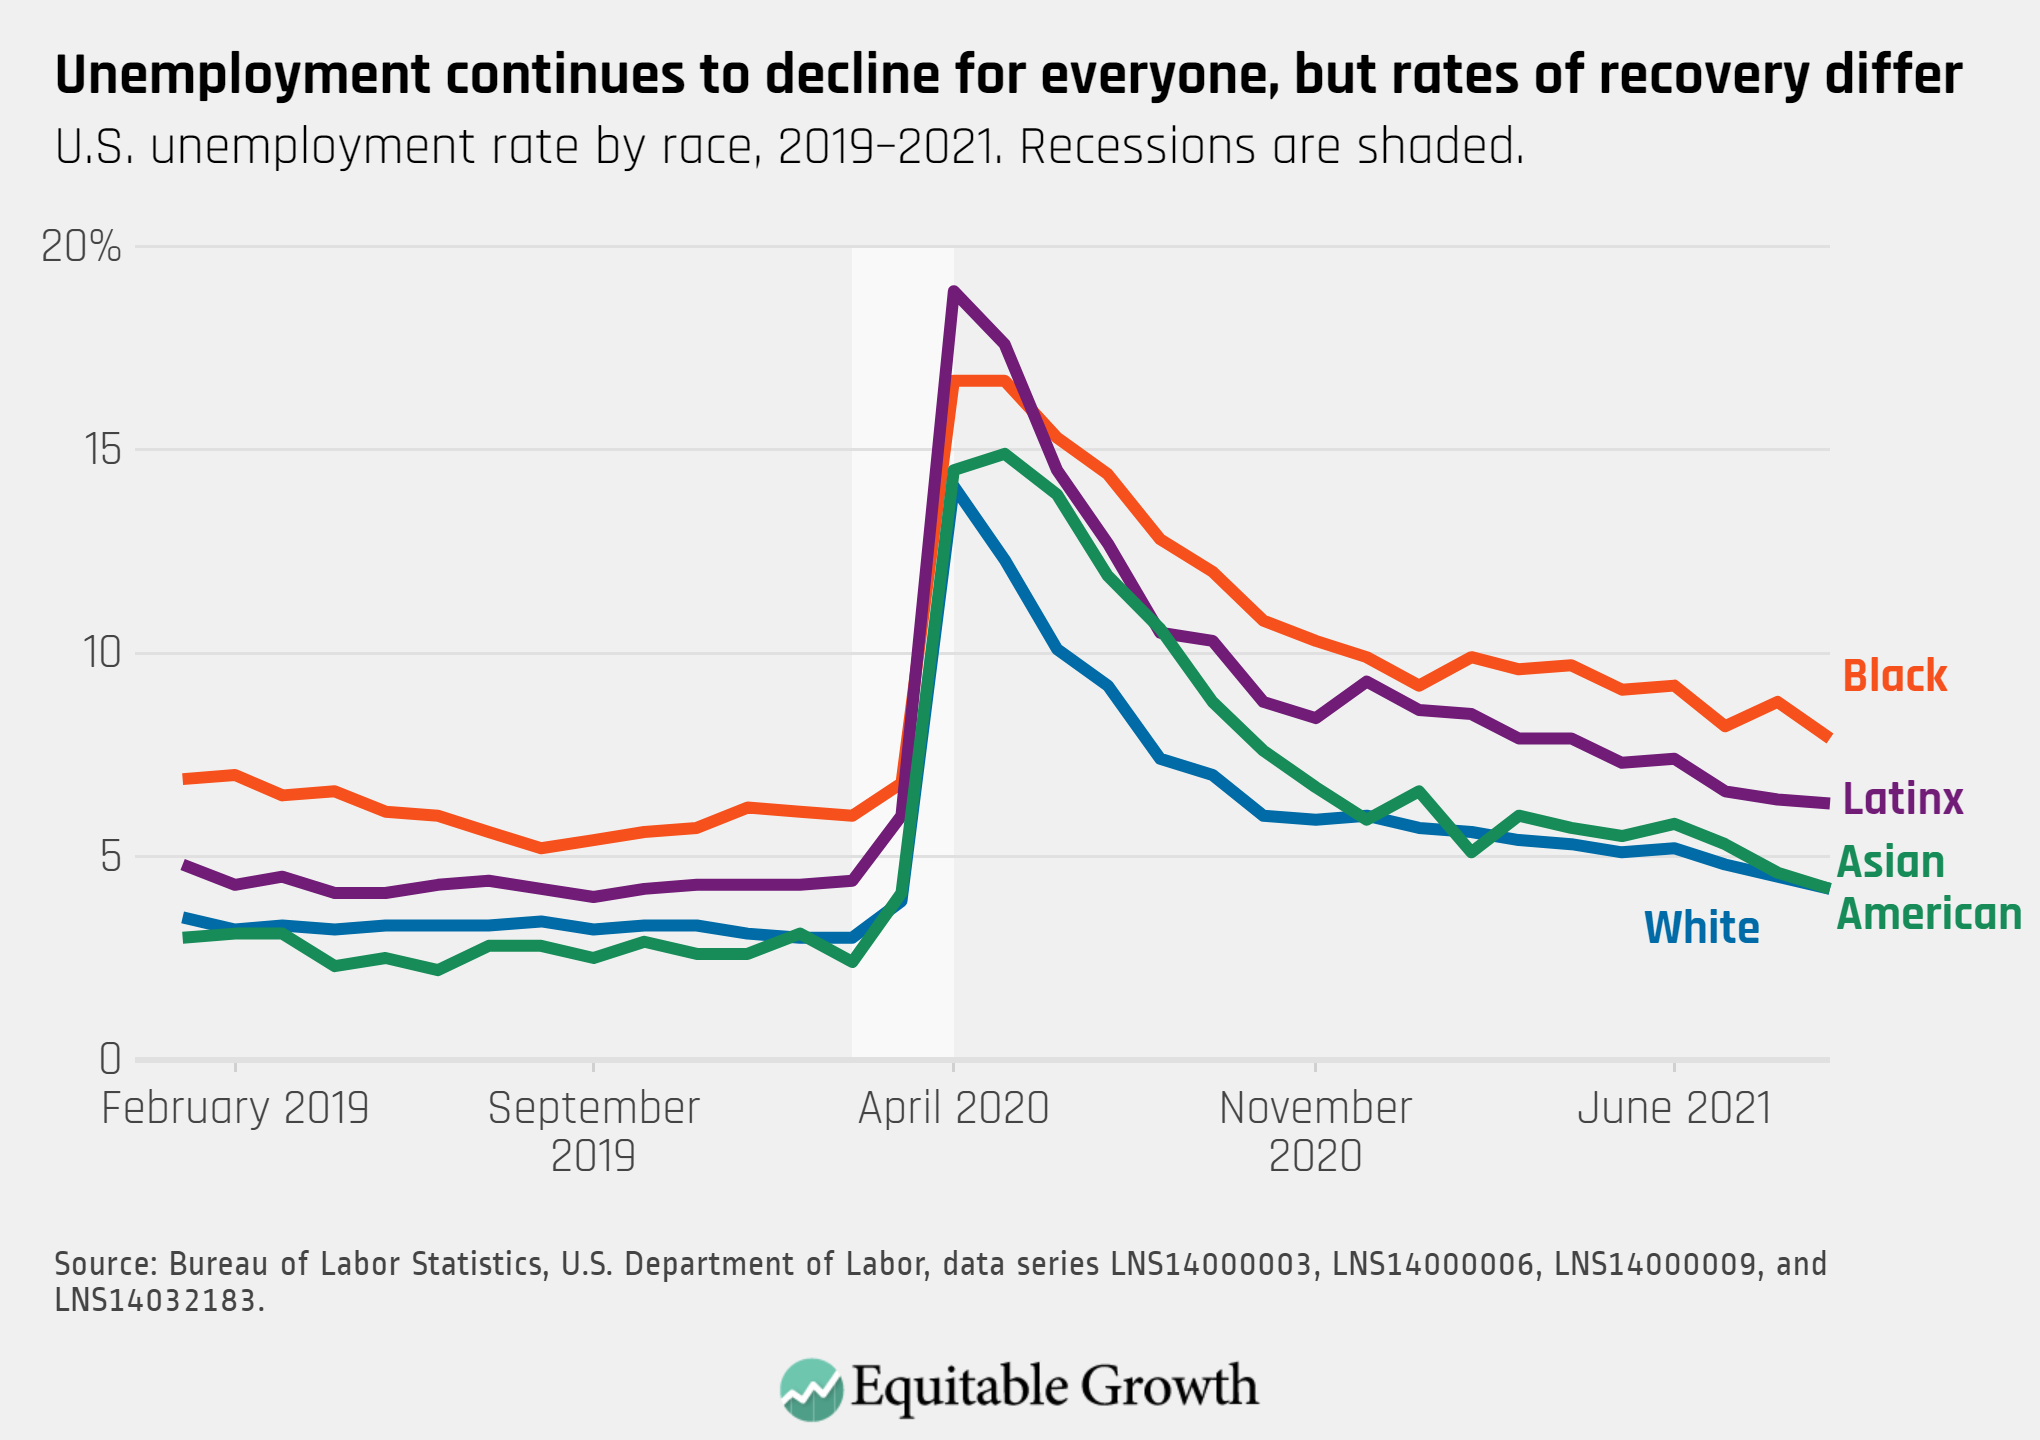
The unemployment rate declined to 4.8 percent, with Black workers (7.9 percent) and Latinx workers (6.3 percent) still experiencing markedly higher unemployment rates compared with White workers (4.2 percent) and Asian workers (4.2 percent).
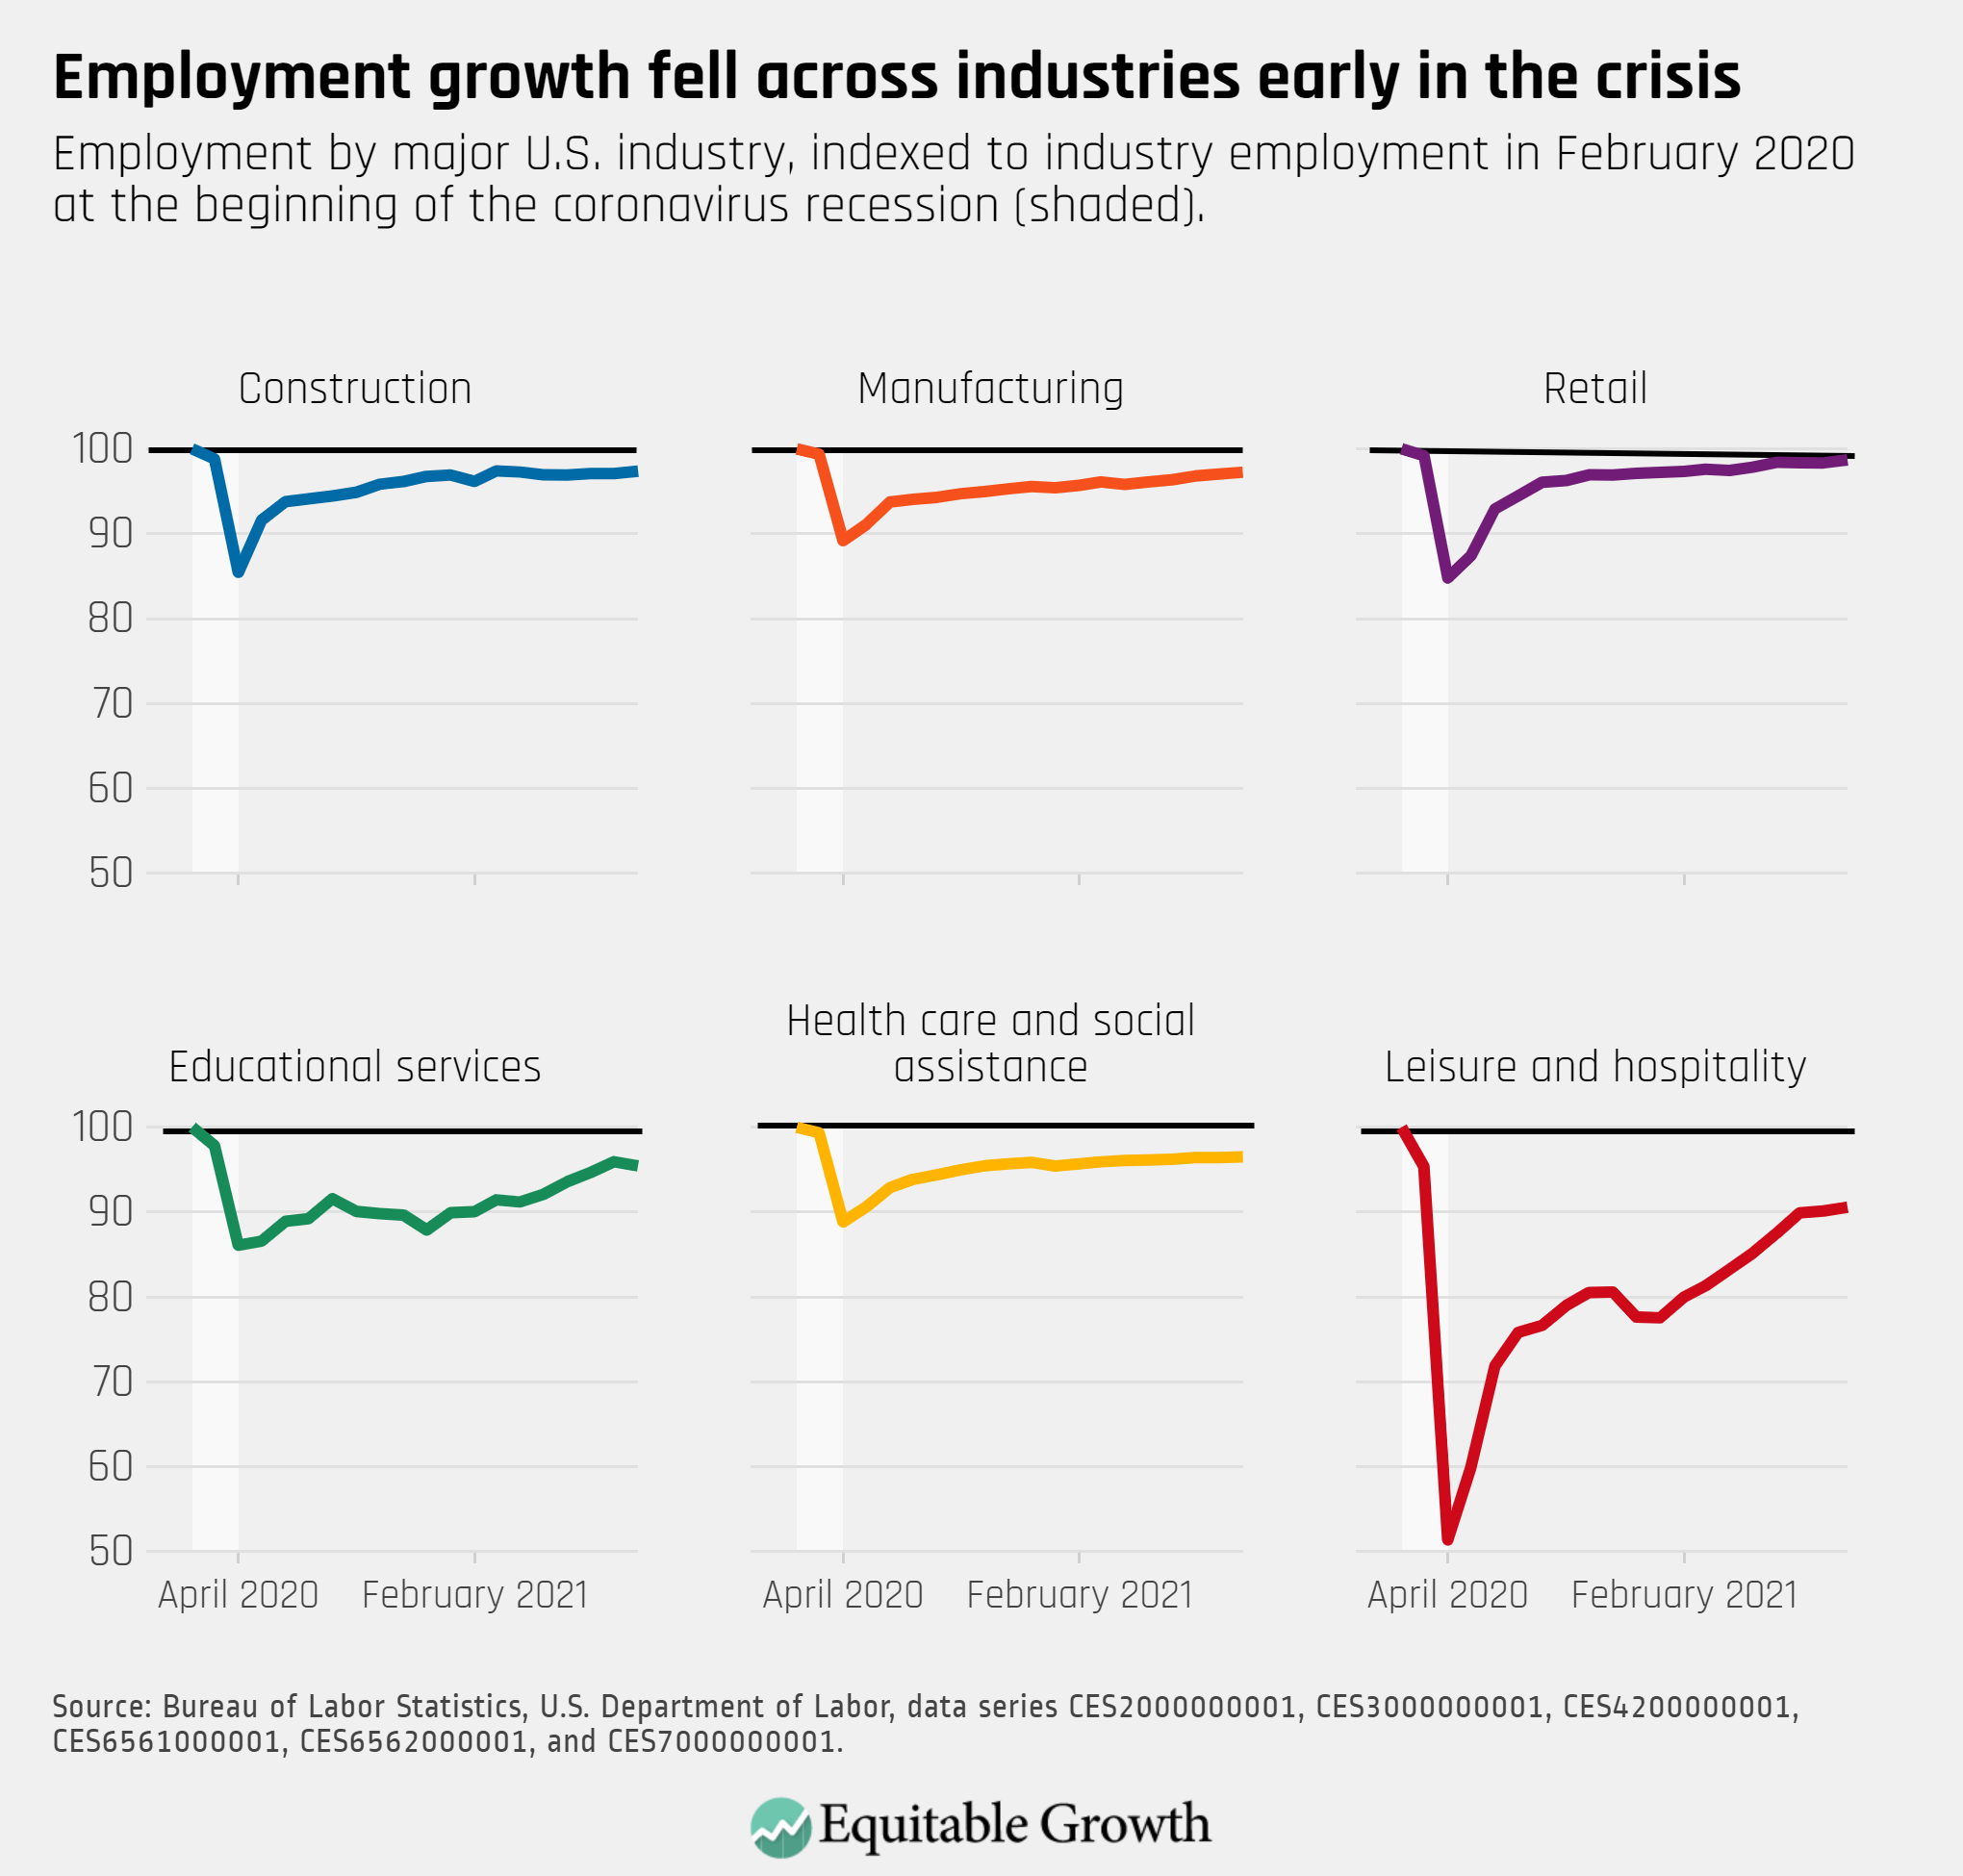
Total employment increased by only 194,000 in September. Employment in educational services declined, and employment in leisure and hospitality, after recent strong gains, increased more slowly.
The employment rate for women was steady at 53.4 percent in September, and the rate for men increased from 63.1 in August to 64.4 in September.

In September, the share of workers unemployed due to permanent job losses was 38.5, and another 14.7 percent of workers are unemployed as a result of job losses due to temporary layoff. About 10.3 percent are leaving jobs, 30.0 percent re-entering the labor force, and 6.4 percent are new entrants.
