Every month the U.S. Bureau of Labor Statistics releases data on hiring, firing, and other labor market flows from the Job Openings and Labor Turnover Survey, better known as JOLTS. Today, the BLS released the latest data for December 2022. This report doesn’t get as much attention as the monthly Employment Situation Report, but it contains useful information about the state of the U.S. labor market. Below are a few key graphs using data from the report.
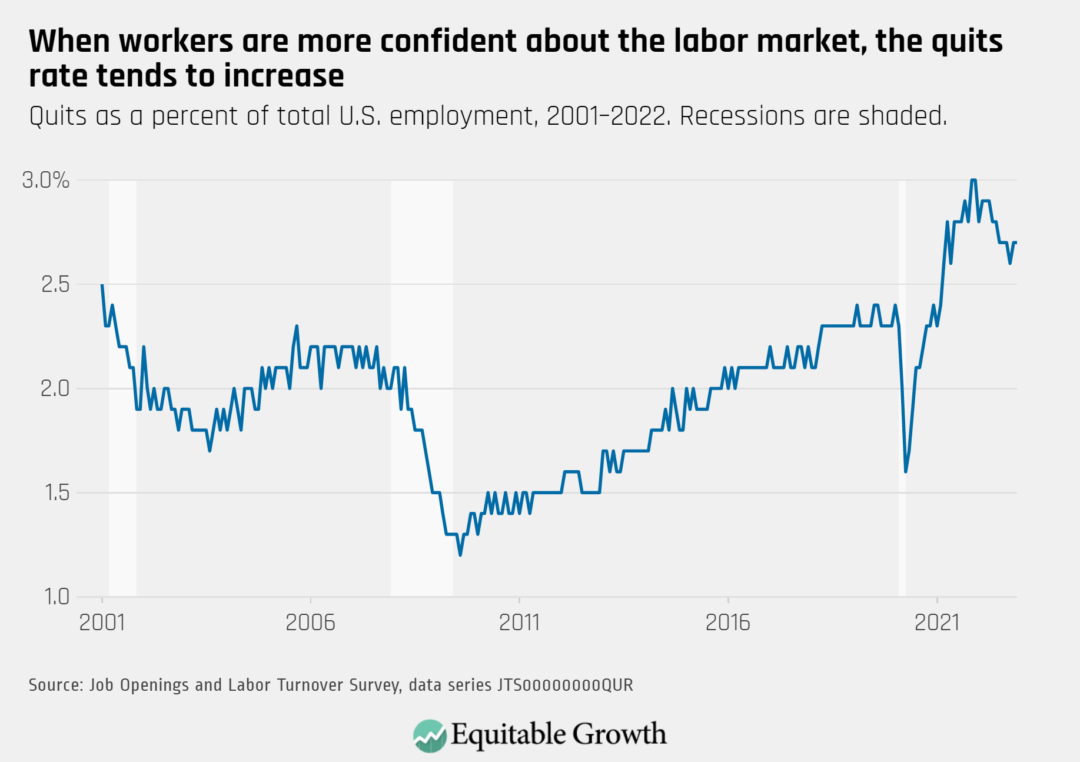
The quits rate remained steady at 2.7 percent as 4.1 million workers quit their jobs in December 2022.
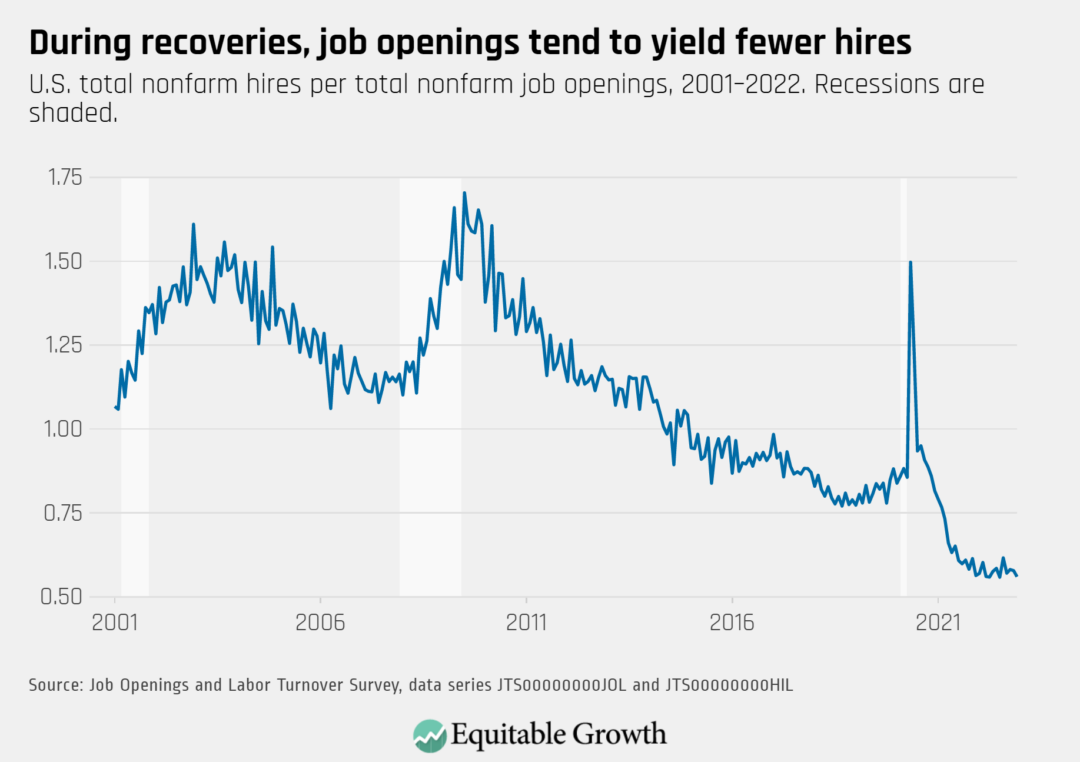
The vacancy yield decreased to 0.56 in December as job openings rose to 11.0 million and hires remained at 6.2 million.
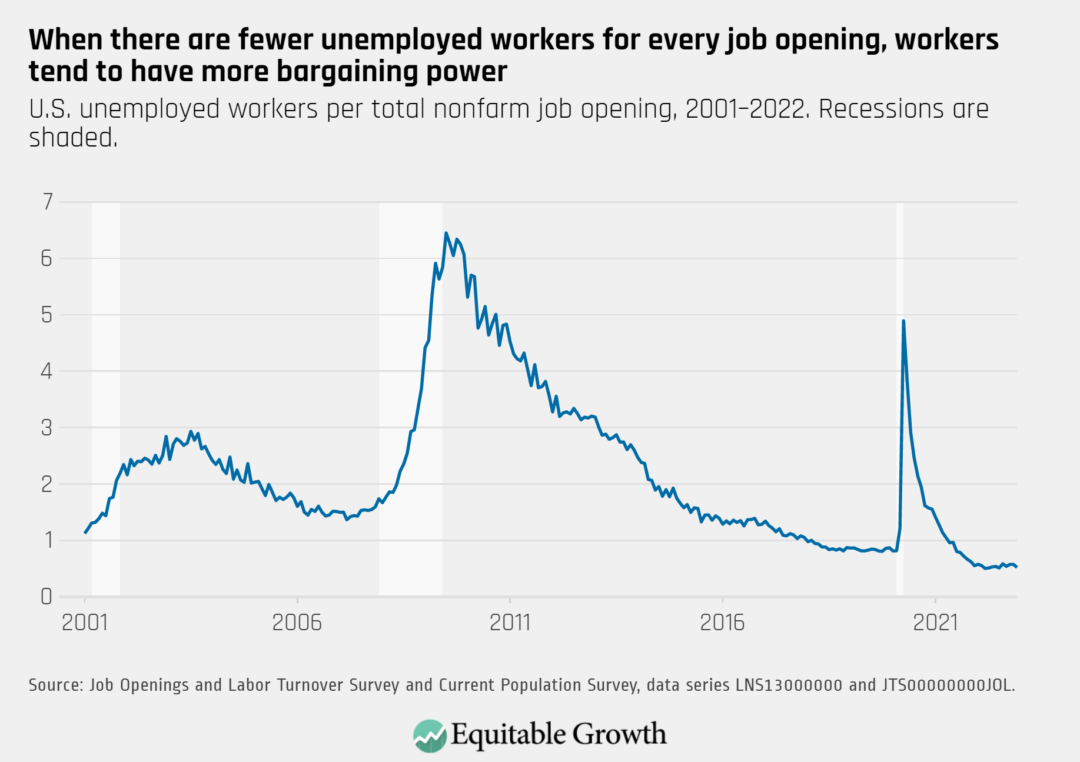
The ratio of unemployed workers to job openings declined to 0.52 in December 2022 from 0.57 in November.
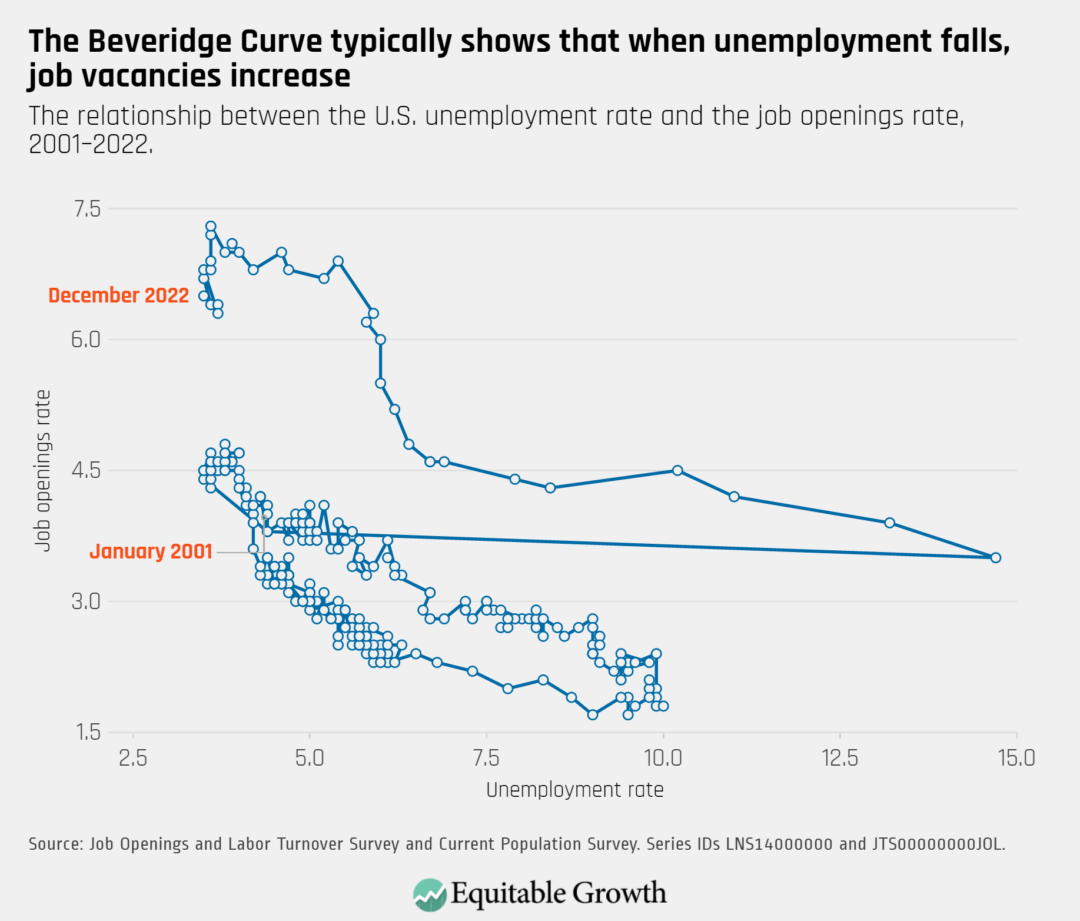
The Beveridge Curve continues to be in an elevated range compared to previous business cycles, as the unemployment rate declined to 3.5 percent and the rate of job openings rose to 6.7 percent.
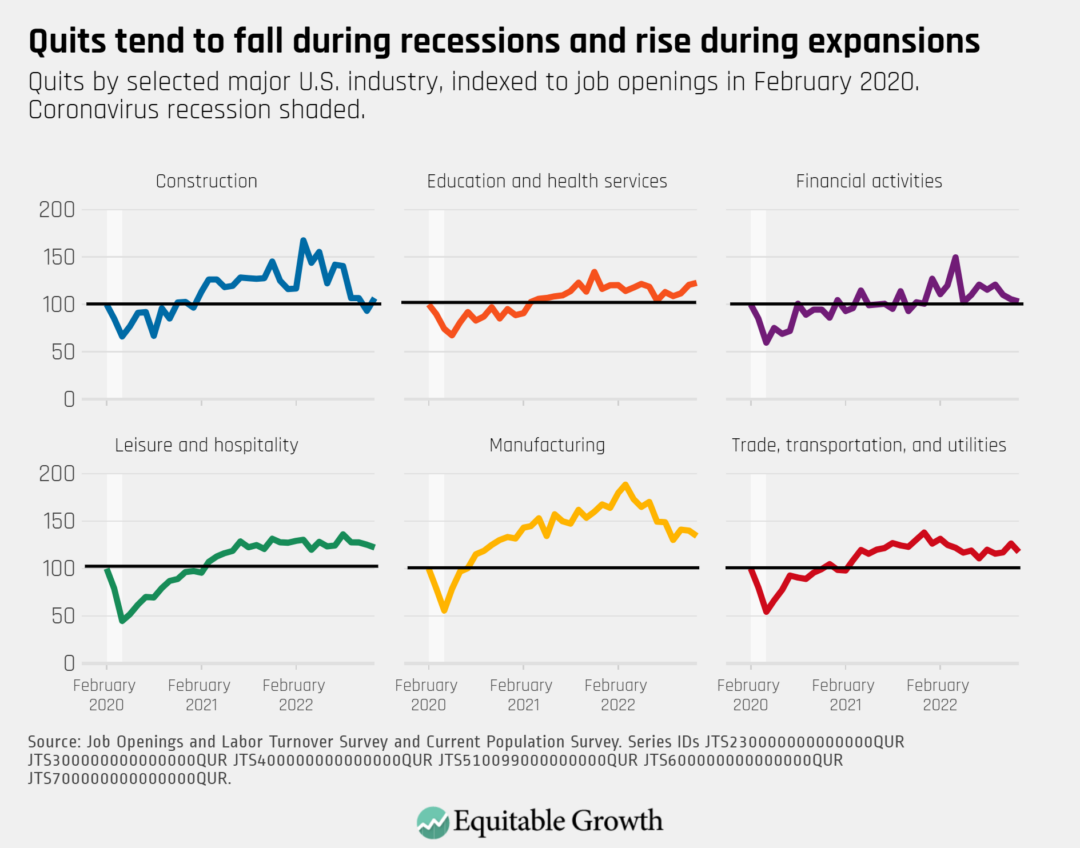
The total number of quits remained steady in December. Quits rose in some industries, such as construction and education and health services, and fell in others, such as leisure and hospitality, and manufacturing, and trade, transportation, and utilities.
The word “infrastructure” brings to mind the big physical systems that underpin the U.S. economy, such as highways, bridges, tunnels, and water and sewage systems. Indeed, infrastructure is composed of the very basic organizing structures that the economy and our society need to function. Without such necessities as electricity, for instance, daily life and economy activity would quickly grind to a halt.
Yet physical infrastructure isn’t the only type of infrastructure the U.S. economy and society needs in order to keep running. A less visible but equally important type of infrastructure is the social infrastructure that provides a foundation for other economic activity and helps maintain standards of well-being. Social infrastructure is the policies, resources, and services that ensure people can participate in productive social and economic activities. This includes social services, public education, and healthcare.
Two other fundamental components of social infrastructure are adequate care and adequate income. Ensuring that individuals and their families have the care they need—whether to address their own or a loved one’s medical issues or child care—allows people to meet their personal needs and participate in broader societal and economic activity. Similarly, having sufficient income to put food on the table and keep a roof overhead is a necessary precondition for maintaining a minimum standard of living and an ability to participate fully and productively in the economy.
Electricity, running water, transportation, and internet connectivity facilitate modern U.S. workers’ ability to get to their jobs and do them well. In the same vein, social infrastructure is essential to ensuring economic well-being for individuals and for society as a whole.
Conversely, the inadequate provision of social infrastructure can be a barrier to economic and social activity. When people have to scramble to arrange care for a child, an elderly parent, or a disabled family member; when they lack the health supports they themselves need; or when they are hungry, cold, or unhoused, they are hard-pressed to attend school, go to work, or otherwise participate in civil society.
Additionally, in-kind transfers that cover needs that are so basic that mostly everyone spends on them—such as food and housing—are also considered income supports. By receiving income to cover these basic needs, people can free up money in their budgets for other things. For this reason, programs such as the Supplemental Nutrition Assistance Program,child care subsidies, and subsidized housing are often considered income support programs.
Some policy analysts further divide income support programs into social insurance programs and other income transfer programs that are variously referred to as social welfare, social assistance, public assistance, or means-tested programs. Social insurance is a type of income support program that has a very specific structure, in which an individual pays an earmarked tax into a specific fund that only covers that income support program, such as Unemployment Insurance, disability or old-age Social Security, or a state paid family leave program. Then, if individuals become eligible for these programs—because they lose their jobs, become disabled, age, or have a child, for example—they are paid money out of that specific fund.
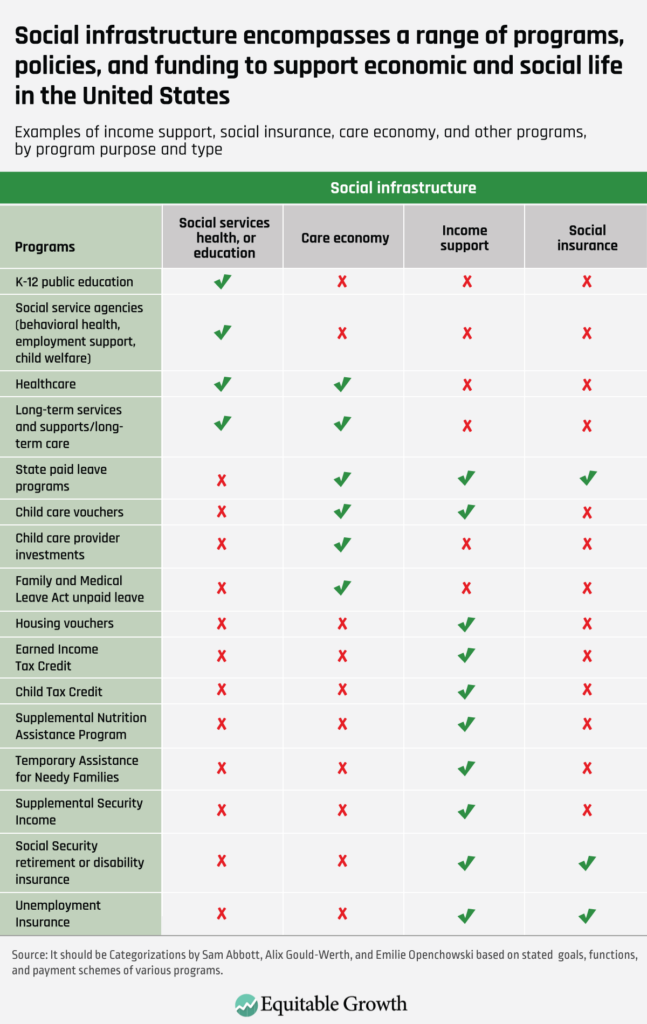
Other income support programs have different revenue structures and are thus not generally considered social insurance. These programs include the Supplemental Nutrition Assistance Program, Temporary Assistance for Needy Families, and Supplemental Security Income—all of which provide income support for people but are not funded by contributions from those individuals. Rather, they are funded by general tax revenue and may include some cost-sharing by states. (See Table 1.)
Table 1
Often, academics, policymakers, journalists, and the general public use the misplaced metaphor of the “social safety net” when referring to investments in social programs in the United States. Of course, some programs are indeed there to “catch” people who experience a temporary “fall,” such as a job loss or sudden onset of a health problem. But this metaphor doesn’t work well for the many social programs that are necessary to support daily life unfolding in a predictable manner, free of catastrophe.
Just as electric lighting is not a safety net catching a person who faces darkness each night, routinely provided preventative healthcare is not a safety net catching someone who faces the challenges of maintaining a healthy body each day. Similarly, having a child is a normal life event that must be supported over the full course of the child’s development, so that future generations can be productive in our economy and engaged in our society. Social infrastructure is the necessary foundation of daily life and its accompanying economic rhythms, not simply a temporary Band-Aid in a moment of emergency.
Sometimes, policymakers and advocates justify investments in social programs using the language of moral imperatives or kindness toward those in our communities who are suffering. These are fair motivations to invest in many social programs. But they are not the only reasons. All people in society need social infrastructure. As detailed above, it takes sustained investment in physical and social infrastructure to undergird an economy and a society in which people have adequate living standards throughout their lives and are productive members of the U.S. workforce.
Predictions about which jobs may be “lost” in the United States as employers implement new automation and algorithmic technologies often consider management tasks and roles as the leastvulnerable to being entirely displaced by these new technologies. As Equitable Growth grantee and Research Advisory Board member David Autor explains, the tasks and roles that have been seen as less susceptible to automation so far are often those that can be described as nonroutine cognitive and social tasks, which are common in professional and managerial roles.
Of course, many forecasters do suggest that advanced automation and algorithmic technologies—aided and abetted by artificial intelligence—will one day advance to the point that they are able to replace managerial roles. But the loss of management roles to different kinds of automation and algorithms is not a far-off trend of the future. In many ways, it is already here, yet invisible—in part because of how U.S. companies use these new technologies to “offload” management tasks and roles to their lower-level employees, gig workers, and even customers.
Pervasive monitoring and automated management affect U.S. workers throughout the economy
Both platform-directed “gig” workers and workers classified as employees are impacted by automated and algorithmically driven management practices. Gig workers, who are frequently misclassified as “independent contractors” are particularly vulnerable to harms from these practices, often finding their entire work processes overseen by algorithms. But algorithmic management and monitoring practices also impact wage and salary workers in many industries, including retail, care work, call centers, and warehousing.
One common form this monitoring takes is employers’ use of algorithmically guided scheduling practices. Unpredictable or “just-in-time” scheduling is an example of an algorithmically guided practice that seeks to minimize labor costs and increase short-term efficiency, but which increases stress and economic precarity for workers.
Algorithmic management in misclassified ‘gig’ work offloads invisible management work to U.S. workers and customers
Certain types of managerial decisions—such as those about a worker’s performance evaluation, pay, hours, and continued employment—are automated or algorithmically driven, while others are displaced to the workers themselves. In a recent working paper presented in the Academy of Management Proceedings, Princeton University sociologists Diana Enriquez and Janet Vertesi analyzed interviews of gig workers who worked for Uber Technologies Inc., Amazon.com Inc., and Lyft Inc. The researchers describe a process of “automation by omission,” in which the companies’ platforms are designed to automate key parts of what would otherwise be a “middle management” layer of oversight, but in a way that functionally (and invisibly) offloads other middle management tasks to the workers themselves.
These middle management tasks include constant decisions about how to optimize earnings, purchase and manage equipment and other costs, and even crowdsourcing ways to improve performance with other drivers in online forums. These companies also use technology to shift management functions directly to customers, whose feedback or ratings of workers may directly impact their performance evaluation with no manager or mediating actor.
As a result, Enriquez and Vertesi find that the workers “bear the costs associated with representing a platform and themselves when there is any contrast between the projected expectations of the customer and the completed service.” Platform gig services give customers “an upper hand in transactions” relative to the workers, as a 2021 analysis of algorithmic management in work explained, and company-side management tools are predominately limited to aspects such as the integrity of payment transactions and monitoring workers’ performance.
An example of this is documented in the recent report, “At the Digital Doorstep: How Customers Use Doorbell Cameras to Manage Delivery Workers,” by Aiha Nguyen and Eve Zelickson at the independent research organization Data & Society. Their report shows how customers display three broad types of management or supervisory behavior over delivery drivers: monitoring, instructing, and punishing. By classifying workers as independent contractors and giving customers direct managerial input on them, in addition to the company-side monitoring and control, companies are thus able to enjoy the benefits of a highly monitored workforce without the direct managerial costs—or regulatory and legal accountability—that would otherwise accompany such detailed management.
Further research and new policy actions can protect U.S. workers from visible and invisible algorithmic management decisions
One challenge in understanding the full scope of present and potential harms from these practices is that U.S. employers often use technology in managing workers in ways that are difficult for external researchers, policymakers, and regulators to track, and are generally not required to share that information publicly or with regulators.
Increasingly, however, academic researchers, policy experts, and worker groups are working to expand our knowledge of how new forms of technology affect workers and the economy to bring this “invisible work” into research and policy conversations. Researchers have already outlined many of the ways that algorithmic management and other data-driven technologies harm workers and shape working conditions, as well as key areas of interest for policymaking.
But more work remains to be done. As described in our 2023 Request For Proposals, the Washington Center for Equitable Growth is interested in research that seeks to answer questions around how employers use automation and other new technologies in the workplace and how these decisions interact with and are affected by the broader regulatory and policy landscape.
This research will be assisted by new policy efforts to bring accountability to these practices. Just this month, new policies went into effect in California giving workers employed by large businesses more information about how their employers are surveilling them and using data about them—an important first step of many in bringing labor protections into the 21st century.
Cities and states also are addressing specific practices common within algorithmic management, such as just-in-time scheduling practices. And at the national level, regulators and policymakers are likewise examining how to protect workers from the potential harms of automated decision-making and increase accountability and oversight in U.S. workplaces. Taken together, these and other promising policy avenues can help mitigate these harms to U.S. workers, alongside a growing body of research examining those dangers and the efficacy of those technologies in U.S. workplaces.
Wealth inequality in the United States has grown significantly over the past five decades, with the overall share of wealth becoming more concentrated among the highest-income families. A lot of research in economics and other social sciences has examined the causes and consequences of this wealth inequality, but a new working paper by the sociologist Robert Manduca at the University of Michigan argues that this research is incomplete.
The working paper highlights that the existing literature on wealth inequality in the United States has been successful at connecting wealth today to events in the past, but it has not fully explored the connections between wealth in the present and events in the future. This future-oriented approach to wealth is commonly taken by accountants and asset managers in the wealth management sector of the financial services industry and also captures the importance of what Manduca identifies as “social wealth.”
This distinction between how wealth relates to the past and the future is important. The past-oriented approach to wealth views a large fortune as something akin to a giant vault of gold coins. This image brings with it certain associations: Wealth is durable, it accumulates little by little over time, and it has an objective value. Much of the most impactful research on wealth inequality thus far documents how these specific attributes can link wealth today to events in the past—showing, for instance, how the durability of wealth allows initial income and wealth inequalities to exacerbate over time and how present disparities are directly connected to unjust and discriminatory government policies implemented by previous generations of policymakers.
Yet the financial professionals who work with wealth on a daily basis view it in a very different way. In fields such as accounting and asset management, wealth is typically understood as control over some future income stream, such as dividends from a stock or rental income from an investment property. In the wealth management sector of the financial services industry, the value of an asset reflects the amount of income it will generate going forward, discounted by uncertainty and distance into the future.
In other words, rather than a pile of gold coins, this future-oriented perspective imagines wealth as a series of bank deposits arriving each month without requiring any further work by their recipient. A wealthy person, from this perspective, is someone who has a legal right to a large stream of future payments. Indeed, as Manduca explains, “The past-oriented view might see a fortune of $10,000,000 as the end result of a multigenerational process, in which an initial endowment from generations back … grows over the years through periodic additions and compound interest. The future-oriented perspective would see the same fortune as a legal right to (roughly) $600,000 a year of income, from now until the end of time.”
This future-oriented perspective on wealth can be just as illuminating as the past-oriented one. The forward-looking view, however, has important implications that may not have been considered yet for policymaking related to wealth creation and wealth inequality. Before diving into those details, however, it’s important to first consider three of the main functions that wealth performs, especially for those individuals and families in the bottom 99 percent of the wealth distribution in the United States:
Wealth is used as investment liquidity. Future asset growth, such as buying a home or investing in a postsecondary education, often requires putting down some money upfront.
Wealth is used as insurance in emergencies. Such contingencies include unforeseen injuries, lost wages, or property damage. Emergencies are particularly relevant, as the Federal Reserve finds that only 64 percent of U.S. households can cover a $400 emergency expense.
Wealth can be a long-term income replacement. This is the case with retirement income, for example, when it’s drawn from wealth-accumulating assets.
Most policy proposals focus on reducing wealth inequality and so tend to emphasize new ways of distributing ownership of traditional private assets. Proposals such as baby bonds, for instance, would distribute capital grants to individuals upon adulthood so they can make investments in housing, education, or business.
But if, instead, wealth is viewed as an entitlement to a set of future payments, then a broader set of policies should be on the table. The federal government already provides guarantees of future income payments through social insurance programs, such as Social Security and Unemployment Insurance. These programs are used by many families to meet needs they would otherwise meet through private savings.
Manduca calls these programs “social wealth” because they can be widely shared and accessed, compared to any of the particular ways in which individuals and households accumulate personal wealth. This social wealth also essentially serves as a primary form of wealth for many households because these income support payments offer families forward-looking confidence about their future assets and financial stability.
As Manduca explains, the value of social wealth is enormous. One recent study estimates the wealth equivalent of Social Security alone to be comparable to all private wealth in the country. In terms of wealth creation, then, few policies have had an impact anywhere near as large as the establishment of social insurance programs. By bolstering these programs, policymakers can create equitable and egalitarian wealth across U.S. households.
To be sure, social wealth isn’t fully interchangeable with private marketable assets. But Manduca’s new paper highlights the need for researchers and policymakers to use different definitions and perspectives of wealth that fit with the specific topics they are trying to address. The types of assets that are useful when saving to make a down payment on a house, for example, are different from the types that are useful when saving for retirement or experiencing a family emergency.
Researchers should thus be sensitive to these distinctions, and policymakers should consider the opportunities they offer. Considering the connections between wealth and the future, in addition to wealth’s connections with the past, is a good place to start.
Equitable Growth is committed to building a community of scholars working to understand how inequality affects broadly shared growth and stability. To that end, we have created the series “Expert Focus.” This series highlights scholars in the Equitable Growth network and beyond who are at the frontier of social science research. We encourage you to learn more about both the researchers featured below and our broader network of experts.
Individual and shared financial well-being has widespread implications for broader economic outcomes, from boosting local economies through consumption to ensuring worker productivity and bolstering future growth. The ability to build wealth is an important contributing factor to financial well-being as it offers asset-building opportunities that pay dividends long into the future, while also ensuring families have a financial cushion to tap into when facing large expenses (think investments in human capital such as attending university) or financial emergencies (such as a job loss).
Yet wealth inequality in the United States has grown exponentially in recent decades, with the share of U.S. wealth increasingly held by a small group of individuals and families. Indeed, many workers and their families are now excluded from wealth-building opportunities in the United States, such as homeownership or investing in the stock market, whether due to longstanding discrimination and systemic racism or other barriers—including lack of access to credit or financial institutions, healthcare, and high-quality education—that hamper intergenerational mobility and macroeconomic growth, and fuel the racial wealth divide. More must be done to address these hurdles so that wealth distribution in the United States is more equitable.
This month’s installment of Expert Focus showcases scholars researching financial well-being, including asset-building and reducing the racial wealth gap in the United States. The research that these and other scholars are producing sheds light on the deep roots of racial, ethnic, and gender inequality, how these types of inequality are perpetuated through generations of U.S. households, and the impacts in terms of income and wealth inequality on children and families today and in the future—as well as on potential solutions and areas for further research.
The Washington Center for Equitable Growth is currently accepting applications for our 2023 Request for Proposals, which seeks to fund researchers examining various types of inequality and its impact on strong, stable, and broadly shared economic growth. Find more information on the 2023 Request for Proposals, funding channels, who is eligible, and how to apply. Additionally, watch our Doctoral/Postdoctoral & Dissertation and Academic webinars for more information.
Donn Feir is an associate professor in the Department of Economics at the University of Victoria. They are an applied econometrician with expertise in contemporary and historical Indigenous policy, including Indigenous economic development and labor market experiences, economic history, labor economics, and race and the economy. Feir writes extensively on outcomes among Native Americans and First Nations peoples, from economic effects on health and well-being to the impact of recessions on labor mobility to disparities in mortgage financing rates. In 2022, they received an Equitable Growth grant to further study so-called deaths of despair—deaths by suicide and those caused by drug or alcohol use—among Native American women and girls in the context of fracking booms near Native American lands, which often lead to increases in human trafficking that disproportionately affects Native women and girls.
Alexandra Killewald is a professor of sociology at Harvard University. Her research uses quantitative methods to study inequality in the United States, with two specific areas of focus: the gendered intersection of work and family, including how marriage and parenthood affect wages, mothers’ employment patterns, and other time-use and wage outcomes among couples; and intergenerational wealth inequality and the racial wealth divide, including how children’s outcomes are closely linked to their parents’ and grandparents’ wealth positions and the impact of social origins on wealth disparities by race. Killewald finds that racial disparities in wealth persist even among those who are born to parents with similar levels of resources, suggesting that the racial wealth gap in the United States is not solely tied to socioeconomic status at birth.
Fabian Pfeffer
University of Michigan
Fabian Pfeffer is an associate professor in the Department of Sociology at the University of Michigan, research associate professor at the Institute for Social Research, and he also serves as the director of the Stone Center for Inequality Dynamics. His research centers on inequality across time and generations, specifically focusing on wealth inequality and its consequences for future generations, intergenerational transmission of inequality, and education’s role in maintaining inequality. He also studies the effects of experiencing social mobility. In 2020, Pfeffer received an Equitable Growth grant to build a new dataset linking tax data and housing equity data that will enable the examination of wealth inequality and mobility. He also spoke with Equitable Growth in 2019 about his research on wealth inequality, how wealth and income inequality differ, and policies that can make intergenerational wealth transfers more equitable.
Trina Shanks
University of Michigan
Trina Shanks is the Harold R. Johnson Collegiate Professor of Social Work and the director of the Center for Equitable Family and Community Well-Being at the University of Michigan. Her research focuses on child well-being and poverty, asset-building policy and practice, the legacy of slavery on racial wealth inequality, and community and economic development. She has also written on the financial health of millennial workers, which is of consequence to the broader U.S. economy as these workers age and make up a larger percentage of the U.S. labor force. Shanks recently co-authored a paper on COVID-19’s impact on financial vulnerability in the United States, finding that changes in circumstances—from housing to health—as a result of the pandemic led to increased material hardship. Additionally, she is a co-lead for the Social Work Grand Challenge to reduce extreme economic inequality.
Equitable Growth is building a network of experts across disciplines and at various stages in their career who can exchange ideas and ensure that research on inequality and broadly shared growth is relevant, accessible, and informative to both the policymaking process and future research agendas. Explore the ways you can connect with our network or take advantage of the support we offer here.
Five or 6 years ago, economists and pundits frequently debated whether the incomes of low- and middle-class households in the United States were stagnating. I wrote about it, and I think what I said then more or less holds up. Wage growth for these households wasn’t zero, so “stagnant” might be inaccurate in the strict sense, yet wage growth was slow at the bottom of the income ladder—and particularly so in the wake of the Great Recession, which left lower-income workers mired in a poor job market until about 2014.
At the time I wrote that column in 2018, income data from a Congressional Budget Office report was only available through 2015, so the evidence of the effects of a tightening U.S. labor market after that year were only just emerging. Moreover, income growth at the top of the income distribution was much stronger than what other households were experiencing, making “stagnant” a more apt description, relative to those households at the top. And prior to 2014, the vast majority of households underperformed the average as high-income households captured large shares of economic growth.
Now, some economists and analysts are revisiting that debate. Michael Strain of the American Enterprise Institute says that income stagnation was a myth, while the online pundit Matthew Yglesias thinks we should take more note of recent declines in income inequality. I don’t fundamentally disagree with either of these views. Income inequality does appear to have declined slightly between 2007 and 2019, but the pace of that decrease was excruciatingly slow. And while I don’t think income stagnation was a complete myth, strong wage growth from 2014 onward modestly improved the situation for low- and middle-income households up to 2019. Yglesias and Strain stop their analysis in 2019, but economic relief packages during the COVID-19 pandemic and recession significantly decreased inequality to levels we haven’t seen this century. As temporary relief from the government fades, however, those gains will probably prove fleeting.
In this column, I provide additional context on the recent trajectory of wages and income and wealth inequality in the U.S. economy. I use recent data releases from the Congressional Budget Office, which are the data Strain and Yglesias use in their separate analyses, as well as data from the U.S. Bureau of Economic Analysis and the Federal Reserve, to look more closely at these trends. The BEA data series, which I have writtenabout frequently, is an exciting new tool for evaluating how income inequality and economic growth are related in the U.S. economy. It is similar to the Federal Reserve’s Distributional Financial Accounts, which provide a timely view of trajectories in U.S. wealth inequality.
Both Yglesias and Strain are correct to point out the strong wage recovery of the late 2010s and the resulting dip in income inequality metrics. I add three bits of context in this column. First, the decline in inequality since 2007 has been extremely slow. Second, the better part of that decline is attributable to so-called government transfers—programs such as the Child Tax Credit and the Supplemental Nutrition Assistance Program—and the way both the Congressional Budget Office and Bureau of Economic Analysis account for government healthcare spending. Third, in an encouraging sign, wealth inequality was rising through 2015 but has been mostly flat since.
Income inequality is declining really slowly
Both Strain and Yglesias focus on the period from 2007 to 2019, a span of years that begins with the Great Recession. Initially, the Great Recession decreased inequality. Recessions usually take a larger toll, in percentage terms, on higher-income households due to the fall in business revenues and the value of assets, such as stocks and bonds. But shortly after the Great Recession, the stock market and top incomes came surging back, while incomes for most U.S. households languished. It’s the second half of this period, from 2014 to 2019, when the incomes for lower-income households really started to pick up. And this did reduce income inequality.
But economists and pundits alike should have some humility about the pace of that reduction because it was very, very slow. According to CBO estimates, in the 28 years from 1979 to 2007, the share of income held by the highest-income quintile of U.S. households rose from 41.7 percent to 51 percent—a 9.3 percentage point rise (I use the after-tax-and-transfer income measure for all CBO calculations). From 2007 to 2019, that share dropped 2.4 percentage points to 48.6 percent of income earned. That trend would have to continue for another 35 years to get us back to 1979 levels of income inequality.
There’s nothing magical about 1979. It’s simply the year the Congressional Budget Office started its analysis. According to the two economists perhaps most famous for identifying rising income inequality—Thomas Piketty at the Paris School of Economics and Emmanuel Saez at the University of California, Berkeley—income inequality started rising in the early 1970s, based on their own, much longer time series of data, and the more equitable distribution of income in the United States in the mid-20th century won’t return anytime soon.
It’s good to keep in mind that this recent dip in inequality is pretty small, compared to the huge run-up in income inequality experienced over the past 50 years after the prior two decades of equitable income growth and economic growth.
The CBO income measure includes realized capital gains from the sale of assets, such as stocks and bonds and property, which makes its measure of income inequality more volatile than income measures that exclude realized capital gains. It’s therefore important not to infer too much based on arbitrary beginning and end points: 2007 was the highest top quintile share of income ever recorded by the Congressional Budget Office, at 51 percent, and the top quintile share fluctuated quite a bit between 2007 and 2019. If one instead uses a 3-year average around 2007 and 2018 to smooth the volatility in realized capital gains, then the drop in the top quintile share of income is half as large, at just 1.2 percentage points.
The BEA distributing personal income dataset, which excludes realized capital gains, tells a more ambiguous story. Between 2007 and 2019, the agency reports that the share of income held by the top quintile increased, from 47.3 percent to 47.6 percent. The Congressional Budget Office’s top quintile share is probably higher in large part due to their accounting for unrealized capital gains, and this may also account for a significant portion of the drop in top incomes.
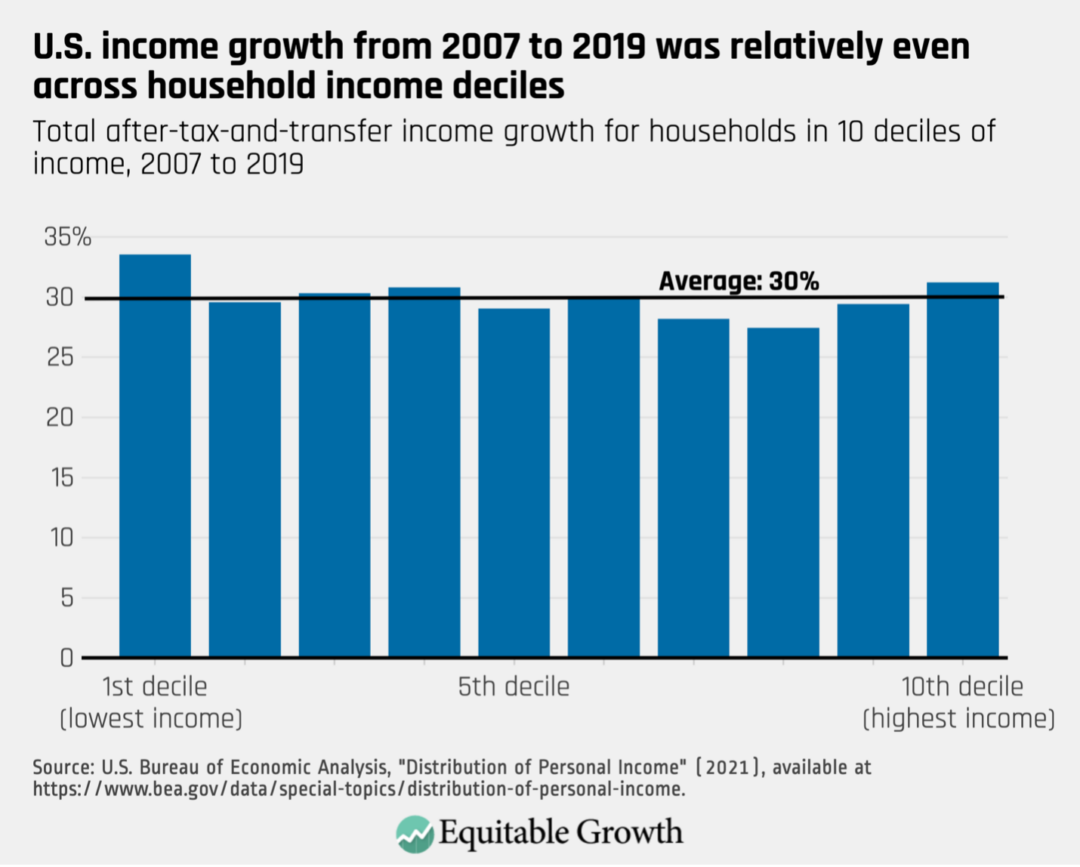
That’s not to say that the Bureau of Economic Analysis finds no reduction in income inequality. According to the agency, the Gini coefficient—a common one-number summary of inequality in an economy, where higher numbers mean more inequality—for after-tax-and-transfer income decreased 2 percent in this period. But that’s not because of losses at the top. Rather, it’s because of some compression in the middle. On average, incomes grew by 30 percent over this 12-year period. The lowest decile of income saw the largest gains, and the top decile saw the second-largest increases. The losers are upper-income households; the eighth decile saw income growth of 27 percent, the lowest among all deciles. (See Figure 1.)
Figure 1
Given these caveats, I’m hesitant to lean into the “inequality is declining” narrative. It might be more accurate for now to say that income inequality has been essentially flat since 2007.
While the CBO dataset currently only runs through 2019, the BEA data runs through 2021, and the story of the COVID-19 pandemic is pretty interesting. The massive increase in government transfers intended to help people weather the pandemic was a game-changer for income inequality. According to BEA data, the Gini coefficient fell almost 8 percent from 2019 to 2021. That’s a huge change for 2 years, and the lowest Gini coefficient in the BEA dataset, which starts in 2000.
That’s impressive, but the transfers that made this drop possible—including the expanded Child Tax Credit, enhanced Unemployment Insurance, and direct stimulus checks—have all expired now, so the Gini coefficient will likely go up again. And it will be a few years from now before the data are available to calculate the long-run impact of the pandemic on income inequality.
Wages increased, but most of the rise for low- and middle-income U.S. households was from government transfers
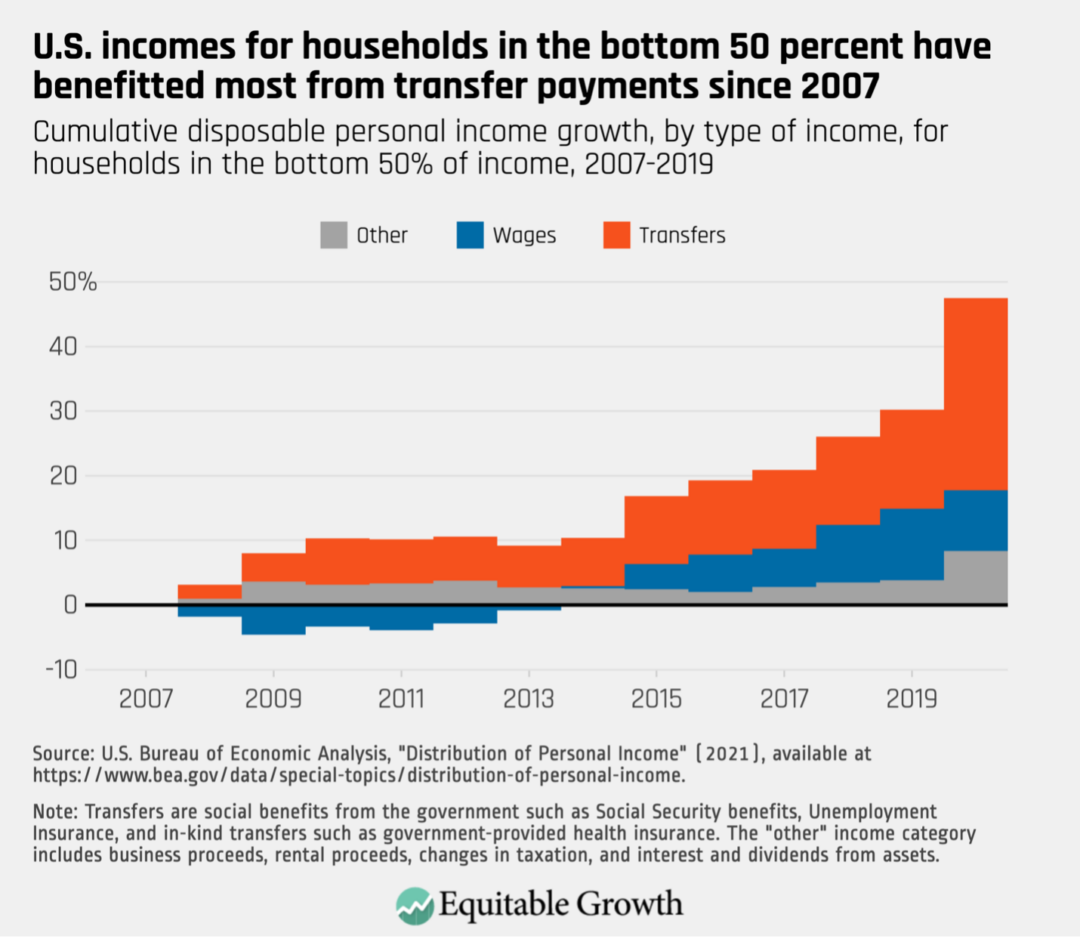
Policy changes during the Obama administration, particularly the Affordable Care Act, led to gradually increasing benefits for low-income U.S. households from 2014 onward, when Obamacare first began to be implemented. In the 2007–2019 window, according to the BEA data, 50 percent of the cumulative increase in income for the bottom 50 of households came from transfers, which includes government-provided healthcare in BEA’s accounting, while 36 percent came from increasing wages, and 14 percent was from other sources, such as business income, rental income, and stock dividends. (See Figure 2.)
Figure 2
In 2020, the percentage of income coming from transfers went up dramatically, thanks to pandemic cash transfer programs. (BEA publishes initial data for 2021 but does not include breakdowns by type of income, so 2020 is the most recent year where income can be decomposed and we can see the impact of transfers.)
The Affordable Care Act boosted in-kind transfer income because both the Congressional Budget Office and the Bureau of Economic Analysis treat government-provided health insurance as income. That is, if a household receives Medicare or Medicaid, several thousand dollars are added to their income to represent the value of that insurance (average per-capita spending on Medicaid enrollees in 2019 was $6,556).
Some economists object to this kind of accounting. Notably, Nobel-Prize winner Angus Deaton at Princeton University objects to valuing the inputs to healthcare instead of the outputs. That is, the amount of money the government spends on providing healthcare to a person doesn’t necessarily correlate to the value that individuals get out of that insurance because the cost and quality of healthcare varies from place to place across the country. Medicare and Medicaid are undoubtedly beneficial to those who receive it. The issue is whether and how to value the money spent on those programs when determining income inequality.
But the main reason to be concerned about a drop in inequality that is driven by in-kind transfers, and the Affordable Care Act in particular, is that it may not be sustainable. The Affordable Care Act started providing most of its benefits in 2014, and its benefits expanded over the years as more states opted into the expansion of Medicaid as part of Obamacare. There are still states that haven’t opted in, so ACA spending might grow and provide further in-kind transfer income to those at the bottom. But in states where Medicaid expansion has already occurred, ACA benefits are already included in income, so that income will stop contributing to CBO-measured income growth (and declining inequality) in those states, and low- or middle-income households will be more dependent on wage increases to raise their incomes.
Paradoxically, the only way for the Affordable Care Act to drive further income increases in states that have already expanded Medicaid is to have more people become eligible for coverage under the program because their incomes drop. That could push more people into eligibility and compensate for lower earnings from employment. But this kind of income “increase” wouldn’t exactly be good news for low-income households.
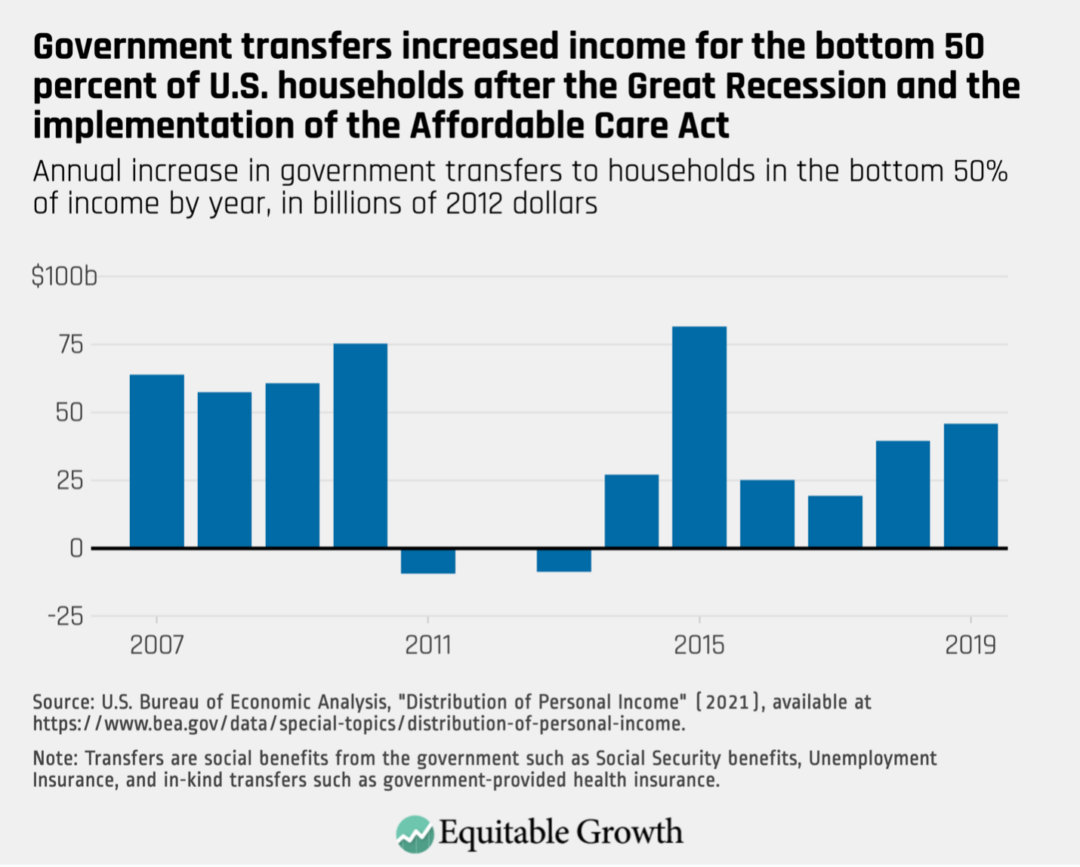
A similar situation played out in the years between the Great Recession and the implementation of the Affordable Care Act. In the aftermath of the Great Recession, federal economic stimulus and falling wages led to rising transfer income for low-income U.S. households. But by 2011, these additional transfers dried up, and these households started to receive lower transfer payments each year. In 2014, the Affordable Care Act started to provide significant boosts that continued into 2019 as states opted into Medicaid expansion. These dynamics added to the incomes for bottom 50 percent of households from 2007 to 2019. (See Figure 3.)
Figure 3
Wealth inequality has leveled off
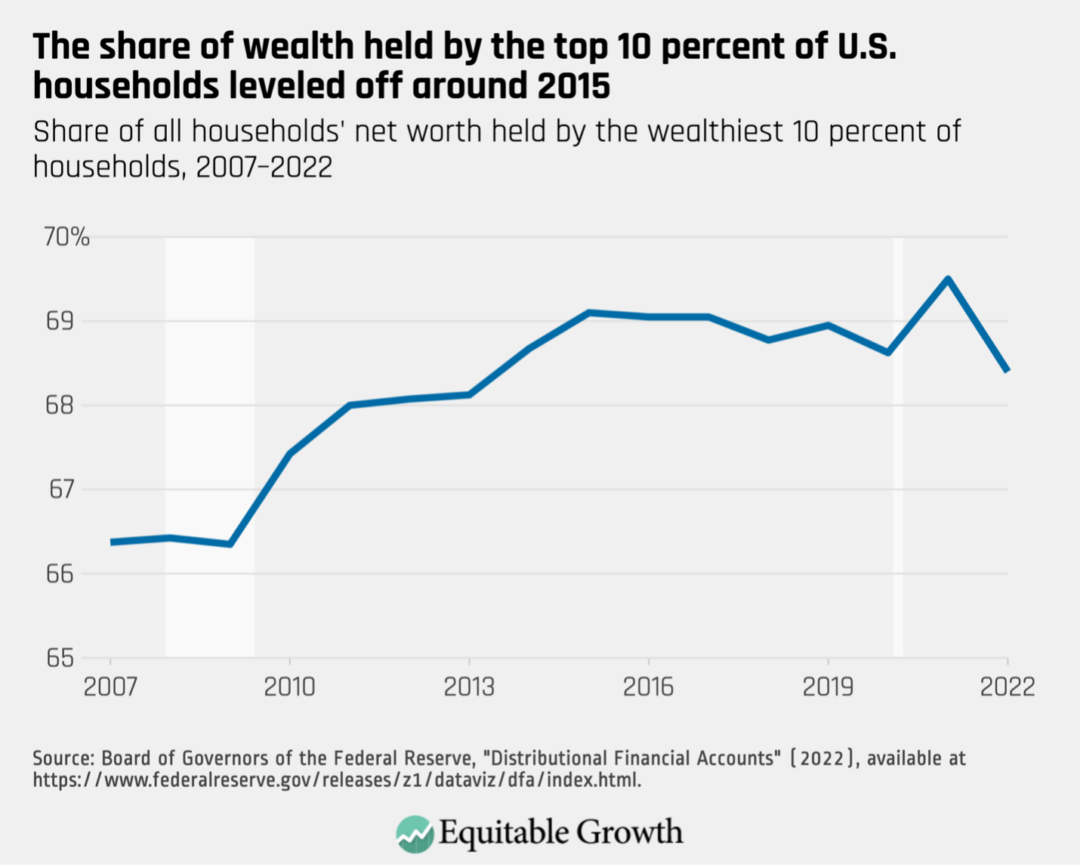
Finally, I took a quick look at wealth inequality in this period using the Federal Reserve’s Distributional Financial Accounts. Last year, the Federal Reserve fielded its triennial Survey of Consumer Finances. The results from that survey won’t be available until September of this year, but the Distributional Financial Accounts provide a reasonable estimate in the meantime. According to the DFA data, the share of wealth held by the wealthiest 10 percent of U.S. households increased from just more than 66 percent in 2007 to about 69 percent in 2015, and has dropped moderately since then, following a similar trajectory as income inequality. (See Figure 4.)
Figure 4
It’s probably too early to read much into the 2021 and 2022 data as wealth tends to be volatile for high-wealth households around economic recessions. Still, it’s encouraging that wealth concentration at least appears to have stalled out starting in 2015. That suggests that increased parity in income growth is also leading to more parity in wealth growth.
The trajectory of income and wealth inequality in the United States has changed since 2007. But it’s far too soon to celebrate. Income inequality is down very marginally and remains far from the levels seen in the mid-20th century United States. Moreover, much of the decrease in this inequality was caused by implementation of the Affordable Care Act, which will probably not provide significant income boosts going forward. That makes it possible that decreasing income inequality will not be lasting.
Absent an increase in the federal minimum wage or increased worker power, a tight U.S. labor market will be necessary to prolong the success of the post-2014 U.S. economy in terms of more equitable income growth and thus more sustainable overall economic growth. Likewise, income trends will eventually be reflected in wealth inequality, and absent strong wage growth for low- and middle-income households, the current pause in increasing U.S. wealth inequality may prove fleeting.
Consolidation of markets at the hands of U.S. companies that are actively engaged in mergers and acquisitions raises an important question about the political ramifications of market concentration. Do mergers and acquisitions impact the lobbying clout of these acquisitive firms? A new working paper delves into this connection and finds some intriguing, if also preliminary, affirmative evidence.
“Political Power and Market Power,” by Bo Cowgill and Andrea Prat at Columbia Business School and Tommaso Valletti at the Imperial College Business School, documents a positive association between mergers and lobbying activities, and finds some evidence for a positive association of mergers with political campaign contributions. These findings and the economic model the co-authors employ in their research are not robust enough, as is, for U.S. antitrust enforcers to measure these connections between political power and market concentration quantitatively, though the findings advance conceptional frameworks for better understanding this nexus in the qualitative context of the political economy of the United States.
But first, let’s briefly examine the findings and methodology of the new working paper. Cowgill, Prat, and Valletti develop a model that extends a standard theoretical model of industrial organization and competition to include government regulatory variables. They then use two different empirical approaches to study the relationship between merger data and lobbying spending data. Specifically, they match data from 1999 to 2017 of companies registered with the U.S. Securities and Exchange Commission with data on federal lobbying from the nonprofit data science firm LobbyView, campaign contributions tracked by the nonprofit government transparency organization OpenSecrets, and mergers and acquisitions transactions from the SDC Platinum Financial Securities Data, provided by Refinitiv (formerly Thomson Reuters).
The co-authors find that increases in lobbying spending associated with mergers is modest, at around 22 percent, or around $74,000 to $106,000 per 6-month period of analysis. The increase in campaign contributions is only $4,000 to $10,000 per 6-month period and is not statistically significant in all specifications. But the authors do find that larger mergers and mergers between companies in the same industry are more strongly associated with increased lobbying spending, which is consistent with the idea that the increase in this spending is associated with increased market power.
The topline result of their findings is that mergers and lobbying spending are positively correlated. The stronger correlation observed when mergers occur within a single industry suggests, at a high level, that increased market concentration correlates with increased spending on political influence.
Yet there are some caveats worth noting. First of all, a lot of spending on lobbying activity goes unreported to the IRS. Secondly, this spending often occurs through trade associations. Both of these lobbying dynamics means the data used in “Market Power and Political Power” is far from complete.
A third caveat is that one might expect merged firms with more market power to become better at exerting political influence outside of traditional lobbying. This is particularly relevant when attempting to measure the impact of mergers and lobbying in legislative outcomes, where the spend on lobbying may not reflect effective political clout.
Nonetheless, Cowgill, Prat, and Valletti advance ways in which economists and political scientists alike can examine the connection between market power and political power in the United States. How does rising market concentration directly affect consumers through market power—potentially raising prices and reducing output—but also indirectly, through the increased political influence of merged firms and these firms’ abilities to influence regulations governing their operations?
Indeed, this new working paper is a strong theoretical first step in understanding the nexus between political power and rising market concentration due to mergers and acquisitions. Of particular interest is a new unit of analysis the co-authors develop called a composite firm, or a cluster of multiple firms that eventually merge together by the end of the data analysis period. This is a potentially useful tool for future study of the impacts of mergers over time.
Importantly, though, economists and political scientists are not limited to looking at political influence in antitrust analysis through quantitative economic tools alone. Quantitative modeling is a critical part of merger analysis, but federal antitrust enforcers at the Federal Trade Commission and the Antitrust Division of the U.S. Department of Justice do not need to rely solely on quantitative economics in assessing merger impacts. Qualitative evidence is equally important, as several authors note in Equitable Growth’s most recent book, Judging Big Tech: Insights on applying antitrust laws in digital markets.
“I believe deeply in Equitable Growth’s mission to advance evidence-backed ideas and policies on how rising inequality affects economic growth and stability,” Strom said. “I have felt lucky to work with Equitable Growth’s amazing staff over the past few months and am excited to accept the permanent position as president and CEO and lead this organization into its next chapter.”
“I can think of no one better positioned to run the Washington Center for Equitable Growth at this critical moment than Shayna Strom,” said Equitable Growth board chair Steve Daetz. “Her decades of experience working in government, philanthropy, academia, and nonprofits, combined with her intellect and leadership skills, make her uniquely equipped to run the organization. I look forward to this new era at Equitable Growth under Shayna’s capable hands.”
“As the economy continues to recover from the pandemic, it is essential that policymakers make long-overdue investments in workers, children, and families,” said Hilary Hoynes, professor of public policy and economics at the University of California, Berkeley, and Equitable Growth Steering Committee member. “The research shows those investments will have a positive long-term effect on the macroeconomy, leading to broadly shared growth. Equitable Growth plays a key role in getting that research into the right hands, and Shayna is well-suited to bring that economic evidence to bear.”
“When we created Equitable Growth in 2013, we set out to bridge the worlds of academia and policymaking in Washington, to show how rising inequality affects economic growth,” said Alan Blinder, professor of economics and public affairs at Princeton University, and Equitable Growth Steering Committee member. “That mission remains as relevant as ever, and Shayna has the intellect and experience needed to lead one of the most influential economic think tanks in Washington.”
Prior to Equitable Growth, Strom served on the Biden-Harris transition team and was the chief deputy national political director at the American Civil Liberties Union, where she helped launch a 75-person department focused on policy, issue campaigns, and grassroots organizing.
Strom held several roles within the Obama-Biden administration, including as an adviser to the head of the White House Office of Management and Budget and as chief of staff and senior counselor at the White House Office of Information and Regulatory Affairs, where she negotiated the policy and politics of many of President Barack Obama’s high-profile regulations. Strom has also taught at Johns Hopkins University, Sarah Lawrence College, and the Biden Institute at the University of Delaware. Her full bio is available here.
Strom takes the helm as president and CEO of the Washington Center for Equitable Growth effective today.
###
The Washington Center for Equitable Growth is a nonprofit research and grantmaking organization dedicated to advancing evidence-backed ideas and policies that promote strong, stable, and broad-based economic growth. For more information, see www.equitablegrowth.org and follow us on Twitter and Facebook @equitablegrowth.
Yesterday was the third and final day of the 2023 annual meeting of the Allied Social Science Associations, which is organized by the American Economic Association. The 3-day conference, held in person in New Orleans this year, features hundreds of sessions covering a wide variety of economics and other social science research. This year, Equitable Growth’s grantee network, Steering Committee, and Research Advisory Board and their research were well-represented throughout the program, featured in more than 80 different sessions of the conference.
Below are abstracts from some of the papers and presentations that caught the attention of Equitable Growth staff during the third day of this year’s conference and which relate to the research interests laid out in our current Request for Proposals. We also include links to the sessions in which the papers were presented.
Click here to review the highlights from day one, and here for highlights from day two.
Tania Babina, Columbia University; Simcha Barkai, Boston College, Equitable Growth grantee; Jessica Jeffers, University of Chicago; Ezra Karger, Federal Reserve Bank of Chicago, Equitable Growth grantee; Ekaterina Volkova, University of Melbourne
Abstract: We construct a comprehensive dataset of antitrust lawsuits led by the U.S. Department of Justice between 1980 and 2018 that includes the geographic scope and industries of the targeted companies. We find a continued secular decline in the number of antitrust lawsuits led by the department relative to the early 1980s, with wide variation across industries. We use this new dataset to study the systematic effect of antitrust lawsuits on industry dynamics such as employment growth and firm entry. We compare outcomes in a nontradable industry located in a particular state that is the target of a DOJ lawsuit with the same nontradable industry located in other states. In an event-study framework, we find that employment is stable in the years leading up to an antitrust lawsuit but increases in the years immediately following the lawsuit. The effect is stronger for local lawsuits and lawsuits remedying older violations. Our results suggest that antitrust enforcement has an important role in curbing anticompetitive behavior by firms and has a positive effect on aggregate outcomes.
Abstract: Amazon acts as both a platform operator and seller on its platform, designing rich fee policies and offering some products direct to consumers. This flexibility may improve welfare by increasing fee discrimination and reducing double marginalization but may decrease welfare due to incentives to foreclose rivals and raise their costs. This paper develops and estimates an equilibrium model of Amazon’s retail platform to study these offsetting effects and their implications for regulation. The analysis yields four main results: (i) Optimal regulation is product- and platform-specific. Interventions that increase welfare in some categories, decrease welfare in others. (ii) Fee instruments are substitutes from the perspective of the platform. Interventions that ban individual instruments may be offset by the endogenous response of (existing and potentially new) instruments. (iii) Regulatory interventions have important distributional effects across platform participants. (iv) Consumers value both the Prime program and product variety. Interventions that eliminate either of the two decrease consumer, as well as total, welfare. By contrast, interventions that preserve Prime and product variety but increase competition—such as increasing competition in fulfillment services—may increase welfare.
Note: This research was funded in part by Equitable Growth.
Abstract: This paper examines the 2021 temporary expansion of the Child Tax Credit that provided monthly payments to families with children from July 2021 to December 2021. We investigate trends in who received the monthly benefit, who did not, and how they spent the credit. Finally, using a parameterized difference-in-differences approach, we examine the effect of the monthly credit on material hardship among a sample of parents with very low incomes. Overall, approximately two-thirds of eligible families with low incomes reported receiving the monthly Child Tax Credit. Employed individuals and individuals with at least $500 of earnings were more likely to report receiving the monthly benefit, while Hispanic families and those who did not file taxes were least likely to receive the benefit. Overall, families report spending the credit to pay down bills, purchase school supplies, and purchase other necessities. These purchases led to lower reports of material hardship, particularly food insecurity.
Note: This research was funded in part by Equitable Growth.
Asger Andersen, University of Copenhagen; Emil Toft Hansen, University of Copenhagen; Kilian Huber, University of Chicago, Equitable Growth grantee; Niels Johannesen, University of Copenhagen; Ludwig Straub, Harvard University, Equitable Growth grantee
Abstract: We develop a system of disaggregated economic accounts, capturing the complex network of income and consumption linkages between spatially and sectorally differentiated units of households and firms. We measure disaggregated accounts on the basis of 2,400 household cells and 2,000 firm cells using administrative register data matched with detailed bank transactions data from Denmark. Mapping the disaggregated accounts into a Keynesian business cycle model with many agents and firms, we study (a) the origins of the Great Recession in Denmark; (b) the geography and sectoral breakdown of fiscal multipliers and their dependence on the nature of the shock; (c) employment-maximizing and welfare-maximizing policies.
Note: This research was funded in part by Equitable Growth.
Erik Hurst, University of Chicago; Yona Rubinstein, London School of Economics; Kazuatsu Shimizu, Massachusetts Institute of Technology
Abstract: In this paper, we develop a task-based model of occupational choice to identify and quantify the effect of discrimination and aggregate task prices on the Black-White wage gap over time. At the heart of our framework is the idea that the size and nature of racial barriers faced by Black workers varies by the task requirements of each job. We define a new task that measures the extent to which individuals interact with others as part of their job. Using both the structure of our model, detailed micro data from the Census/ACS and the NLSY, and regional variation in survey-based discrimination measures, we highlight that the racial gap in this new task measure is a good proxy for the extent of taste-based discrimination in the economy. Our structurally estimated model and reduced form evidence attribute the fast decline in the observed Black-White gap in wages between 1960 and 1990 to a notable drop in labor market taste-based discrimination and attributes the stagnation in the Black-White gap in pay since then to the notable increase in the wage premium to abstract tasks.
Francisco Garrido, Autonomous Technological Institute of Mexico, Equitable Growth grantee; Nathan Miller, Georgetown University, Equitable Growth grantee; Matthew Carl Weinberg, Ohio State University, Equitable Growth grantee
Abstract: This paper explores the pricing behavior of beef packers in the United States. We seek to understand an increase in the gap between the prices packers pay to upstream feedlots and the prices they receive from retailers from 2015–2019. We focus on the role of alternative market arrangements, or AMAs, that are increasingly used to facilitate transactions between feedlots and packers. These are agreements that packers buy a pre-specified number of cattle at a particular date, with prices tied to the average cash market price near the delivery date. This linkage may depress the price paid for cattle. We provide a spatial differentiation model of price setting that features third degree price discrimination and AMAs, and use it to quantify the role of AMAs and multiplant ownership in determining the packer spread.
Gordon B. Dahl, University of California, San Diego, Equitable Growth Working Paper contributor; Matthew Knepper, University of Georgia, Equitable Growth Working Paper contributor
Abstract: Why is workplace sexual harassment chronically underreported? We hypothesize that employers coerce victims into silence through the threat of a retaliatory firing. To test this, we estimate how two external shocks that reduce workers’ outside options—unemployment rate increases and a sharp cut to Unemployment Insurance benefits—affect the selectivity of sexual harassment charges filed with the Equal Employment Opportunity Commission. We find that both shocks increase selectivity, which implies an increase in underreporting. Bolstering these findings, anonymous Google searches for “sexual harassment in the workplace” (total prevalence) spike relative to charges filed (reported prevalence) during the Great Recession.
Luca Perdoni, Yale University, Equitable Growth grantee; Disa M. Hynsjö, Yale University, Equitable Growth grantee
Abstract: This paper investigates the causal effects of the Home Owners’ Loan Corporation, or HOLC, maps and the neighborhood grades they assigned to summarize lending risk in the second half of the 1930s. In particular, we estimate the effects of different grades on homeownership rates, property values, and shares of African Americans between 1940 and 2010. To measure the short and long-term effects of the HOLC mapping intervention, we propose a new estimation strategy. Spatial discontinuity designs, often used in the literature on this topic, suffer from endogeneity concerns: Multiple authors documented socioeconomic differences on opposite sides of boundaries traced by the agency, indicating that the HOLC did not assign border locations and grades randomly.
Instead, we exploit an exogenous population threshold that determined which cities were mapped and a machine learning algorithm drawing HOLC maps in control cities. Using the grades predicted by the machine learning model, we apply a grouped difference-in-differences design to measure the causal effects of the HOLC intervention. The causal effects are identified by differences between neighborhoods in treated cities and areas in control cities that would have received the same grade but were not mapped. This empirical strategy is possible thanks to a new spatial dataset we constructed geocoding full-count Census records between 1910 and 1940.
For the year 1940, we find a substantial reduction in property values and homeownership rates in areas with the lowest grade, along with an increase in the share of African American residents. We also find sizable house value reductions in the second-to-lowest grade areas.
Such negative effects on property values persisted until the early 1980s. Our results illustrate that institutional practices can coordinate individual discriminatory choices and amplify their consequences.
Note: This research was funded in part by Equitable Growth.
Ashley Swanson, University of Wisconsin-Madison, National Bureau of Economic Research;
Zack Cooper, Yale University, National Bureau of Economic Research; Stuart Craig, Yale University; Matthew Grennan, University of California, Berkeley; Joseph Martinez, University of Pennsylvania; Fiona Scott Morton, Yale University, Equitable Growth grantee and contributing author
Abstract: In recent decades, vertical integration between hospital systems and physicians has transformed U.S. provider markets. During 2008–2016, the fraction of physicians employed by hospitals increased from 27 percent to 47 percent. Nearly all hospital-physician mergers were below antitrust reporting thresholds and were likely completed without regulatory scrutiny. We combine a new comprehensive measure of vertical integration with administrative claims data from a large U.S. commercial health insurer. Our results for orthopedic surgeons indicate that post-vertical integration, the average physician increased surgeries performed at acquiring hospitals by nearly 20 percentage points. Moreover, physician and facility prices increased by about 5 percent to 8 percent. We also find positive correlations between hospital price effects and the magnitudes of shifts in patient flows to hospitals, consistent with newly vertically integrated entities foreclosing rivals. Finally, we find positive correlations between physician price effects and pre-merger hospital market shares, consistent with newly vertically integrated entities benefiting from an improved bargaining position.
Vivek Bhattacharya, Northwestern University, Equitable Growth grantee; Gaston Illanes, Northwestern University, Equitable Growth grantee; David Stillerman, American University
Abstract: Households often fail to refinance mortgages. We document the price and quantity effects of all U.S. retail mergers from 2006–2017 associated with deals larger than $340 million. Prices increase by 0.49 percent on average for merging parties, with an interquartile range of almost 5 percent. Nonmerging parties exhibit slightly smaller price changes on average. Price changes are correlated with changes in concentration but not final concentration, and they tend to be concentrated in the year following the merger. Mergers that were unsuccessfully challenged exhibit larger price increases. Through the lens of a simple model, we estimate that agency preferences are such that they aim to block mergers where prices are expected to increase by more than 3.7 percent and 5.6 percent overall, or about 8.1 percent to 8.8 percent for merging parties.
John Asker, University of California, Los Angeles; Allan Collard-Wexler, Duke University; Jan de Loecker, KU Leuven
Abstract: We provide an empirical framework to measure the welfare impact of market power that materializes through coordination of production (i.e., cartel) in the global crude oil market. We leverage unique microdata on cost and production to quantify the dead weight loss and productivity inefficiency due to the OPEC cartel. We introduce a framework that recognizes the likely intertemporal trade-off that producers face when setting production levels. We rely on an estimated demand system for oil, and we consider a range of counterfactual oil supply functions to quantify the welfare loss due to market power. The counterfactual supply curves imply counterfactual price paths that suggest a sizeable impact of market power on the global oil market. This, together with the information on field-level costs, allows for a model-consistent notion of lost gains from trade due to market power. We find that the welfare impact is large, implying a worldwide revenue tax (on every aspect of economic activity) of about 0.15 percent, or put differently about $5 trillion (in 2014).
Yesterday was the second day of the 2023 annual meeting of the Allied Social Science Associations, which is organized by the American Economic Association. The 3-day conference, held in person in New Orleans this year, features hundreds of sessions covering a wide variety of economics and other social science research. This year, Equitable Growth’s grantee network, Steering Committee, and Research Advisory Board and their research are well-represented throughout the program, featured in more than 80 different sessions of the conference.
Below are abstracts from some of the papers and presentations that caught the attention of Equitable Growth staff during the second day of this year’s conference and which relate to the research interests laid out in our current Request for Proposals. We also include links to the sessions in which the papers were presented.
Come back tomorrow morning for more highlights from day three, and click here to review the highlights from day one.
Ashvin Gandhi, University of California, Los Angeles, Equitable Growth grantee; Krista Ruffini, Georgetown University, Equitable Growth grantee
Abstract: This paper examines how minimum wages change the types of workers that firms employ and the allocation of hours across these workers. We leverage shift-level data for the universe of nursing home employees matched to more than 300 state, county, and city minimum wage changes between 2016 and 2019. We find that higher minimum wages shift the allocation of hours toward workers with high levels of firm-specific experience, driven by greater retention among the most experienced workers. We use our reduced-form estimates to simulate the long-term effect of a \$1 increase in the minimum wage and find such a reform would increase the share of hours worked by employees with more than 1 year of full-time employment by 14 percent.
Note: This research was funded in part by Equitable Growth.
Nirupama L. Rao, University of Michigan, Equitable Growth grantee; Max Risch, Carnegie Mellon University, Equitable Growth grantee
Abstract: Using new data matching the universe of U.S. tax returns of pass-through firms and their workers over a 15-year period, we examine the impact of higher state minimum wages on small and medium-sized businesses. We find that small firms incur significant wage bill increases when minimum wages are raised. Higher minimum wages do not, however, increase the exit rate of small firms or pass-through firms overall. Instead, pass-through entities accommodate higher minimum wages through higher revenue. For small firms, these revenue increases outpace wage bill increases, leading to higher average profits in the years after a minimum wage increase. We show that these surprising findings can be rationalized in a framework where smaller firms operate in product markets alongside a larger firm with price-setting power that is more affected by a given cost shock, as is the case with minimum wages. Our findings highlight the importance of understanding the heterogeneous impacts of wage floors on firms of different sizes and how product market dynamics affect the eventual incidence of these policies.
Note: This research was funded in part by Equitable Growth.
Corina Boar, New York University; Virgiliu Midrigan, New York University
Abstract: We characterize optimal product market policy in an unequal economy in which firm ownership is concentrated and mark-ups increase with firm market shares. We study the problem of a utilitarian regulator who designs revenue-neutral interventions in the product market. We show that optimal policy increases product market concentration. This is because policies that encourage larger producers to expand improve allocative efficiency and increase the labor share and the equilibrium wage. We derive these results both in a static Mirrleesian setting, in which we impose no constraints on the shape of interventions, as well as in a dynamic economy with capital and wealth accumulation. In our dynamic economy, optimal policy reduces wealth and income inequality by redistributing market share and profits from medium-sized businesses, which are primarily owned by relatively rich entrepreneurs, to larger, diversified corporate firms.
Santiago Deambrosi, Princeton University; Cameron Deal, Vanderbilt University
Abstract: We study the intergenerational mobility rates of LGBTQ+ individuals in their prime age, utilizing data from various nationally representative surveys, including the NLSY Child and Young Adult, NLSY97, the PSID, and AddHealth. We report the existence of a LGBTQ+ mobility gap in the United States, shaped primarily by the outcomes of LGBTQ+ individuals born to lower-income parents. While a mobility gap exists for most LGBTQ+ individuals, those born to parents in the top of the income distribution are mostly shielded from this disadvantage.
While part of this gap can be explained by discrimination and household specialization, we go beyond these commonly studied factors and ask how norms and attitudes during childhood impact the later-life economic opportunities of LGBTQ+ individuals. Using data from multiple sources, we construct an index that captures changing LGBTQ+ attitudes at small regional levels since the 1990s. As general norms and attitudes change over time and families move across areas, we exploit the longitudinal and sibling-linkage aspects of our data to causally study how exposure to these factors during childhood impact the later-life outcomes of these individuals. We then interact these statistics with the Opportunity Atlas data to create an “opportunity atlas” for LGBTQ+ individuals.
Daron Acemoglu, Massachusetts Institute of Technology; Gary Anderson, National Center for Science and Engineering Statistics; David Beede, U.S. Census Bureau; Catherine Buffington, U.S. Census Bureau; Pascual Restrepo, Boston University; Eric Childress, George Mason University; Emin Dinlersoz, U.S. Census Bureau; Lucia Foster, U.S. Census Bureau; Nathan Goldschlag, U.S. Census Bureau; John Haltiwanger, University of Maryland; Zachary Kroff, U.S. Census Bureau; Nikolas Zolas, U.S. Census Bureau
Abstract: This paper provides a comprehensive description of the adoption of automation technologies by U.S. firms across all economic sectors by leveraging a new technology module introduced in the Census Bureau’s 2019 Annual Business Survey. The module collects data from more than 300,000 firms on the use of five advanced technologies: artificial intelligence, robotics, dedicated equipment, specialized software, and cloud computing. We document that the adoption of these technologies remains low (especially for AI and robotics), varies substantially across industries, and concentrates on large and younger firms.
However, because larger firms are much more likely to adopt them, 12 percent to 64 percent of U.S. workers, and 22 percent to 72 percent of manufacturing workers, are exposed to these technologies. Firms report a variety of motivations for adoption, including automating tasks previously performed by labor. Consistent with the use of these technologies for automation, adopters have higher wages and lower labor shares. The use of these technologies is associated with a 15 percent increase in labor productivity, which accounts for 20 percent to 30 percent of the higher labor productivity achieved by the largest firms in an industry. Adopters report that these technologies raised skill requirements and led to greater demand for skilled labor but brought limited or ambiguous effects to their employment levels.
Ellora Derenoncourt, Princeton University, Equitable Growth grantee and contributing author; Chi Hyun Kim, University of Bonn, Equitable Growth Working Paper contributor; Moritz Kuhn, University of Bonn, Equitable Growth Working Paper contributor; Moritz Schularick, University of Bonn, Equitable Growth Working Paper contributor
Abstract: The racial wealth gap is the largest of the economic disparities between Black and White Americans, with a White-to-Black per-capita wealth ratio of 6-to-1. It is also among the most persistent. In this paper, we combine data and theory to illustrate the role of historical institutions, capital returns, income trends, and savings behavior in the level and persistence of the gap. We introduce a new time series of White-to-Black per-capita wealth ratios covering 1860 to 2020 that draw on census data, historical state tax records, and a newly harmonized version of the Survey of Consumer Finances (1949–2019), among other sources. Combining these data with a parsimonious framework of wealth accumulation by each racial group, we show that, given vastly unequal starting conditions under slavery, racial wealth convergence is an extremely distant scenario even if wealth-accumulating conditions were equal for the two groups post-Emancipation. We find that observed convergence has followed a slower path relative to this equal conditions benchmark, and today’s wealth gap is on track to diverge, rather than converge, due to overall rising wealth inequality. Our framework sheds light on the implications of policies such as reparations, which address the historical origins of today’s gap, versus less targeted policies for the future evolution of the wealth gap.
Henrik Kleven, Princeton University, National Bureau of Economic Research
Abstract: This paper develops a new approach to estimating child penalties based on cross-sectional data and pseudo-event studies around childbirth. Data from the United States show that child penalties can be accurately estimated using cross-sectional data, which are widely available and give more statistical power than typical panel datasets. Five main empirical findings are presented. First, U.S. child penalties have declined significantly over the past five decades, but almost all of this decline occurred during the earlier part of the period, explaining the slowdown of gender convergence during this period. Second, child penalties vary enormously over space—e.g., from 12 percent in the Dakotas to 38 percent in Utah. Third, child penalties correlate strongly with measures of gender norms, both across space and over time. Fourth, an epidemiological study of gender norms using U.S.-born movers and foreign-born immigrants shows that the child penalty for U.S. movers is strongly related to the child penalty in their state of birth, adjusting for selection in their state of residence. Parents born in high-penalty states (such as Utah or Idaho) have much larger child penalties than those born in low-penalty states (such as the Dakotas or Rhode Island), conditional on where they live. Finally, immigrants assimilate to U.S. culture over time such that differences by country of origin eventually disappear.
Matthew Smith, U.S. Department of the Treasury; Owen Michael Zidar, Princeton University, Equitable Growth grantee and contributing author; Eric Zwick, University of Chicago, Equitable Growth contributing author
Abstract: We present new estimates of the concentration and composition of top wealth in the United States through 2016. Our wealth estimates are based on new data that link people to their sources of capital income and new methods to estimate the degree of return heterogeneity within asset classes. Relative to an equal returns approach, we find a larger role for private business wealth and a smaller role for fixed income wealth. Given the importance of business ownership for top income and wealth inequality, we turn to exploring the determinants of entrepreneurship across the U.S. population since the late 1990s. Our longitudinal data permit an analysis of which new firms end up being highly successful, allowing us to distinguish start-ups that are destined to remain as small businesses from star job creators. We also develop a novel measure of the returns to founding owners using a high-dimensional matching strategy, which tracks total income and wealth in the decade following entrepreneurial entry, relative to that for a similar matched worker.
We first document new facts on the life cycle of star entrepreneurs, including their family backgrounds, where they grew up, and their labor market trajectories prior to entry. We then develop multiple research designs to evaluate the role of alternative mechanisms that might account for different entry rates and returns across groups. Our results support the class of explanations that highlight “pipeline” factors as the key supply-side constraints on the number of entrepreneurs from underrepresented groups, such as women or low-income kids. Such factors limit the number of potential entrepreneurs who might be responsive to later-stage interventions. For example, policies that target the point of entry, such as liquidity support or tax incentives, are unlikely to close entry gaps and narrow return differences.
Jonathan Colmer, University of Virginia, Equitable Growth grantee; John Voorheis, U.S. Census Bureau, Equitable Growth grantee; Brennan Williams, University of Virginia, Equitable Growth grantee
Abstract: Neighborhoods are an important determinant of economic opportunity in the United States. Less clear is how neighborhoods affect economic opportunity. Here, we provide early evidence on the importance of environmental quality in shaping economic opportunity. Combining 36 years of satellite-derived PM2.5 concentrations measured over roughly 8.6 million grid cells with individual-level administrative data provided by the U.S. Census Bureau and Internal Revenue Service, we first document a new fact: Early-life exposure to particulate matter is one of the top five predictors of upward mobility in the United States.
Next, using regulation-induced reductions in prenatal pollution exposure following the 1990 Clean Air Act amendments, we estimate significant increases in adult earnings and upward mobility. Combined with new individual-level measures of pollution disparities at birth, our estimates can account for up to 20 percent of Black-White earnings gaps and 25 percent of the Black-White gap in upward mobility estimated in Chetty et al. (2018). Combining our estimates with experiment-induced reductions in pollution exposure from the Moving to Opportunity experiment, we can account for 16 percent of the total neighborhood earnings effect estimated in Chetty, Hendren, and Katz (2016). Collectively, these findings suggest that environmental injustice may play a meaningful role in explaining observed patterns of racial economic disparities, income inequality, and economic opportunity in the United States.
Eric Sims, University of Notre Dame; Cynthia Wu, University of Notre Dame; Ji Zhang, Tsinghua University
Abstract: This paper studies the implications of household heterogeneity for the effectiveness of quantitative easing, or QE. We consider a heterogeneous agent New Keynesian, or HANK, model with uninsurable household income risk. Financial intermediaries are subject to an endogenous leverage constraint that allows QE to matter. We find that macro aggregates react very similarly to a QE shock in a HANK model, compared to a representative agent, or RANK, version of the model. This finding is robust across different micro and macro distributions of wealth.
Hyeri Choi, University of Pennsylvania; Ioana Marinescu, University of Pennsylvania, Equitable Growth grantee and contributing author
Abstract: Involuntary part-time employment is a measure of labor market slack that goes beyond the unemployment rate and broadens our understanding of the state of the labor market. Our study examines the determinants of involuntary part-time employment rates by accounting for both supply and demand channels of the labor market. We investigate the role of labor demand by focusing on job vacancies and labor supply by focusing on unemployment. We use big data on the near universe of online job vacancies collected by Burning Glass Technologies and the Current Population Survey from 2003 to 2021. We find that, within the commuting zone by 6-digit SOC cell, a 10 percent increase in unemployment rate increases the share of involuntary part-time rate by 0.22 percentage points, while a 10 percent increase in job vacancies decreases the share of involuntary part-time rate by 0.06 percentage points. Overall, we conclude that higher labor supply and lower labor demand increase involuntary part-time employment. We also provide suggestive evidence that labor market power as measured by labor market concentration may additionally increase involuntary part-time employment. Our study shows that workers are more likely to have their preferred work hours when there are more employers that they can work for.
Anastasia Wilson, Hobart and William Smith Colleges
Abstract: In this paper, I theorize that under the domination of capital, forms of socially reproductive work often take on a carceral logic, rather than one of care. Carceral logics rely on the threat or imposition of punishment to coerce, including coercing work. The family, as well as schools and social services, work to produce and reproduce the worker whose labor is ultimately coerced by capital. Are these forms of socially reproductive work then caring or carceral? To understand this contradiction, I examine the intersection of the waged work of schools and social services, as provisioned by the state, and the unwaged work of the household in the form of the family. By analyzing how carceral systems, such as school and family policing, are enmeshed in such forms of socially reproductive work, I argue that these sites of reproductive work—schools, social services, and the family—interlock under the domination of capital to reproduce gendered and racialized forms of coerced “care” that regulate and reinforce the unwaged work of the family. In tandem, these forms of coerced work reproduce fragmented, gendered, and racialized workers to be exploited by capital. I argue that liberatory ruptures beyond such carceral forms of “care” then require both an abolitionist method and critique of capitalist society.
Erik Brynjolfsson, Stanford University; Catherine Buffington, U.S. Census Bureau; J. Frank Li, Stanford University; Javier Miranda, Halle Institute for Economic Research; Nathan Goldschlag, U.S. Census Bureau; Robert Seamans, New York University
Abstract: In this paper we present results on the distribution of robots in U.S. manufacturing, using new establishment-level microdata collected by the U.S. Census Bureau. We use the data to present a number of facts about the location and use of robots. We find that the distribution of robots is surprisingly skewed across locations, even accounting for the different mix of industry and manufacturing employment across locations. Some locations – which we call “Robot Hubs” – have many more robots than one would expect if distribution of robots was uniform, after accounting for industry and manufacturing employment. We characterize these Robot Hubs along several industry, demographic, and institutional dimensions.
David Autor, Massachusetts Institute of Technology, Equitable Growth grantee and Research Advisory Board member; Caroline M. Chin, Massachusetts Institute of Technology; Anna Salomons, Utrecht University, Equitable Growth grantee; Bryan Seegmiller, Massachusetts Institute of Technology, Equitable Growth grantee
Abstract: Recent theory stresses the role of new job types (“new work”) in counterbalancing the erosive effect of task-displacing automation on labor demand. Drawing on a novel inventory of eight decades of new job titles linked to U.S. Census microdata, we estimate that the majority of contemporary employment is found in new job tasks added since 1940, but that the locus of new task creation has shifted—from middle-paid production and clerical occupations in the first four post-World War II decades, to high-paid professional and, secondarily, low-paid services since 1980. We hypothesize that new tasks emerge in occupations where new innovations complement their outputs (“augmentation”) or market size expands, while conversely, employment contracts in occupations where innovations substitute for labor inputs (“automation”) or market size contracts.
Leveraging proxies for output-augmenting and task-automating innovations built from a century of patent data and harnessing occupational demand shifts stemming from trade and demographic shocks, we show that new occupational tasks emerge in response to both positive demand shifts and augmenting innovations, but not in response to negative demand shifts or automation innovations. We document that the flow of both augmentation and automation innovations is positively correlated across occupations, yet these two faces of innovation have strongly countervailing relationships with occupational labor demand.
Note: This research was funded in part by Equitable Growth.
Daniel Garrett, University of Pennsylvania,Equitable Growth Working Paper contributor; Eric Ohrn, Grinnell College, Equitable Growth grantee; Juan Carlos Suárez Serrato, Duke University, Equitable Growth grantee
Abstract: We study the domestic labor market effects of two historical, but highly applicable, U.S. international tax provisions. The first provision, “Check-the-Box,” or CTB, decreased effective tax rates abroad by increasing the ability of multinational corporations to shift profits to low-tax jurisdictions. The second provision, the 2004 “repatriation holiday,” or RH, decreased the tax costs of repatriating foreign earnings by 85 percent. To study the effects of each provision, we use a difference-in-differences framework that estimates the effect of local exposure to each provision on employment and earnings. According to our preferred specification, CTB resulted in losses of 1.7 million jobs and $64 billion in total labor earnings annually. We find the RH did not have any statistically significant effects on domestic labor markets. These results confirm the long-held, but empirically unsupported, hypothesis that international tax systems have large effects on domestic workers.
Martha Bailey, University of California, Los Angeles, Equitable Growth grantee and contributing author; Vanessa Lang, University of Michigan; Iris Vrioni, University of Michigan; Lea Bart, University of Michigan; Alexa Prettyman, University of California, Los Angeles; Daniel Eisenberg, University of California, Los Angeles; Paula Fomby, University of Michigan; Jennifer Barber, Indiana University; Vanessa Dalton, University of Michigan
Abstract: This paper uses a randomized control trial to examine how subsidies affect the use of contraceptives among low-income women seeking reproductive health care in the United States. Study participants are randomized to receive vouchers which cover the costs of any contraceptive up to a maximum value of 50 percent or 100 percent of a name-brand intrauterine device. We find that women’s choice of contraception is highly sensitive to price, with the elasticity of long-acting reversible contraceptive, or LARC, take-up ranging from -2.3 to -3.4. The findings imply that a U.S. policy eliminating out-of-pocket costs for Title X women would reduce pregnancies by 5.4 percent, birth rates by 3.5 percent, and abortions by 8.1 percent.