U.S. income and wealth inequality are no longer increasing, but a return to the equitable levels of the mid-20th century isn’t likely anytime soon

Five or 6 years ago, economists and pundits frequently debated whether the incomes of low- and middle-class households in the United States were stagnating. I wrote about it, and I think what I said then more or less holds up. Wage growth for these households wasn’t zero, so “stagnant” might be inaccurate in the strict sense, yet wage growth was slow at the bottom of the income ladder—and particularly so in the wake of the Great Recession, which left lower-income workers mired in a poor job market until about 2014.
At the time I wrote that column in 2018, income data from a Congressional Budget Office report was only available through 2015, so the evidence of the effects of a tightening U.S. labor market after that year were only just emerging. Moreover, income growth at the top of the income distribution was much stronger than what other households were experiencing, making “stagnant” a more apt description, relative to those households at the top. And prior to 2014, the vast majority of households underperformed the average as high-income households captured large shares of economic growth.
Now, some economists and analysts are revisiting that debate. Michael Strain of the American Enterprise Institute says that income stagnation was a myth, while the online pundit Matthew Yglesias thinks we should take more note of recent declines in income inequality. I don’t fundamentally disagree with either of these views. Income inequality does appear to have declined slightly between 2007 and 2019, but the pace of that decrease was excruciatingly slow. And while I don’t think income stagnation was a complete myth, strong wage growth from 2014 onward modestly improved the situation for low- and middle-income households up to 2019. Yglesias and Strain stop their analysis in 2019, but economic relief packages during the COVID-19 pandemic and recession significantly decreased inequality to levels we haven’t seen this century. As temporary relief from the government fades, however, those gains will probably prove fleeting.
In this column, I provide additional context on the recent trajectory of wages and income and wealth inequality in the U.S. economy. I use recent data releases from the Congressional Budget Office, which are the data Strain and Yglesias use in their separate analyses, as well as data from the U.S. Bureau of Economic Analysis and the Federal Reserve, to look more closely at these trends. The BEA data series, which I have written about frequently, is an exciting new tool for evaluating how income inequality and economic growth are related in the U.S. economy. It is similar to the Federal Reserve’s Distributional Financial Accounts, which provide a timely view of trajectories in U.S. wealth inequality.
Both Yglesias and Strain are correct to point out the strong wage recovery of the late 2010s and the resulting dip in income inequality metrics. I add three bits of context in this column. First, the decline in inequality since 2007 has been extremely slow. Second, the better part of that decline is attributable to so-called government transfers—programs such as the Child Tax Credit and the Supplemental Nutrition Assistance Program—and the way both the Congressional Budget Office and Bureau of Economic Analysis account for government healthcare spending. Third, in an encouraging sign, wealth inequality was rising through 2015 but has been mostly flat since.
Income inequality is declining really slowly
Both Strain and Yglesias focus on the period from 2007 to 2019, a span of years that begins with the Great Recession. Initially, the Great Recession decreased inequality. Recessions usually take a larger toll, in percentage terms, on higher-income households due to the fall in business revenues and the value of assets, such as stocks and bonds. But shortly after the Great Recession, the stock market and top incomes came surging back, while incomes for most U.S. households languished. It’s the second half of this period, from 2014 to 2019, when the incomes for lower-income households really started to pick up. And this did reduce income inequality.
But economists and pundits alike should have some humility about the pace of that reduction because it was very, very slow. According to CBO estimates, in the 28 years from 1979 to 2007, the share of income held by the highest-income quintile of U.S. households rose from 41.7 percent to 51 percent—a 9.3 percentage point rise (I use the after-tax-and-transfer income measure for all CBO calculations). From 2007 to 2019, that share dropped 2.4 percentage points to 48.6 percent of income earned. That trend would have to continue for another 35 years to get us back to 1979 levels of income inequality.
There’s nothing magical about 1979. It’s simply the year the Congressional Budget Office started its analysis. According to the two economists perhaps most famous for identifying rising income inequality—Thomas Piketty at the Paris School of Economics and Emmanuel Saez at the University of California, Berkeley—income inequality started rising in the early 1970s, based on their own, much longer time series of data, and the more equitable distribution of income in the United States in the mid-20th century won’t return anytime soon.
It’s good to keep in mind that this recent dip in inequality is pretty small, compared to the huge run-up in income inequality experienced over the past 50 years after the prior two decades of equitable income growth and economic growth.
The CBO income measure includes realized capital gains from the sale of assets, such as stocks and bonds and property, which makes its measure of income inequality more volatile than income measures that exclude realized capital gains. It’s therefore important not to infer too much based on arbitrary beginning and end points: 2007 was the highest top quintile share of income ever recorded by the Congressional Budget Office, at 51 percent, and the top quintile share fluctuated quite a bit between 2007 and 2019. If one instead uses a 3-year average around 2007 and 2018 to smooth the volatility in realized capital gains, then the drop in the top quintile share of income is half as large, at just 1.2 percentage points.
The BEA distributing personal income dataset, which excludes realized capital gains, tells a more ambiguous story. Between 2007 and 2019, the agency reports that the share of income held by the top quintile increased, from 47.3 percent to 47.6 percent. The Congressional Budget Office’s top quintile share is probably higher in large part due to their accounting for unrealized capital gains, and this may also account for a significant portion of the drop in top incomes.
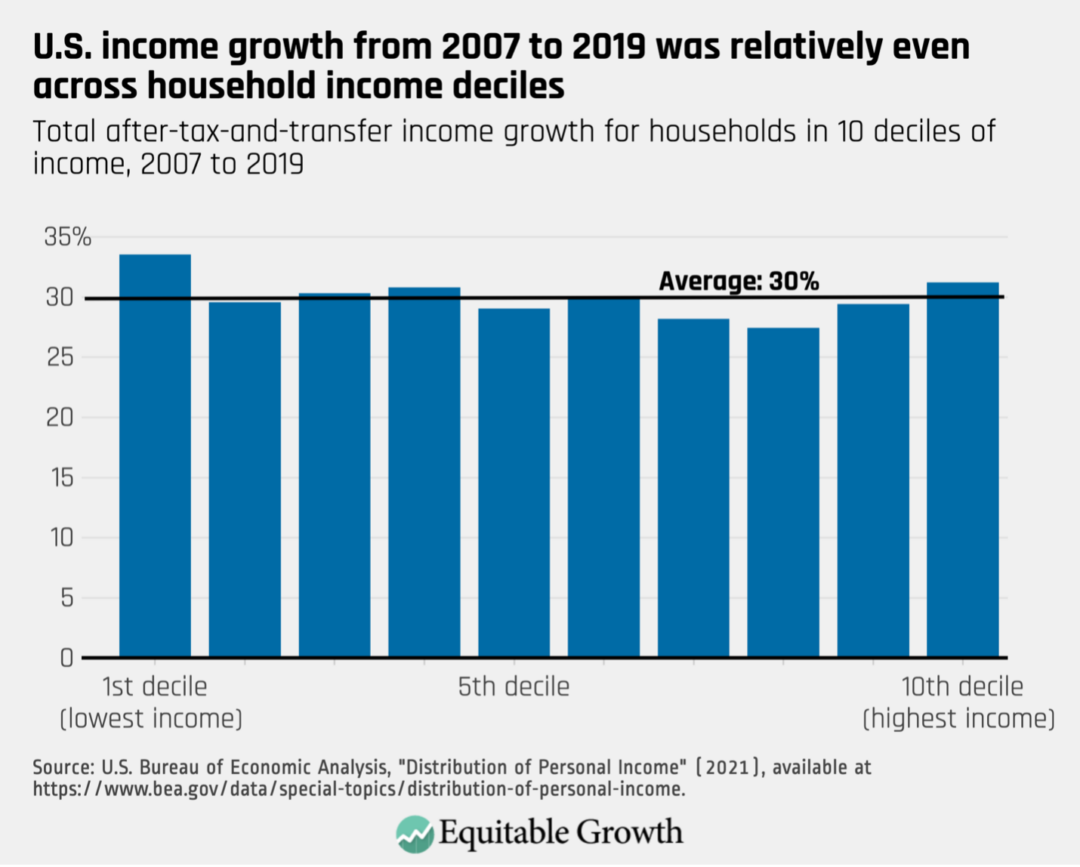
That’s not to say that the Bureau of Economic Analysis finds no reduction in income inequality. According to the agency, the Gini coefficient—a common one-number summary of inequality in an economy, where higher numbers mean more inequality—for after-tax-and-transfer income decreased 2 percent in this period. But that’s not because of losses at the top. Rather, it’s because of some compression in the middle. On average, incomes grew by 30 percent over this 12-year period. The lowest decile of income saw the largest gains, and the top decile saw the second-largest increases. The losers are upper-income households; the eighth decile saw income growth of 27 percent, the lowest among all deciles. (See Figure 1.)
Figure 1
Given these caveats, I’m hesitant to lean into the “inequality is declining” narrative. It might be more accurate for now to say that income inequality has been essentially flat since 2007.
While the CBO dataset currently only runs through 2019, the BEA data runs through 2021, and the story of the COVID-19 pandemic is pretty interesting. The massive increase in government transfers intended to help people weather the pandemic was a game-changer for income inequality. According to BEA data, the Gini coefficient fell almost 8 percent from 2019 to 2021. That’s a huge change for 2 years, and the lowest Gini coefficient in the BEA dataset, which starts in 2000.
That’s impressive, but the transfers that made this drop possible—including the expanded Child Tax Credit, enhanced Unemployment Insurance, and direct stimulus checks—have all expired now, so the Gini coefficient will likely go up again. And it will be a few years from now before the data are available to calculate the long-run impact of the pandemic on income inequality.
Wages increased, but most of the rise for low- and middle-income U.S. households was from government transfers
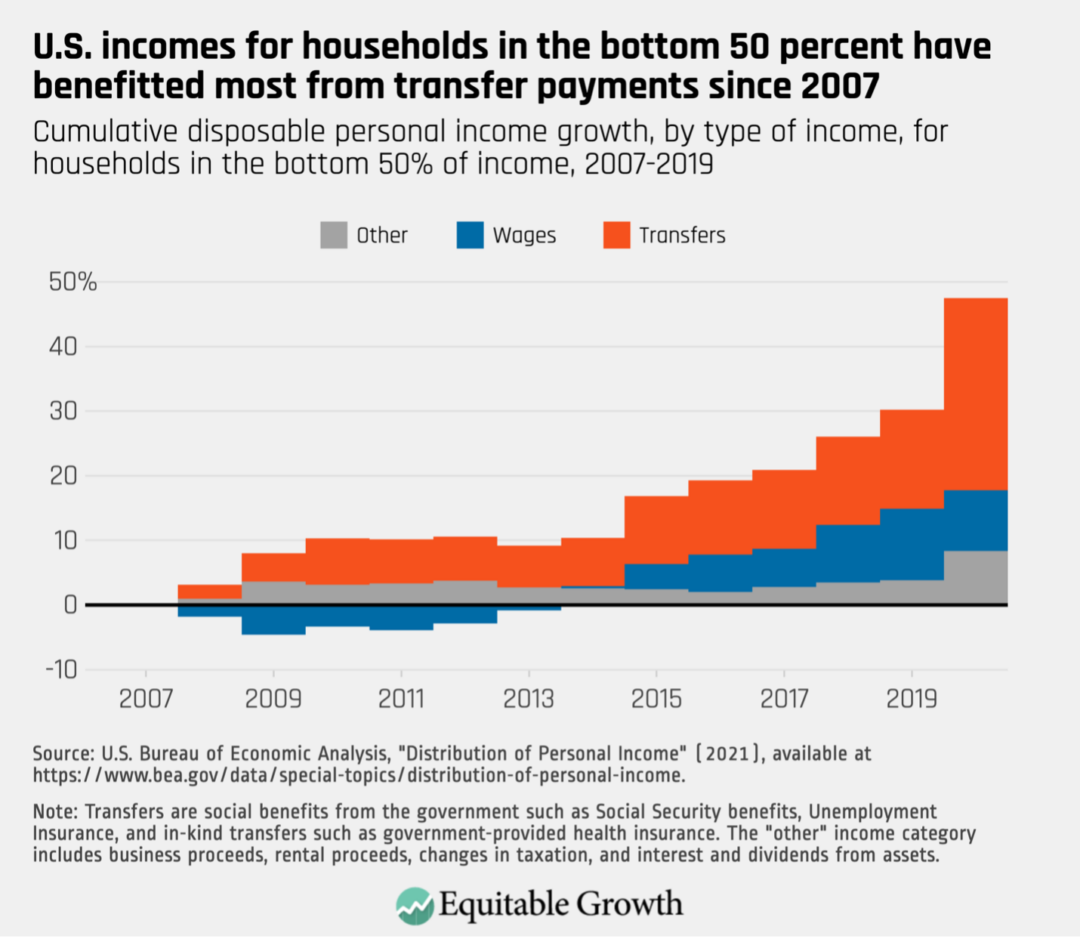
Policy changes during the Obama administration, particularly the Affordable Care Act, led to gradually increasing benefits for low-income U.S. households from 2014 onward, when Obamacare first began to be implemented. In the 2007–2019 window, according to the BEA data, 50 percent of the cumulative increase in income for the bottom 50 of households came from transfers, which includes government-provided healthcare in BEA’s accounting, while 36 percent came from increasing wages, and 14 percent was from other sources, such as business income, rental income, and stock dividends. (See Figure 2.)
Figure 2
In 2020, the percentage of income coming from transfers went up dramatically, thanks to pandemic cash transfer programs. (BEA publishes initial data for 2021 but does not include breakdowns by type of income, so 2020 is the most recent year where income can be decomposed and we can see the impact of transfers.)
The Affordable Care Act boosted in-kind transfer income because both the Congressional Budget Office and the Bureau of Economic Analysis treat government-provided health insurance as income. That is, if a household receives Medicare or Medicaid, several thousand dollars are added to their income to represent the value of that insurance (average per-capita spending on Medicaid enrollees in 2019 was $6,556).
Some economists object to this kind of accounting. Notably, Nobel-Prize winner Angus Deaton at Princeton University objects to valuing the inputs to healthcare instead of the outputs. That is, the amount of money the government spends on providing healthcare to a person doesn’t necessarily correlate to the value that individuals get out of that insurance because the cost and quality of healthcare varies from place to place across the country. Medicare and Medicaid are undoubtedly beneficial to those who receive it. The issue is whether and how to value the money spent on those programs when determining income inequality.
But the main reason to be concerned about a drop in inequality that is driven by in-kind transfers, and the Affordable Care Act in particular, is that it may not be sustainable. The Affordable Care Act started providing most of its benefits in 2014, and its benefits expanded over the years as more states opted into the expansion of Medicaid as part of Obamacare. There are still states that haven’t opted in, so ACA spending might grow and provide further in-kind transfer income to those at the bottom. But in states where Medicaid expansion has already occurred, ACA benefits are already included in income, so that income will stop contributing to CBO-measured income growth (and declining inequality) in those states, and low- or middle-income households will be more dependent on wage increases to raise their incomes.
Paradoxically, the only way for the Affordable Care Act to drive further income increases in states that have already expanded Medicaid is to have more people become eligible for coverage under the program because their incomes drop. That could push more people into eligibility and compensate for lower earnings from employment. But this kind of income “increase” wouldn’t exactly be good news for low-income households.
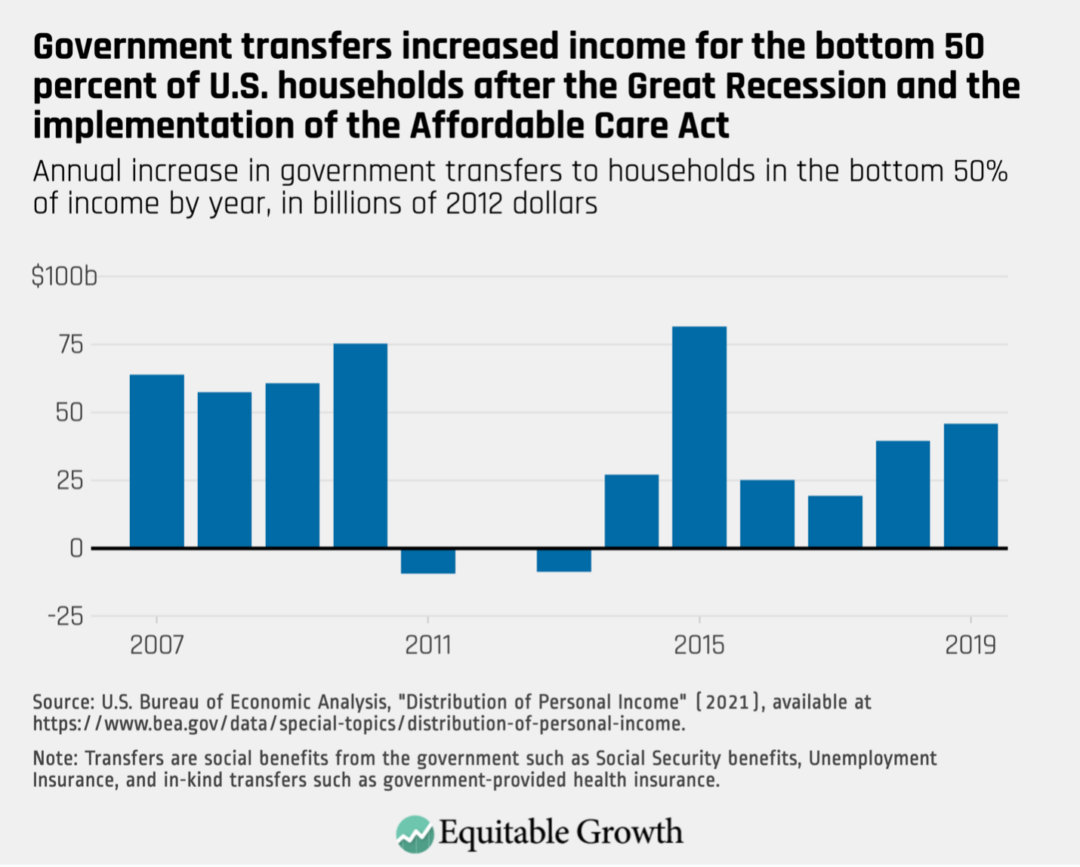
A similar situation played out in the years between the Great Recession and the implementation of the Affordable Care Act. In the aftermath of the Great Recession, federal economic stimulus and falling wages led to rising transfer income for low-income U.S. households. But by 2011, these additional transfers dried up, and these households started to receive lower transfer payments each year. In 2014, the Affordable Care Act started to provide significant boosts that continued into 2019 as states opted into Medicaid expansion. These dynamics added to the incomes for bottom 50 percent of households from 2007 to 2019. (See Figure 3.)
Figure 3
Wealth inequality has leveled off
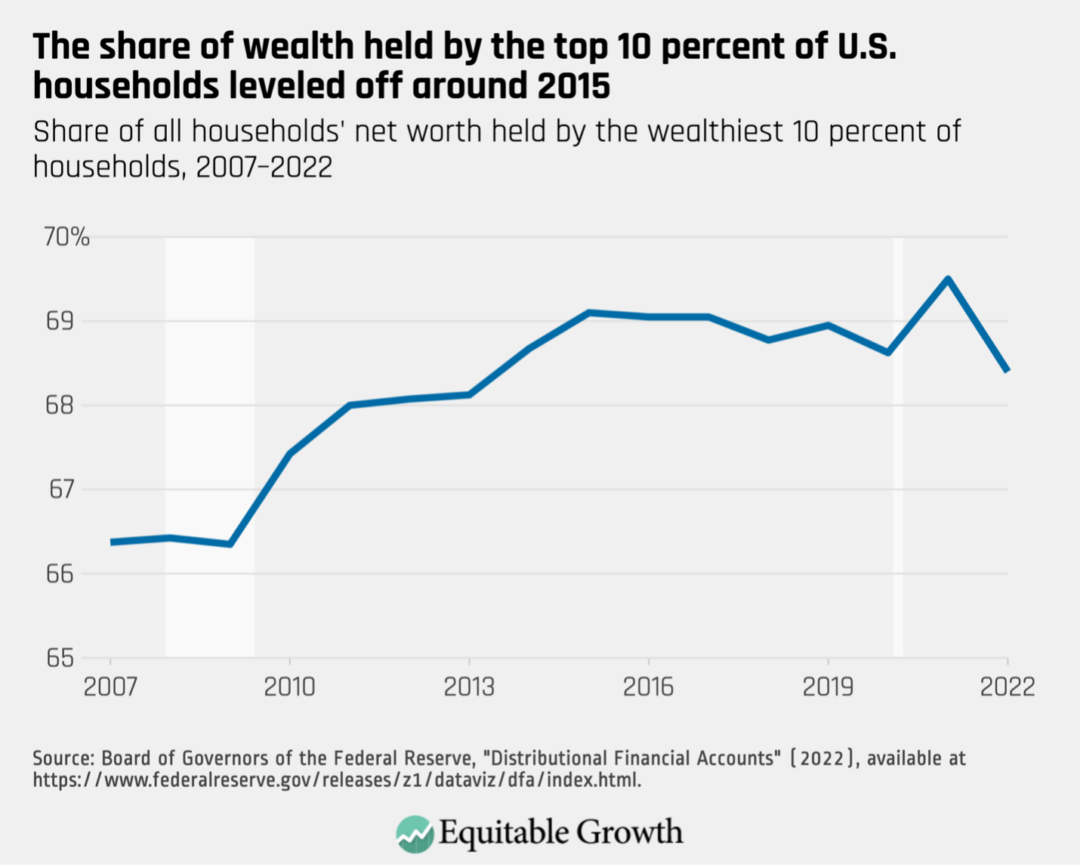
Finally, I took a quick look at wealth inequality in this period using the Federal Reserve’s Distributional Financial Accounts. Last year, the Federal Reserve fielded its triennial Survey of Consumer Finances. The results from that survey won’t be available until September of this year, but the Distributional Financial Accounts provide a reasonable estimate in the meantime. According to the DFA data, the share of wealth held by the wealthiest 10 percent of U.S. households increased from just more than 66 percent in 2007 to about 69 percent in 2015, and has dropped moderately since then, following a similar trajectory as income inequality. (See Figure 4.)
Figure 4
It’s probably too early to read much into the 2021 and 2022 data as wealth tends to be volatile for high-wealth households around economic recessions. Still, it’s encouraging that wealth concentration at least appears to have stalled out starting in 2015. That suggests that increased parity in income growth is also leading to more parity in wealth growth.
Wealth and income inequality don’t have to move together like this. An ongoing debate in economics centers on the extent to which rising wealth inequality is driven by either income inequality or by high-wealth households having access to investments with higher rates of return.
Don’t plan the ticker-tape parade yet
The trajectory of income and wealth inequality in the United States has changed since 2007. But it’s far too soon to celebrate. Income inequality is down very marginally and remains far from the levels seen in the mid-20th century United States. Moreover, much of the decrease in this inequality was caused by implementation of the Affordable Care Act, which will probably not provide significant income boosts going forward. That makes it possible that decreasing income inequality will not be lasting.
Absent an increase in the federal minimum wage or increased worker power, a tight U.S. labor market will be necessary to prolong the success of the post-2014 U.S. economy in terms of more equitable income growth and thus more sustainable overall economic growth. Likewise, income trends will eventually be reflected in wealth inequality, and absent strong wage growth for low- and middle-income households, the current pause in increasing U.S. wealth inequality may prove fleeting.