Every month the U.S. Bureau of Labor Statistics releases data on hiring, firing, and other labor market flows from the Job Openings and Labor Turnover Survey, better known as JOLTS. Today, the BLS released the latest data for January 2022. This report doesn’t get as much attention as the monthly Employment Situation Report, but it contains useful information about the state of the U.S. labor market. Below are a few key graphs using data from the report.
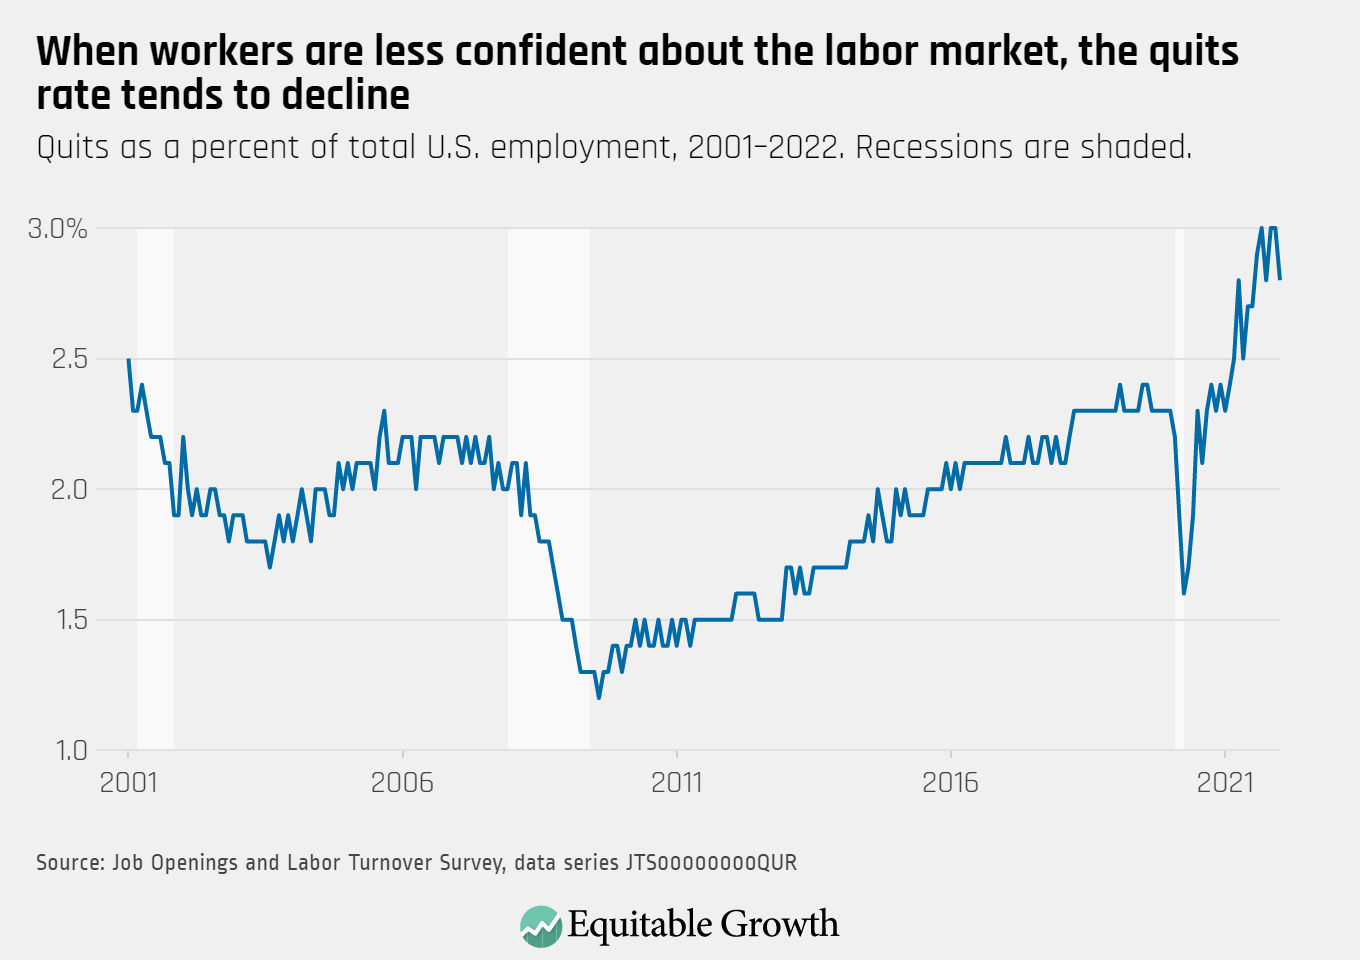
The quits rate fell to 2.8 percent as 4.3 million workers quit their jobs in January, down 151,000 from the previous month.
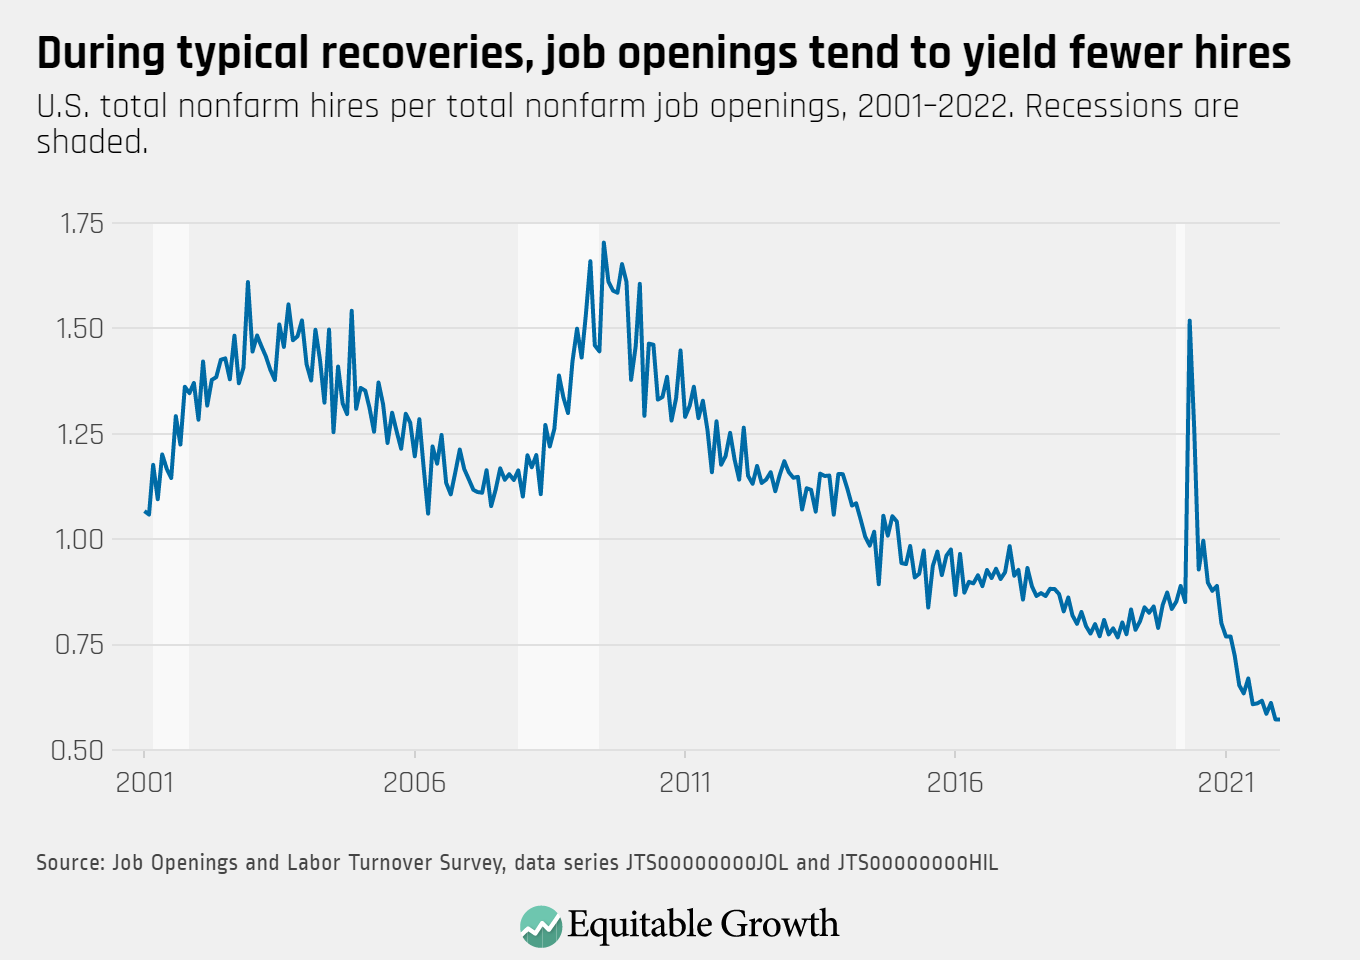
With job openings (11.3 million) and hires (6.5 million) remaining relatively steady, the vacancy yield stayed at 0.57 in January.
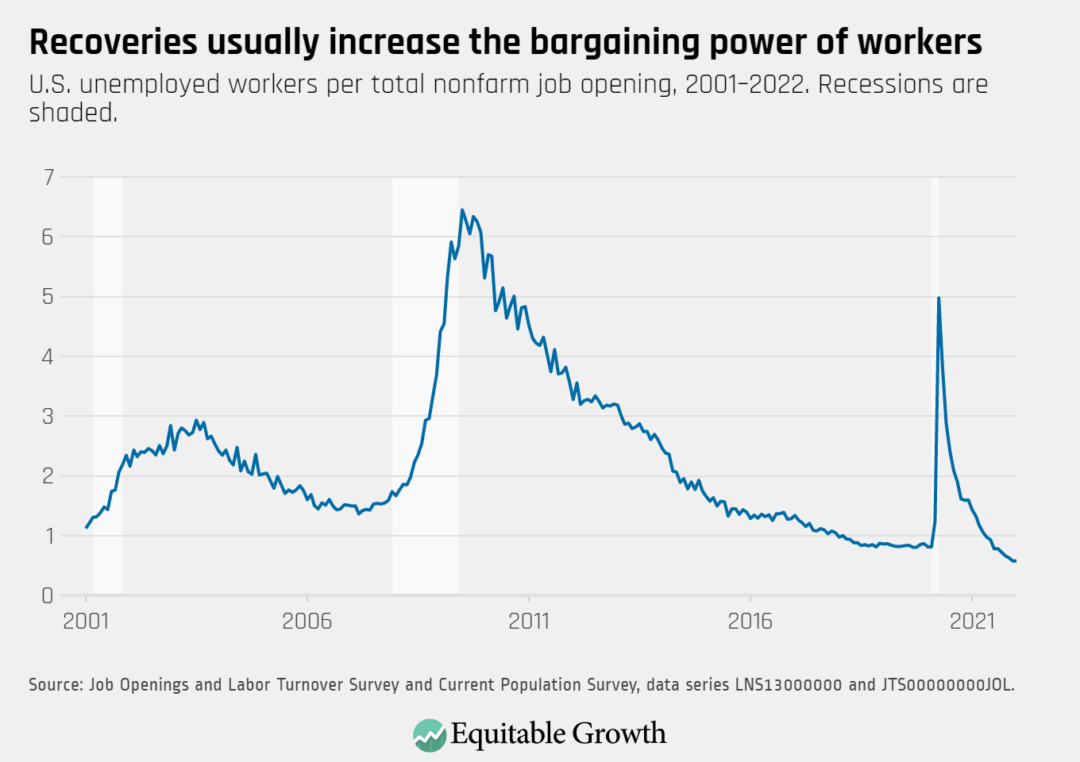
There were 0.57 unemployed workers for every job opening in January, a ratio that was little changed from the previous month.
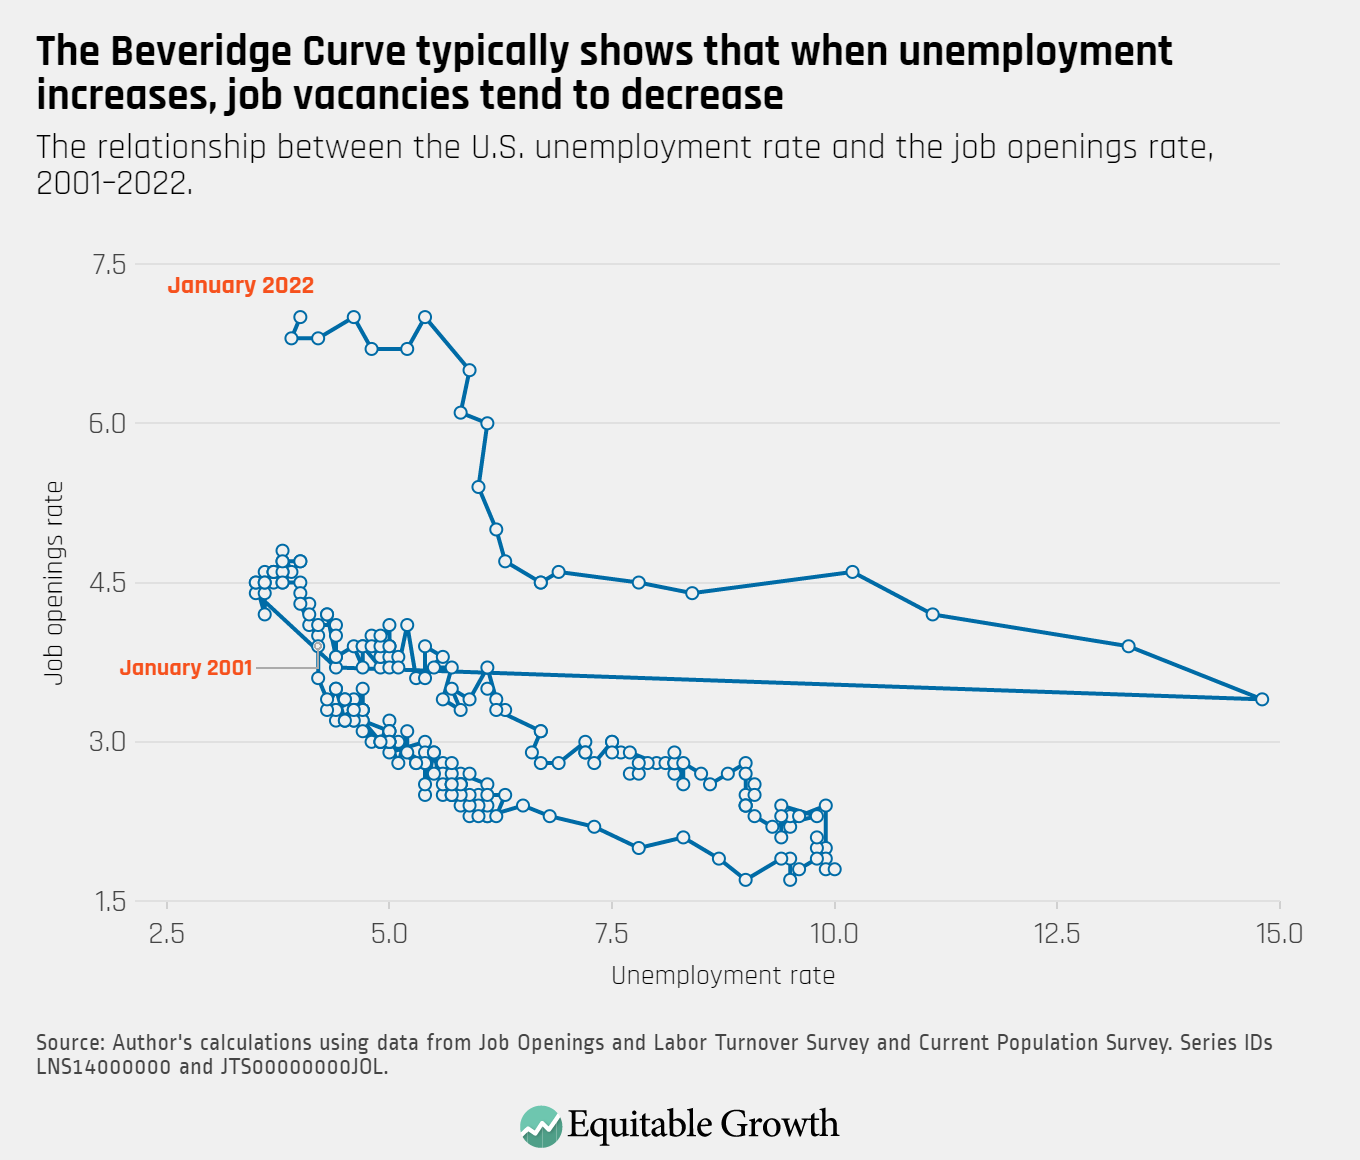
The Beveridge Curve remained in an elevated range in January, reflecting a high job openings rate of 7.0 percent.
Quits rose for some industries in January, including financial activities, education and health, and manufacturing. Meanwhile, quits declined in construction and in leisure & hospitality.
The U.S. labor market faced one of the most severe challenges in recent history with the onset of the coronavirus pandemic in March 2020. In the 2 years since then, the U.S. labor market rebounded at an astonishing pace. Yet despite this record growth, millions of workers were laid off amid the coronavirus recession and are only now beginning to return to workplaces, and millions more continue to experience serious workplace disruptions, from public health restrictions to reduced hours to child and elder care crises and more.
Women workers and workers of color unfortunately bear the brunt of these disruptions, with those who sit at the intersection of these groups—women workers of color—experiencing even worse outcomes. This group of U.S. workers not only struggled more during the pandemic and ensuing recession, but also historically and generally face added challenges arising from discrimination and structural racism and sexism embedded in the U.S. labor market.
We can’t think of a better time than Women’s History Month—which began on March 1 and follows Black History Month in February—to review the research on intersectional wage gaps in the U.S. economy. Below, we revisit some of our more recent coverage of studies examining the impact and implications of gender and racial earnings disparities in the United States, as well as policy ideas to address and close these gaps.
Occupational segregation is defined as a group’s overrepresentation or underrepresentation in certain industries or jobs. This 2020 factsheet covers how occupational segregation contributes to wage penalties and earnings divides in the United States, entrenching inequality and hindering economic well-being for workers.
This 2019 factsheet builds upon the 2018 cornerstone report, “Gender wage inequality: What we know and how we can fix it,” by sociologist Sarah Jane Glynn. The factsheet details the underlying factors behind the gender pay gap in the United States, including occupational segregation and discrimination, and presents a variety of policy solutions that would address this divide.
In this column from 2021, Equitable Growth’s President and CEO Michelle Holder details her research on the wage differentials that Black women workers in the United States face, compared to White men, White women, and Black men in the U.S. labor force. She also discusses testimony she gave to Congress on this double gap—evidence that provided several avenues for policymakers to close these divides.
This 2021 research round-up summarizes a handful of studies that look into pay penalties faced by Black women in the United States. It highlights research from Equitable Growth’s Holder, as well as several other leading economists, who examine various aspects of the structural discrimination that holds back Black women workers in the U.S. labor market.
This 2018 issue brief examines the structural barriers that Latina women face in the U.S. labor market that stem from both gender and racial and ethnic discrimination. The authors calculate the wage divides that Latina workers experience and then disaggregate the results by national origin, immigration history, and education level to get a better understanding of how different groups within the broader Latina community fare. They also review the effects on U.S. labor force participation and overall U.S. economic growth.
Like other women of color, Asian American, Native Hawaiian, and Pacific Islander women face intersectional penalties that arise from structural racial and gender discrimination. Yet little empirical research looks into the challenges AANHPI women face in the U.S. labor market. This issue brief from 2021 studies these wage gaps and breaks them out by subgroups to examine how different AANHPI women come up against different barriers. This issue brief followed a 2021 column that details four ways to understand pay divides faced by AANHPI women.
This 2021 essay—included in Boosting Wages for U.S. Workers in the New Economy, a compilation of 10 essays exploring alternative policies for boosting wages and living standards in the United States—looks at disparities in innovation along race and gender lines. Cook discusses how the lack of diversity in innovation and invention affects the overall economy and proposes several policies that would close the racial and gender divides in U.S. innovation.
This 2020 report debunks the so-called human capital model, which is often used to explain racial and gender pay divides by leaning on alleged differences in productivity stemming from “skills gaps” or differing education levels among groups of workers. The co-authors show that the human capital model does not match the empirical evidence. They then propose that boosting worker power and reducing employer monopsony power would not only decrease worker exploitation but also address wage differentials and discriminatory bias across the U.S. labor market.
While it is not news that women workers of color face added challenges in accessing and navigating the U.S. labor market, the coronavirus pandemic exacerbated the disparities they already experience. This Women’s History Month, policymakers should focus on leveling the playing field for all workers across the United States—particularly those who historically are the most disadvantaged.
The U.S. economy continued its streak of strong month-to-month employment gains, adding 678,000 jobs between mid-January and mid-February. According to data released this morning by the U.S. Bureau of Labor Statistics, the national unemployment rate continued to inch down toward its pre-coronavirus recession level of 3.5 percent, reaching 3.8 percent last month. The U.S. labor force participation rate, which has been one of the slowest-to-recover indicators throughout the crisis, made important gains over the past two months, jumping from 61.9 percent in December to 62.3 percent in February.
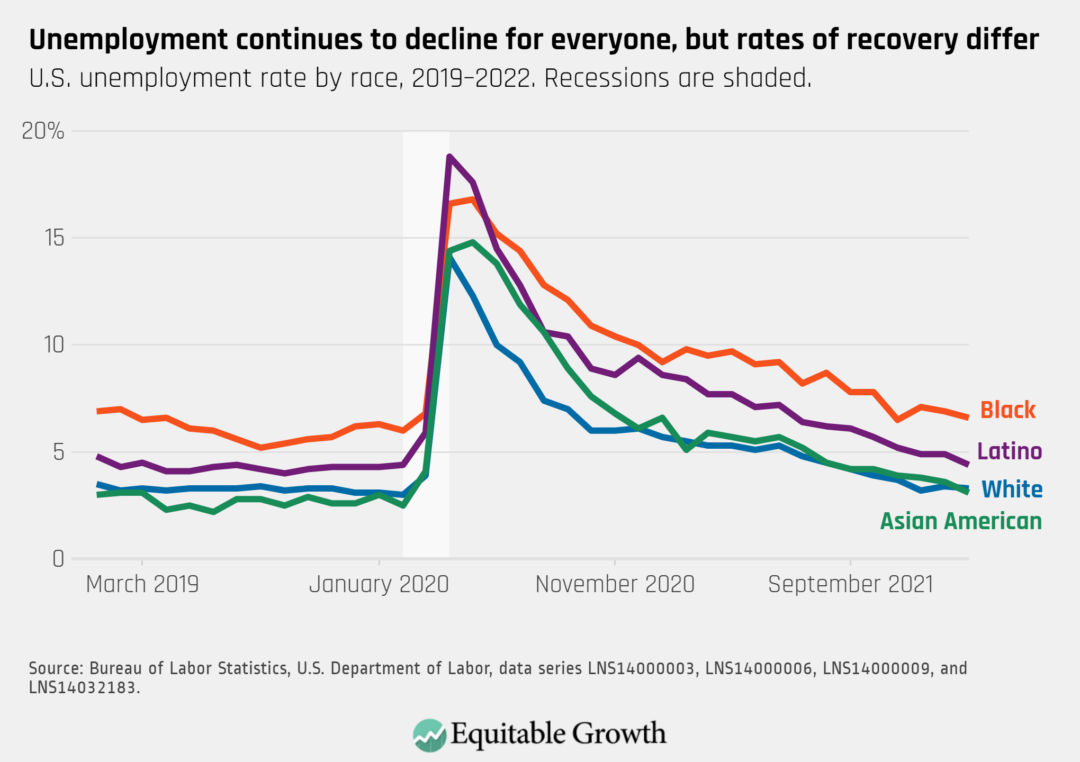
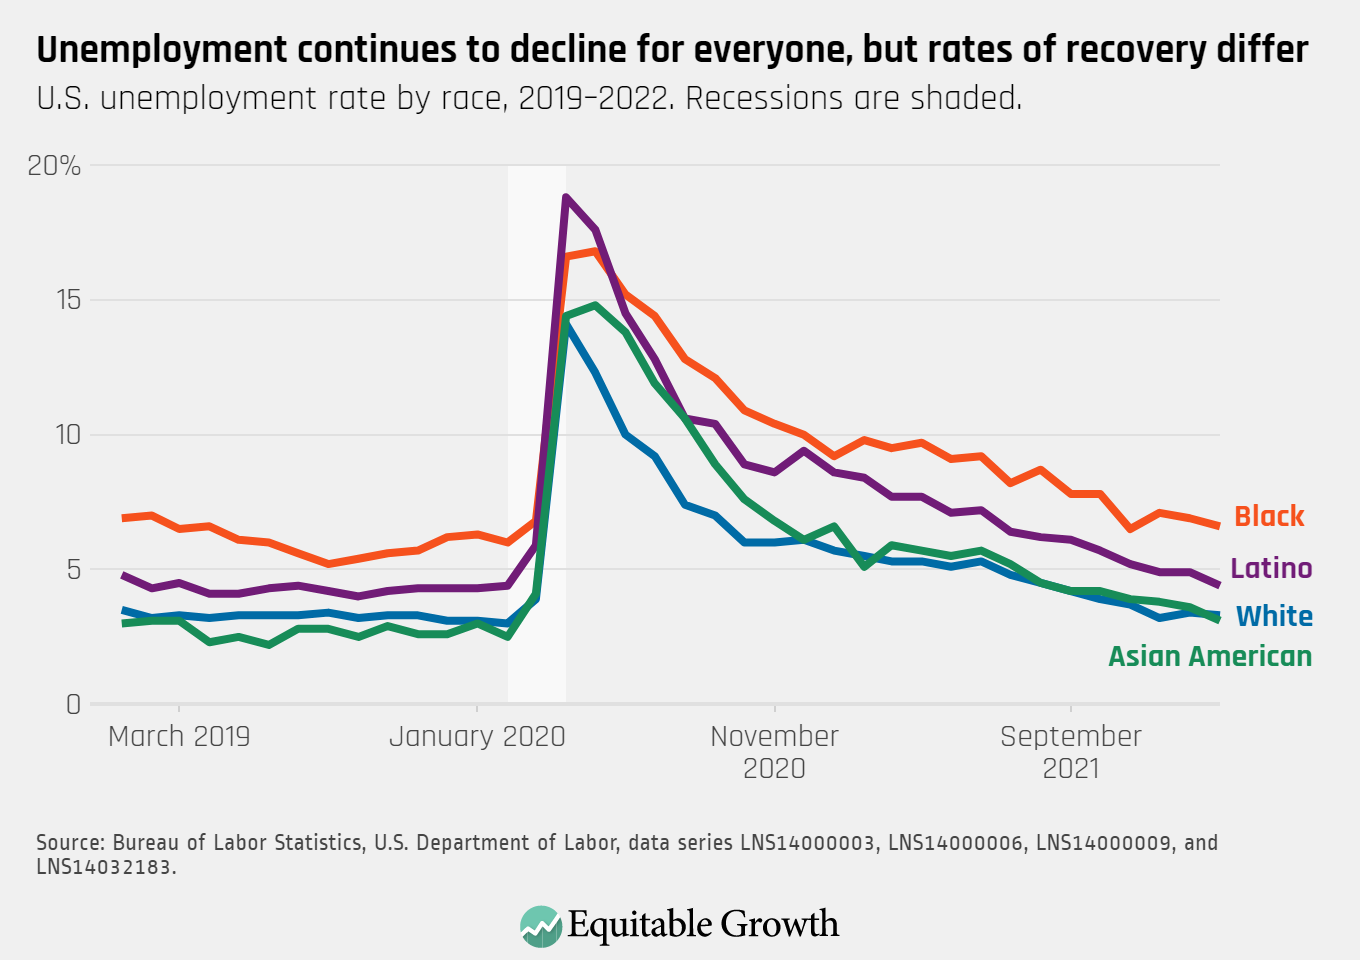
Across demographic groups, Black workers are currently experiencing a 6.6 percent unemployment rate, followed by Latino workers (4.4 percent), White workers (3.3 percent), and Asian American workers (3.1 percent). Overall, the workers of all these racial and ethnic groups experienced a decline in their unemployment rate last month. (See Figure 1.)
Figure 1
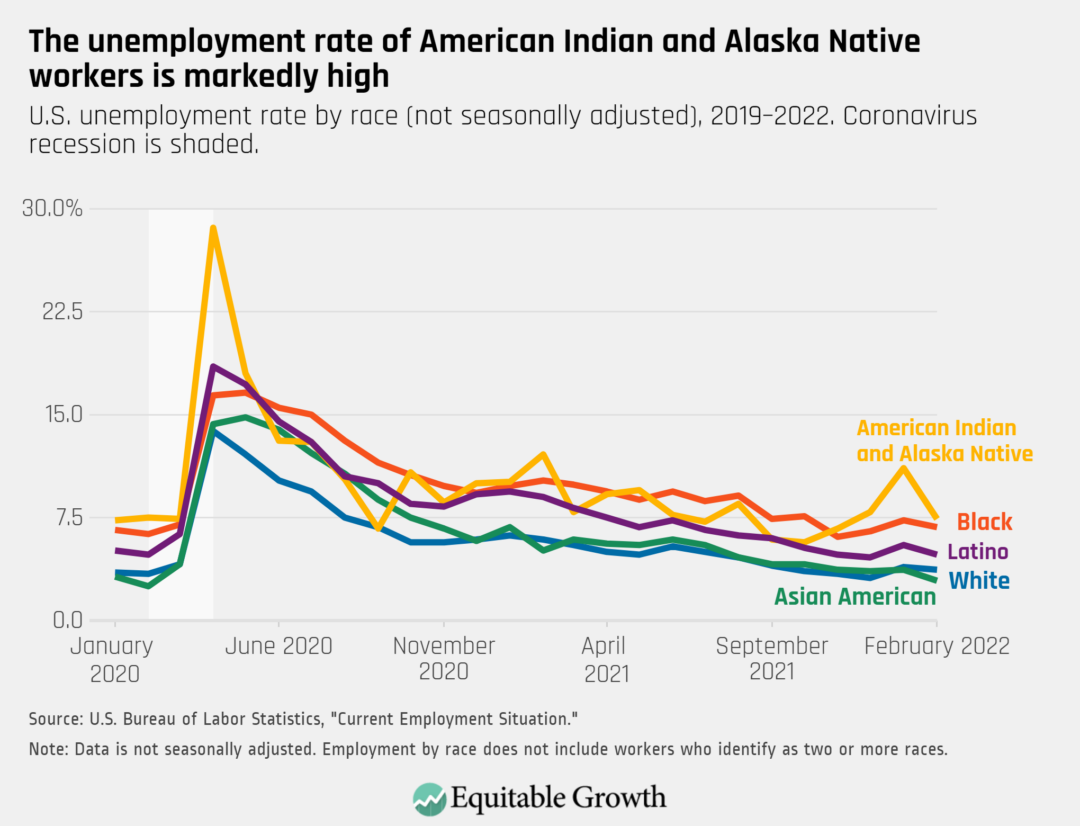
In addition, starting in February 2022 the BLS began publishing monthly unemployment data for American Indian and Alaska Native workers, showing that this group of workers is experiencing a higher jobless rate than any other major racial or ethnic group. While an important first step, experts Robert Maxim, Randall Akee, and Gabriel R. Sanchez at The Brookings Institution explain that shortcomings with the data highlight the need for policymakers and data collection agencies to continue working so that a more complete representation of how American Indian and Alaska Native workers are experiencing the labor market is visible and available in the monthly employment report. (See Figure 2.)
Figure 2
Women’s employment and labor force participation have yet to recover
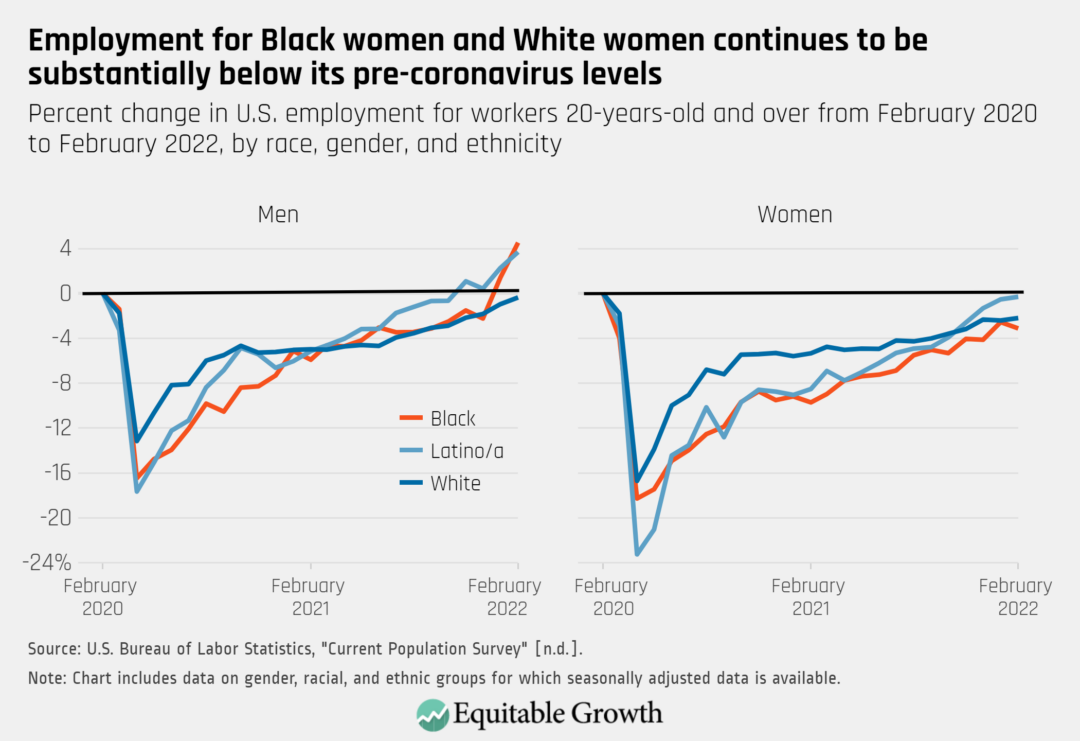
The most recent BLS data released today highlights that women workers continue to face disproportionately harsh labor market outcomes. In the early days of the coronavirus pandemic, women’s employment dropped dramatically, due to care responsibilities, occupational segregation, and other factors. And these same challenges continue to hinder the jobs recovery. The agency’s Employment Situation Summary shows that Black, Latina, and White women workers have all seen a substantially slower bounce back in employment than their male counterparts. (See Figure 3.)
Figure 3
Compounding the slower recovery in employment is that many women left the labor force altogether to take care of their family and communities. As of February 2022, women’s labor force participation rate was 1.3 percentage points below its pre-coronavirus recession level. Women are unlikely to fully reenter the economy without a robust care infrastructure.
Taken together, the ongoing pandemic and economic hardships remain especially hard on women—and particularly on Black women. This causes important ripple effects in several areas of the economy, including severe disruptions to sectors that provide care services. These sectors are closely tied to women’s economic security and labor market outcomes because they both employ high shares of women and provide the caregiving infrastructure that research shows is critical to supporting women’s labor force participation throughout the economy.
Critical care economy sectors continue to lose jobs, harming women’s employment options
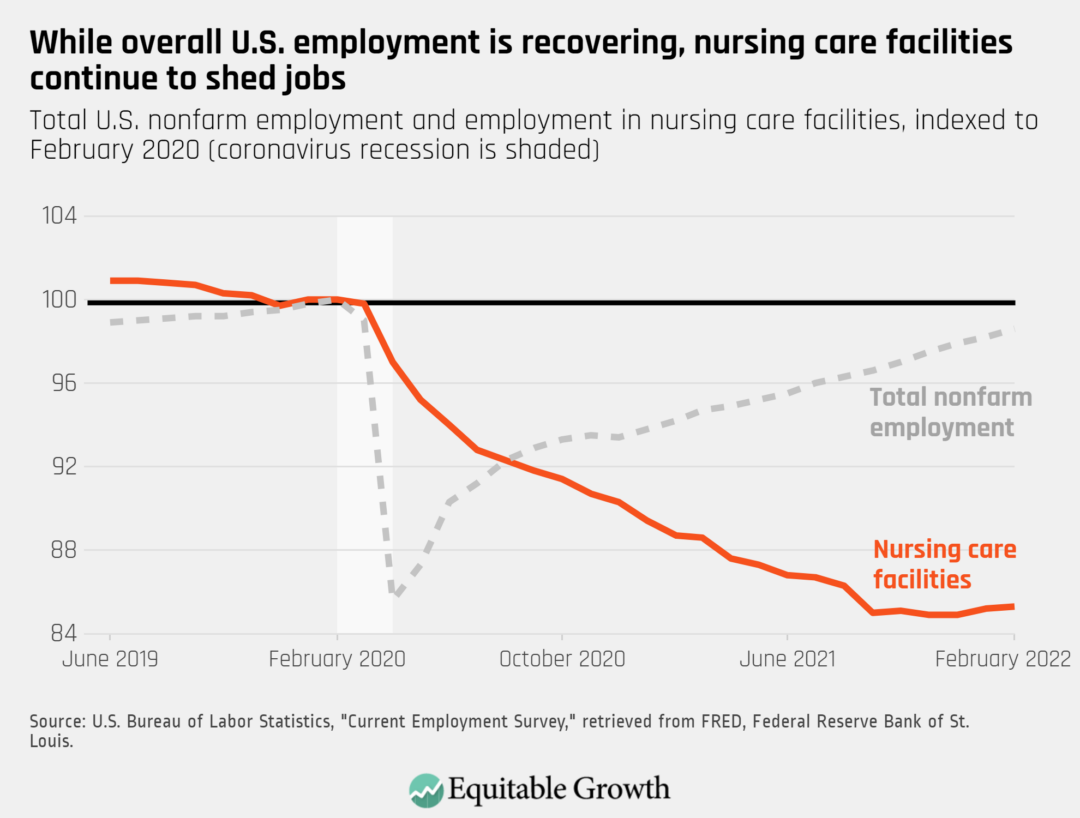
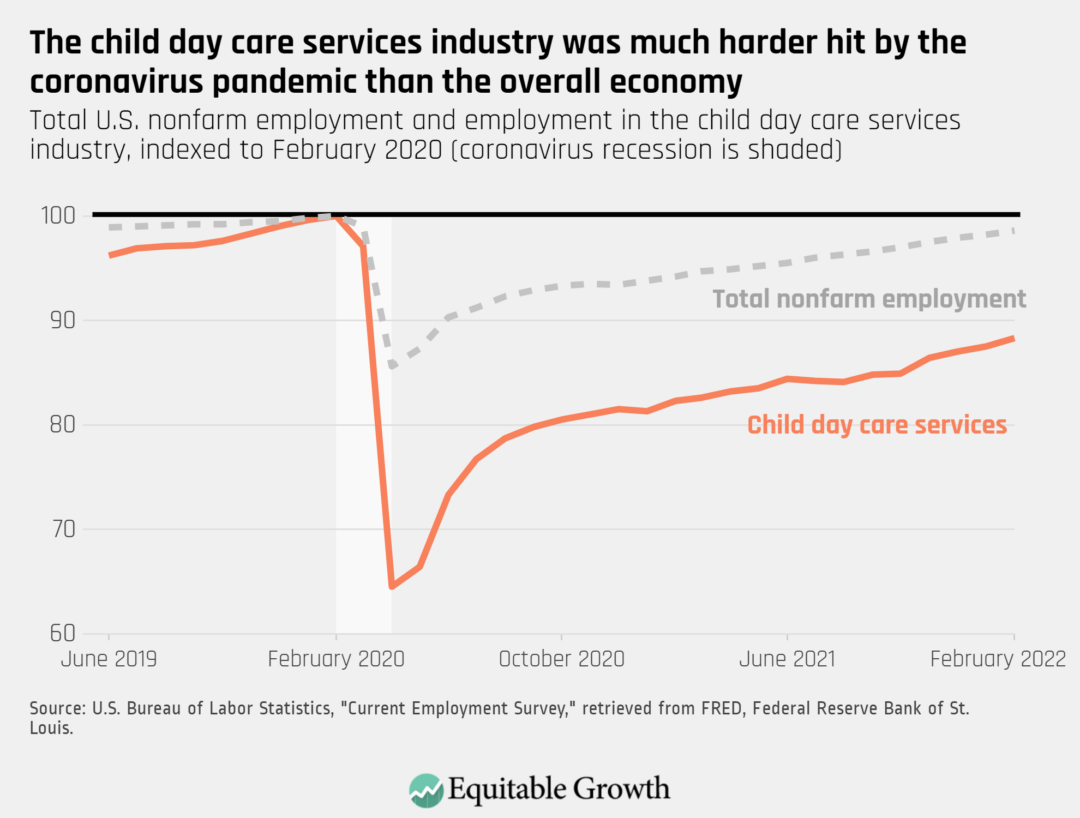
Let’s take a closer look at the importance of the care economy to women’s labor force participation. Even though overall U.S. employment is recovering at a remarkably strong pace, sectors such as nursing care facilities not only have not recovered from the initial blow of the coronavirus pandemic, but also continue to shed jobs almost two years into the recovery. (See Figure 4.)
Figure 4
Other care sectors are recovering jobs, but experienced such massive employment losses at the onset of the coronavirus recession that they are still well below their pre-pandemic employment levels. The child day care services sector, for instance, saw a 35 percent decline in employment between February and April 2020 alone, and is still at a 12 percent jobs deficit (See Figure 5.)
Figure 5
Why are these care sectors struggling to join in the jobs recovery? At least part of the answer is that the coronavirus crisis made already-precarious jobs even more difficult and insecure. Nursing homes, for example, came under the spotlight early in the pandemic as many facilities became hotspots of coronavirus infections. Health risks in conjunction with stressful working conditions, extremely low pay, and lack of access to benefits for staff—a workforce predominantly made up of women workers—deepened an understaffing crisis that was already hurting the sector well before the onset of the pandemic.
Today, women account for 88.6 percent of home health care workers and 94 percent of child care workers, according to an analysis by the Economic Policy Institute, with women of color and immigrant women making up disproportionate shares of both workforces. Wages and job quality remain low, and benefits are scarce. EPI reports that home health care workers and child care workers are far less likely to have employer-sponsored health insurance or retirement coverage than the workforce as a whole.
As the labor market continues to bounce back (the country is currently 2.1 million jobs below its February 2020 employment level), it will be essential that care sectors of the economy add many more good-quality jobs. Research by Rachel Dwyer at The Ohio State University shows that while the number of care economy jobs grew at a faster pace than virtually any other job group in the three decades that followed the early 1980s, the undervaluing of these jobs was also a substantial contributor to the gendered and racialized job polarization of the overall U.S. economic structure.
Invest in the care economy and its workforce for a more equitable recovery
As Equitable Growth highlighted in October, poor job quality in care-providing sectors has hindered employment growth and presented a clear risk to the country’s long-term economic trajectory. The lack of public investment in care sectors in the United States is a policy choice that leaves workers and families more vulnerable to economic shocks and slows the country’s broader recovery. As economists Sandra Black at Columbia University and Jesse Rothstein at the University of California, Berkeley explain, the lack of public investment in areas such as child care and long-term care insurance—despite clear market failures—shifts large costs and risks to families and exacerbates economic fragilities.
These vulnerabilities cause ripple effects throughout the economy, contributing to a system that fails families, care workers, and society at large. For instance, as Equitable Growth Policy Analyst Sam Abbott writes, the child care market depends on parent fees, and therefore is “particularly exposed” to economic conditions in ways that make the child care market slower to recover than other parts of the economy. Yet, Abbott notes, public investment was a source of resiliency for care providers during the coronavirus pandemic and recession, as “child care programs that received public funding, rather than solely relying on parental fees, were better able to retain their enrollment and staff during the coronavirus recession.”
Care investments and improved job quality also have direct implications for public health during the pandemic, as Georgetown University’s Krista Ruffini described in a recent working paper. Ruffini finds that higher wages and better workplace conditions for nursing home staff can improve the safety and health of workers and residents, with a clear role for both raising the minimum wage and greater public investments to support staff wages.
Investing in the care economy and in job quality for low-wage workers can not only strengthen care access and support women’s labor force participation but also protect vulnerable workers during times of crisis and drive more equitable growth during periods of recovery. Research shows that raising labor standards, wages, and job quality for care providers and other workers, along with policies to support worker power and strengthen the country’s social infrastructure, is vital to improving economic security for workers and their families.
On March 4, the U.S. Bureau of Labor Statistics released new data on the U.S. labor market during the month of February. Below are five graphs compiled by Equitable Growth staff highlighting important trends in the data.
Total nonfarm employment increased by 678,000 in February, and the employment rate for prime-age workers rose to 79.5 percent.
The unemployment rate fell slightly to 3.8 percent in February. It remains higher for Black workers (6.6 percent) and Latino workers (4.4 percent) compared to White workers (3.3 percent) and Asian American workers (3.1 percent).
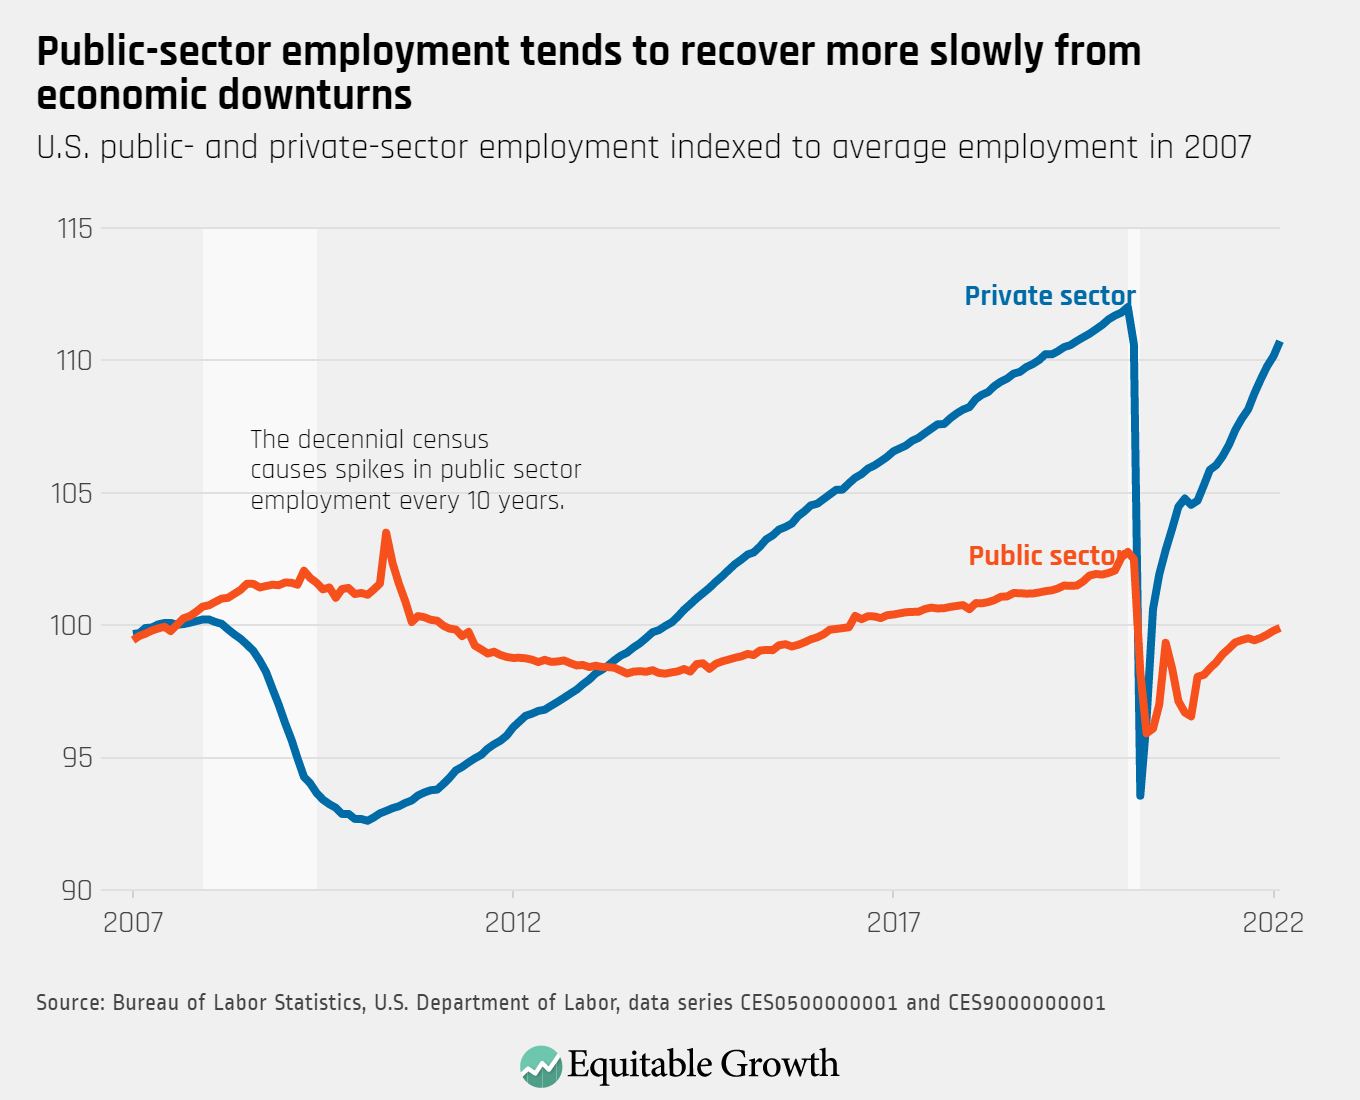
Private-sector employment continued to rise in February, while public-sector employment made modest gains and remains well below pre-crisis levels.
Unemployment rates fell to 4.3 percent for workers with less than a high school degree and 4.5 percent for high school graduates. The unemployment rate is 3.8 percent for workers with some college, and 2.2 percent for college graduates.
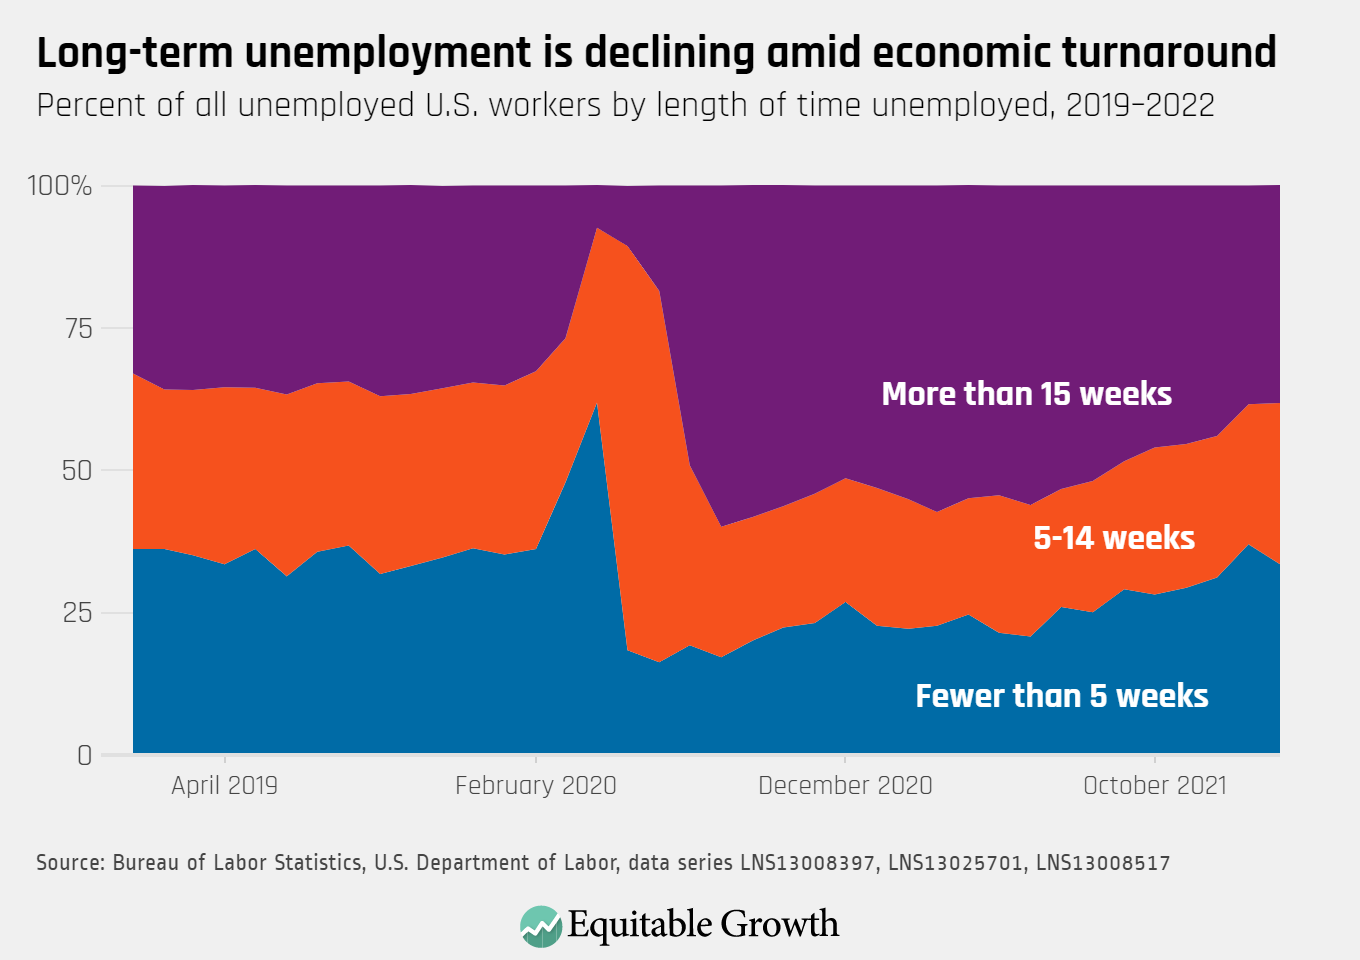
The proportion of unemployed U.S. workers facing long-term unemployment did not change dramatically last month, as 38.3 percent of unemployed workers have been out of work for more than 15 weeks. Another 28.3 percent have been out of work for 5-14 weeks, and 33.5 percent for fewer than five weeks.
Today, President Joe Biden will give his State of the Union Address, approximately 1 year into his administration and 2 years after COVID-19 struck the United States.
The coronavirus recession was incredibly severe. As the pandemic hit, the U.S. unemployment rate skyrocketed from a 50-year low of 3.5 percent in February 2020 to a post-Great Depression high of 14.7 percent in April of that same year. Over those same two months, the country’s employment collapsed. The U.S. labor market shrank by more than 20 million jobs. Industrial production plummeted. And the U.S. economy contracted by 3.4 percent over 2020—the worst year for economic growth since 1946.
The coronavirus recession officially ended in April 2020, but the federal policy response extended well into 2021 to ensure a robust economic recovery. By the end of 2021, real U.S. Gross Domestic Product growth hit 5.7 percent. Below are 11 charts that showcase the trajectory of our economy over the past 2 years and the important policy decisions that are still up ahead:
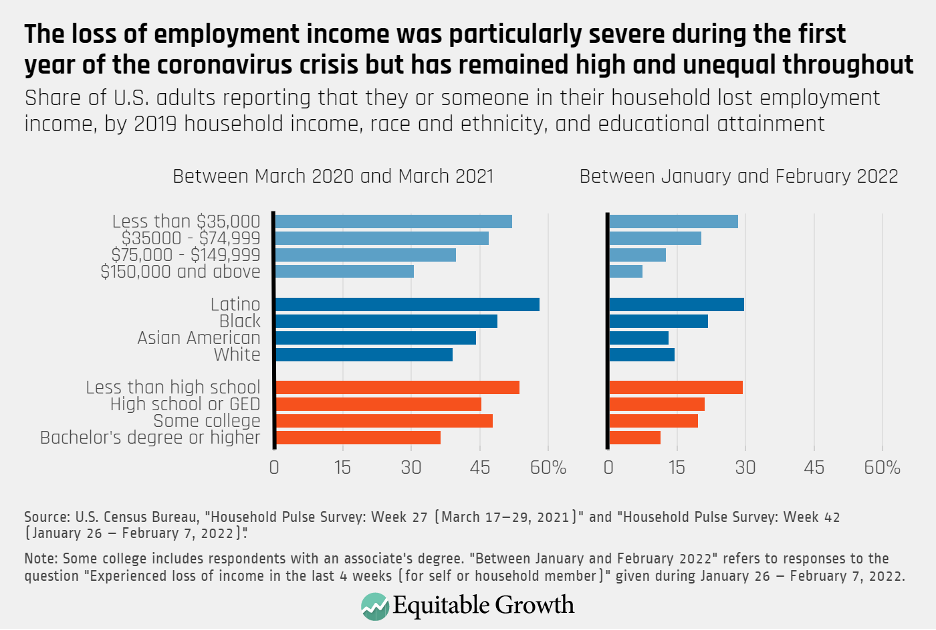
One of the most telling features of the coronavirus recession and continuing pandemic is that it hit already vulnerable groups especially hard. Both in the first year after the onset of the recession and in early 2022, lower-income households, Black and Latino households, and those with lower levels of formal education experienced especially large losses in employment income. (See Figure 1.)
Figure 1
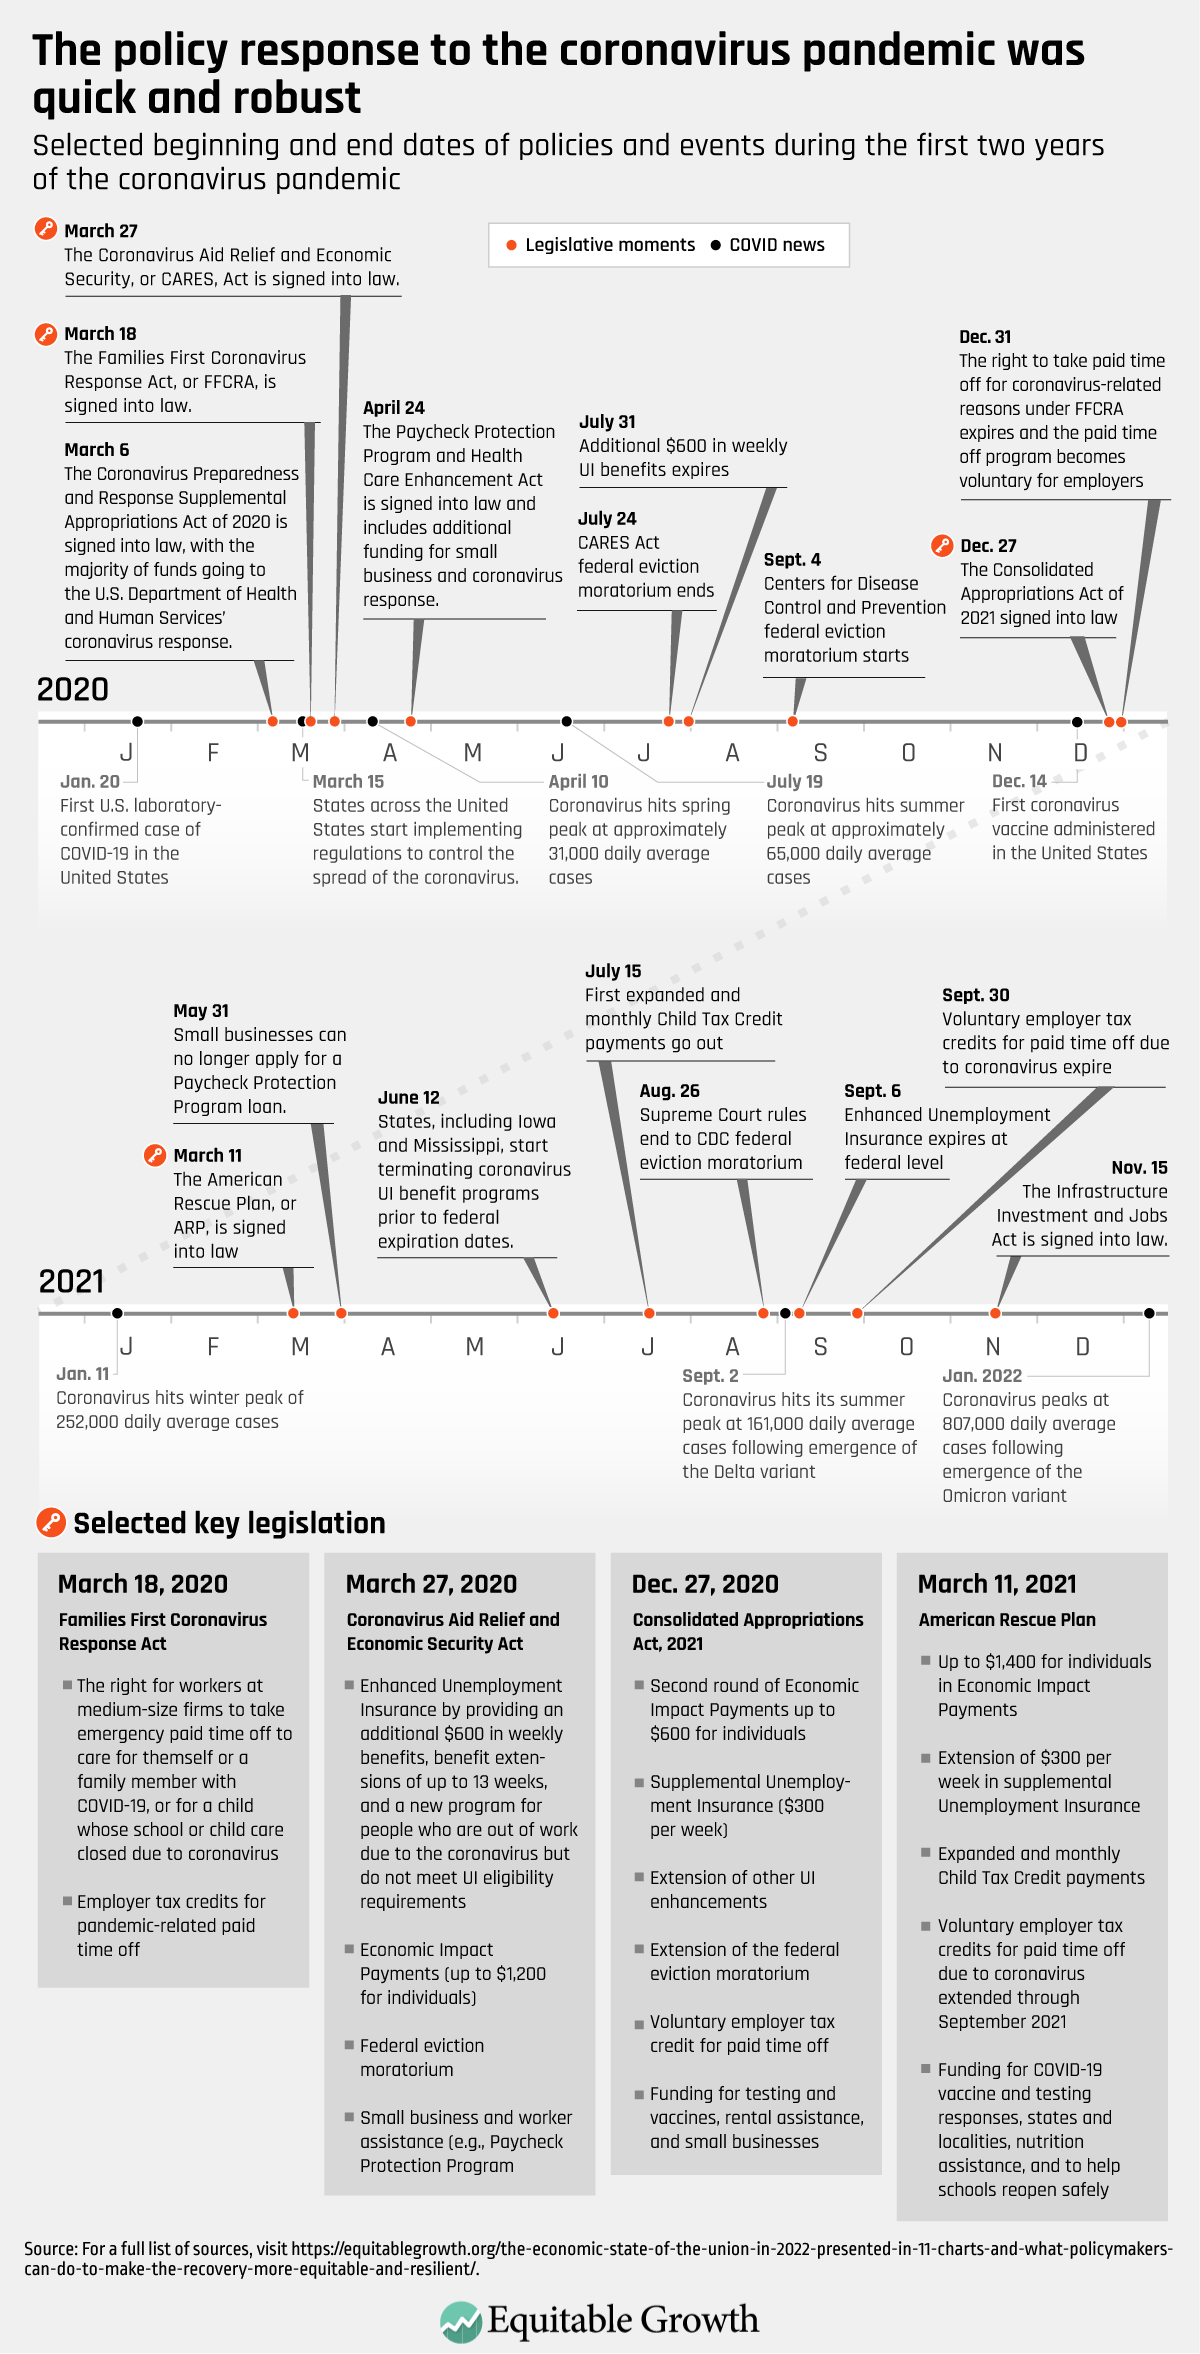
In response, the U.S. government enacted a series of measures shortly after the pandemic hit to mitigate the effects of the health and economic crises. Between March and April 2020, the U.S. Congress passed four major pieces of legislation, the most consequential being the Coronavirus Aid, Relief, and Economic Security Act. The CARES Act included provisions to expand eligibility and provide extra support through the Unemployment Insurance system, additional funding for food assistance through the Supplemental Nutrition Assistance Program, loans and guarantees for small businesses through the Paycheck Protection Program, and Economic Impact Payments.
The next year followed with the American Rescue Plan, signed into law in March 2021. It included an extension of many CARES Act programs as well as new initiatives such as the expansion of the Child Tax Credit. Provisions included in these bills began to expire in the first year of the pandemic and through 2021. (See Figure 2.)
The unprecedented speed and size of the policy response helped millions of workers and households withstand the economic pain brought on by the coronavirus pandemic. The bounce back in Gross Domestic Product, for example, was much quicker in the United States than in most other high-income countries; the aggregate unemployment rate is now close to its pre-pandemic level; and workers in the bottom of the wage distribution are experiencing real wage growth.
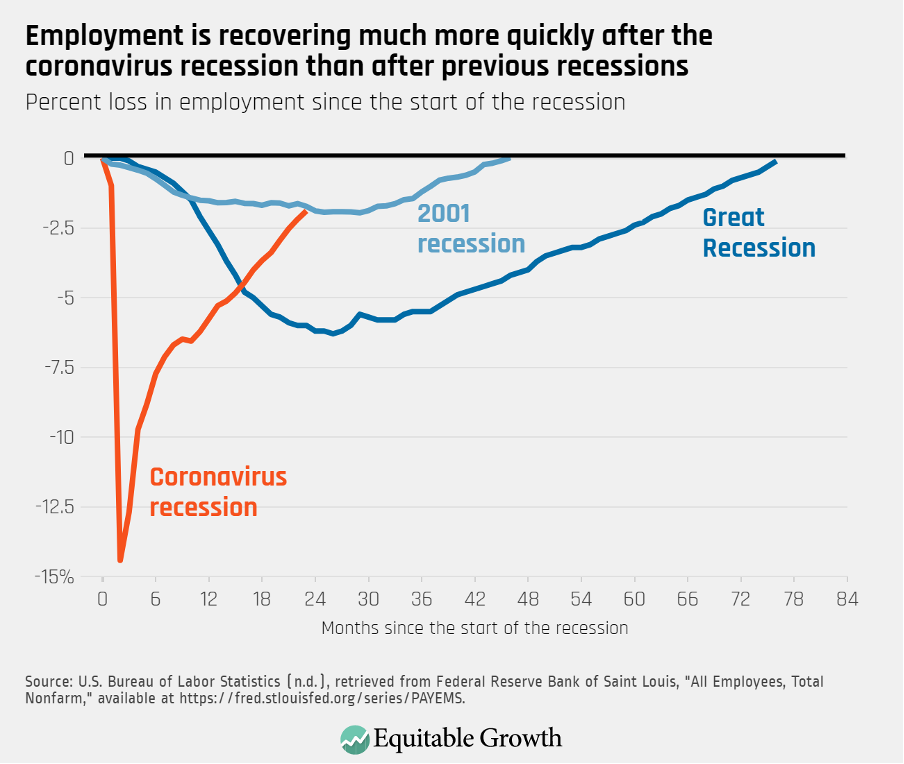
Indeed, the recovery in overall employment has been extraordinarily quick compared to previous U.S. economic downturns. (See Figure 3.)
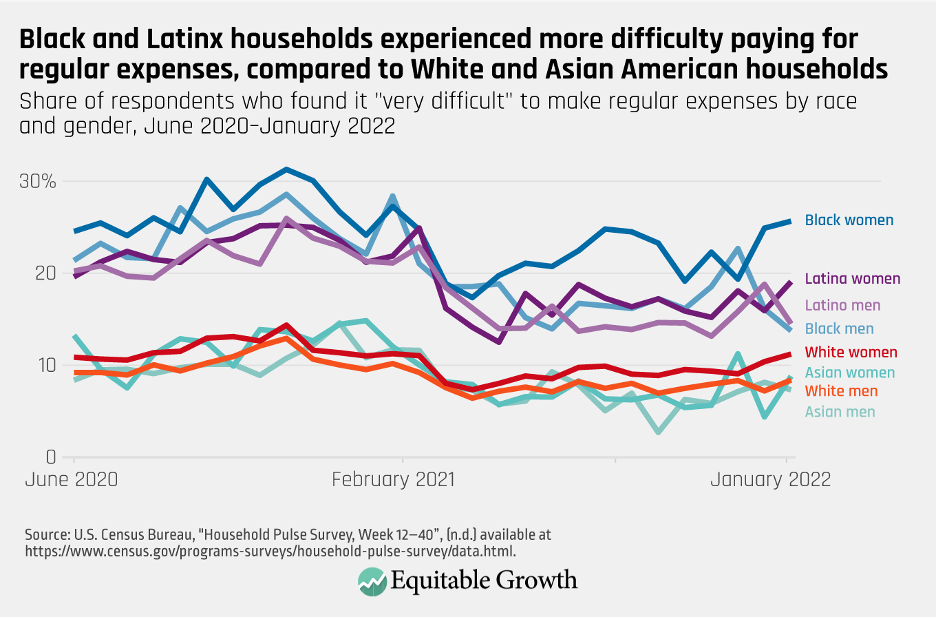
Two years after the onset of the coronavirus recession, disparities are stark and many workers, families, and communities are still hurting. Throughout the pandemic, Black and Latina women have faced the greatest difficulty paying for their regular expenses. Additionally, the interaction between gender and racial wage divides—or what Equitable Growth’s President and CEO Michelle Holder refers to as “the double gap”—have been exacerbated in the pandemic, as data shows Black women earn less than White men within the same frontline essential occupations. (See Figure 5.)
Figure 5
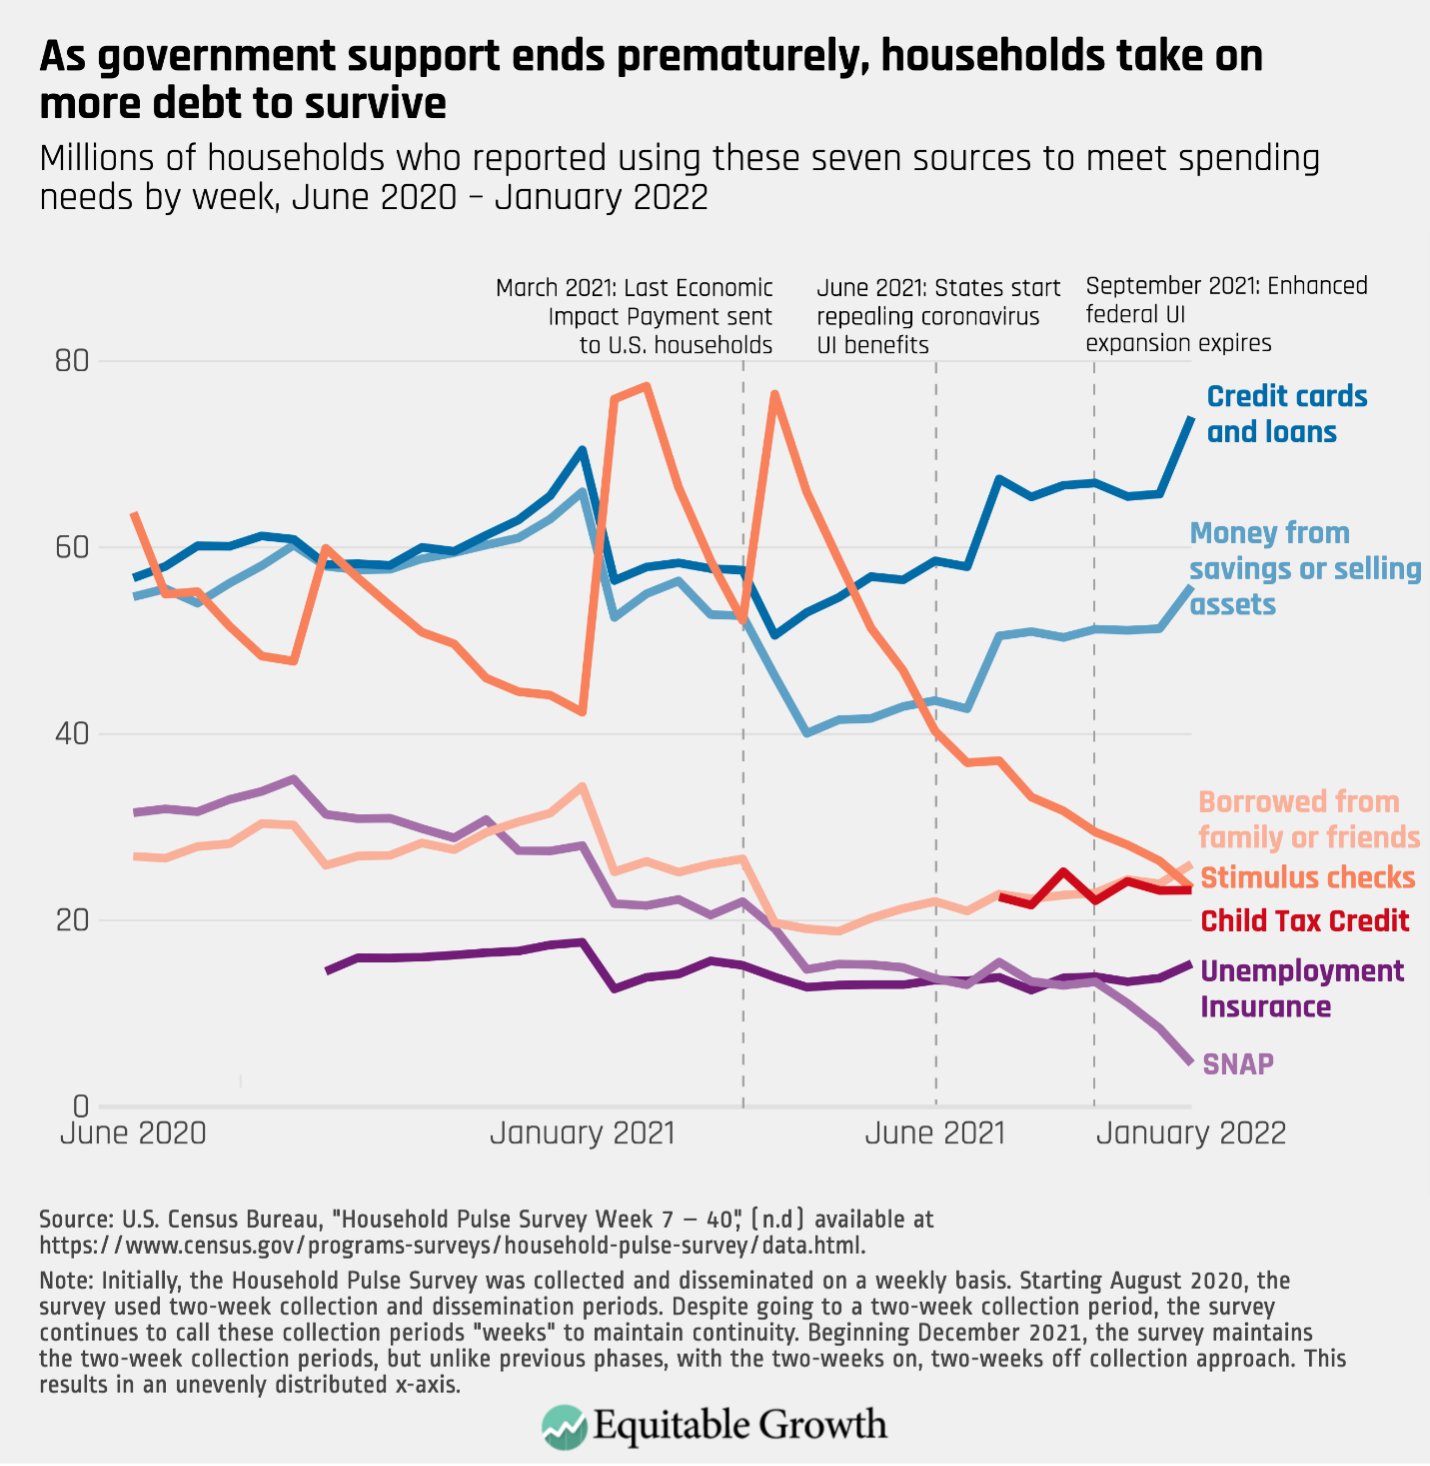
Moreover, many types of income supports were taken away prematurely, hurting many and especially those already disadvantaged. The result? Many workers, families, and communities are in serious danger of being left behind amid the current economic recovery. Data show that as households depleted their Economic Impact Payments, they began turning to credit card debt, loans, borrowing from friends or family, or selling off assets in order to meet regular expenses. (See Figure 6.)
Figure 6
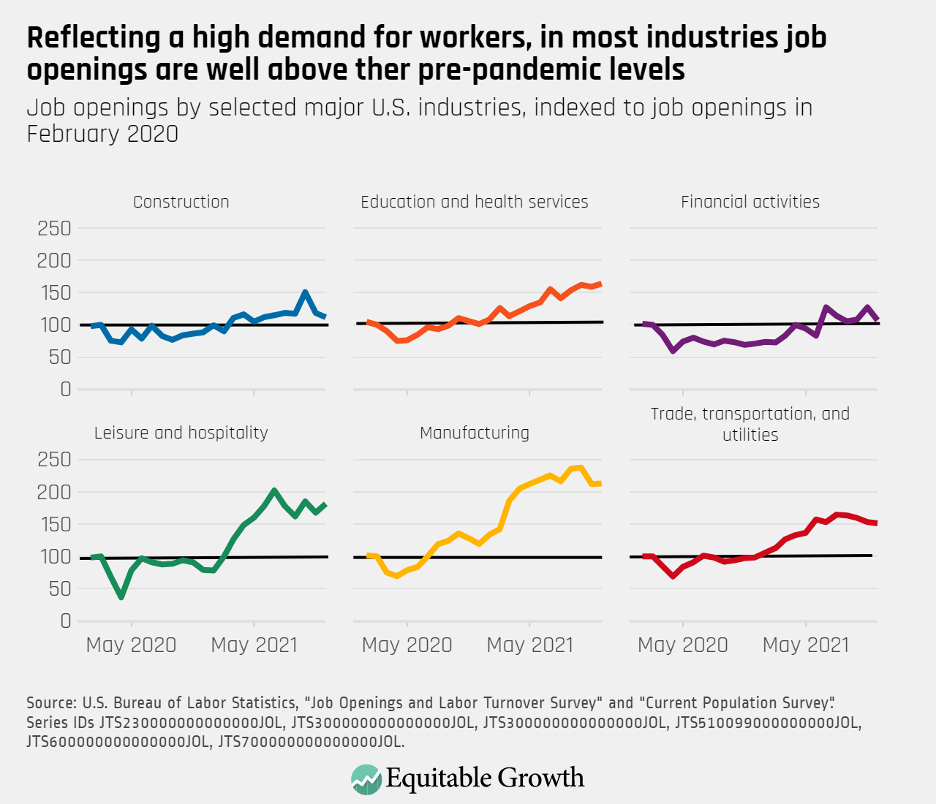
Fast-forward to today. A wide-range of indicators reveal a nuanced story about the health of the U.S. economy. On one hand, coronavirus cases are now well-below their early January 2022 peak, those at the bottom of the earnings distribution are seeing real wage gains. And labor demand has skyrocketed, giving workers more power to negotiate higher pay and better working conditions. As such, job openings in the U.S. reached a record high of 11.1 million in July 2021—an almost 60 percent increase from February 2020—and have remained elevated since. The jump in open positions has been particularly stark in industries such as manufacturing and leisure and hospitality. (See Figure 7.)
Figure 7
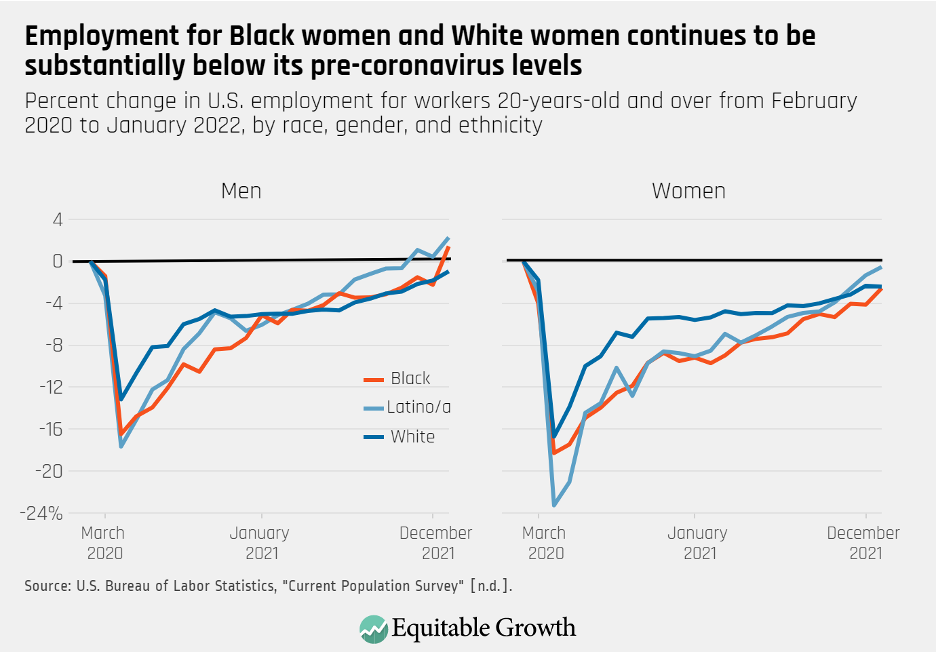
At the same time, the U.S. economy is still at a 2.9 million jobs deficit compared to February 2020. Both the effect of the health crisis and the recovery in the U.S. labor market have been uneven. For instance, employment levels for Latino men and Black men have only just risen above their pre-coronavirus levels, and other groups still have not recovered. Black women have experienced some of the toughest labor market outcomes, seeing the largest drop in labor force participation and the slowest jobs recovery. As of January 2022, 262,000 fewer Black women were employed than in February 2020—a 2.6 percent drop. (See Figure 8.)
Figure 8
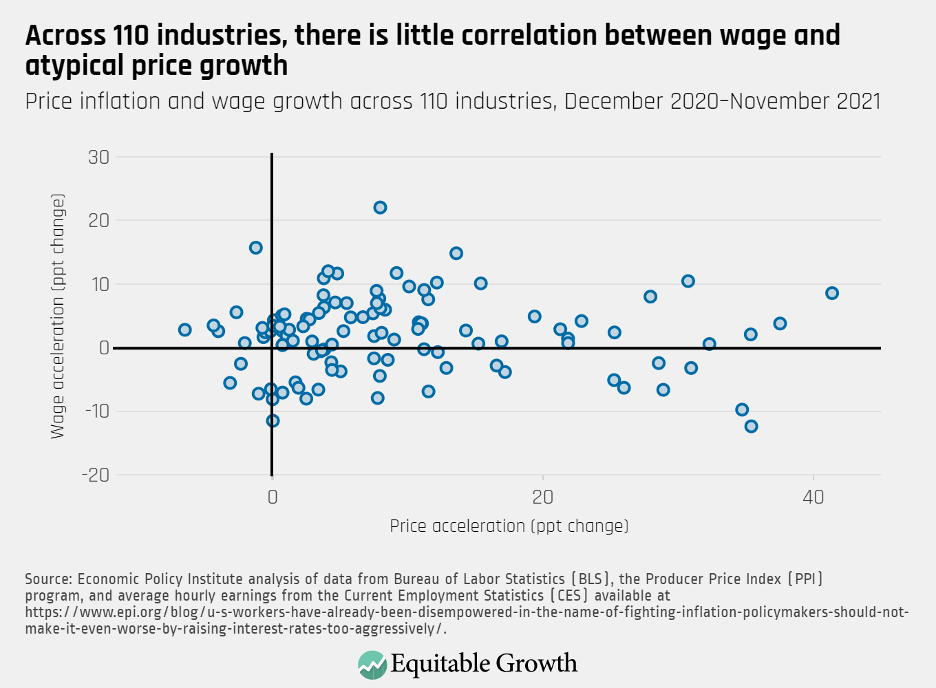
In the midst of it all, inflation has risen. Supply chain breakdowns due to the pandemic are a major reason. Yet some large firms continue to collect record profits, claiming that they need to raise prices for consumers to account for increasing costs of production, transportation, and labor. Many economists disagree. An analysis of price and wage growth across more than 100 industries by the Economic Policy Institute, for instance, shows that industries that increased wages to attract workers, such as hotels and other accommodations, have not seen an unusually large spike in prices. (See Figure 9.)
Figure 9
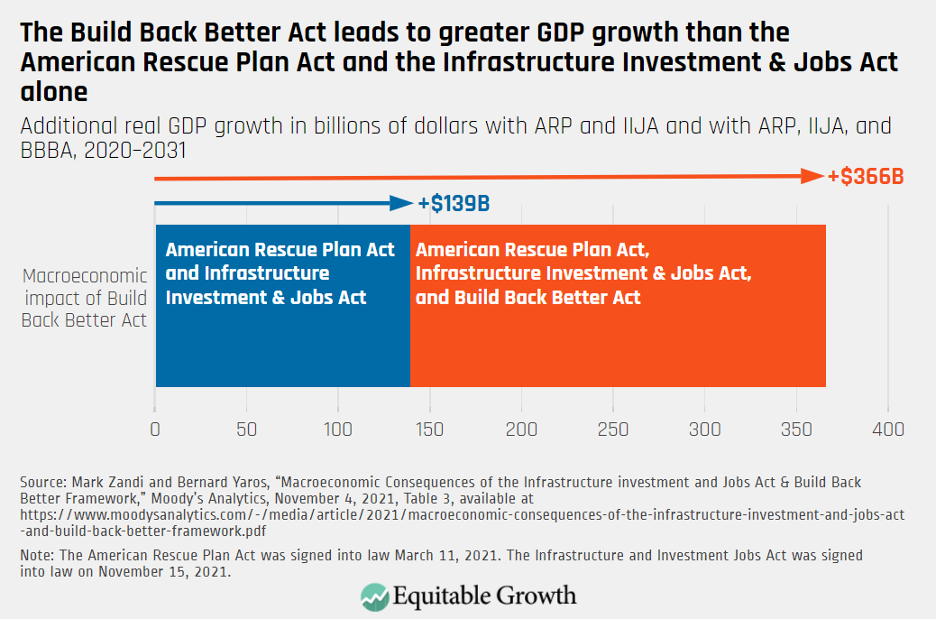
The notion that inflation warrants fiscal austerity is misplaced. Opposition to much needed government spending in social and physical infrastructure is holding back necessary reforms and investments. Under the weight of the coronavirus pandemic, the child care sector contracted dramatically, leaving parents scrambling to find the child care they need to return to work. Legislation such as the proposed Build Back Better Act would strengthen the labor market and allow parents to return to work knowing that their children are safe and well cared for. (See Figure 10.)
Figure 10
Swift and decisive government action caused the coronavirus recession to be much less severe than it could have been. Still, many households, particularly those headed by Black, Latino, women, or low-income individuals, are still reeling from the pandemic’s impacts on the economy. The Build Back Better Act contains many social and physical infrastructure proposals that are backed by economic evidence. One study finds that the full bill’s passage would increase Gross Domestic Product. By not passing the Build Back Better Act, policymakers would lose out on an opportunity to make the investments that could make the country’s economy more resilient and equitable. (See Figure 11.)
Figure 11
Conclusion
President Biden today is expected to reaffirm his commitment to enacting key parts of his Build Back Better plan. As these 11 charts demonstrate, decisive government investments in our nation’s social infrastructure remain key to overcoming endemic economic divides across race, gender, and income. With U.S. economic growth still strong, now is the time to make these investments so that the recovery is not just strong but also equitable and thus more enduring.
Different manifestations of inequality are among the most persistent features of the U.S. economy, yet mainstream economics traditionally explains disparities between groups solely as they relate to differences in either so-called human capital or a lack of economic competition. A subfield within the broader economics discipline, called stratification economics, instead studies and explains inequality as a process in which the outcomes of different groups are shaped by social relationships, power dynamics, and public policies.
Stratification economics is an empirically grounded approach to study disparities across the lines of race, ethnicity, gender, class, caste, sexuality, nationality, and other social markers. This framework also incorporates the importance of social hierarchies and structures in shaping economic outcomes.
William “Sandy” Darity, Jr. is one of the founders of stratification economics. He is the director of the Samuel DuBois Cook Center on Social Equity at Duke University and also a member of the Washington Center for Equitable Growth’s Research Advisory Board. Darity puts forth that stratification economists hold certain assumptions about the processes by which economic and social disparities are created and maintained, as well as about the mechanisms through which they can be addressed. Specifically, these assumptions are that:
Disparities in groups’ abilities to transfer resources across generations are key drivers of inequality.
Dominant groups have material interests in actively maintaining their privileged positions.
Effective public policy is essential to push against discrimination and foster more equitable outcomes.
The acquisition of human capital does not guarantee that members of an underprivileged group will not experience the economic penalties that stem from discrimination.
Dysfunctional behavior by some individuals is not reflective of a collective characteristic of a broader group.
In this issue brief, we examine each of these insights in turn.
Disparities in groups’ abilities to transfer resources across generations are key drivers of inequality
Under the stratification economics framework, the structures and processes that affect groups’ ability to transfer resources from one generation to the next are essential factors explaining persistent disparities between groups. Wealth inequality, for example, is understood as the result of a long-term process in which exclusionary social policies, property dispossession, and disparities in access to opportunities all have an effect on groups’ ability to pass on resources across generations. Further, stratification economics highlights the feedback loop associated with the generation, accumulation, and transfer of resources.
Darrick Hamilton, professor of economics and urban policy at the New School for Social Research and co-founder of stratification economics, for instance, explains wealth generation this way:
We often think of wealth as an outcome, but its true essence is functional. Wealth empowers individuals to consume and invest in different ways. And wealth is iterative: Wealth often generates more wealth, both within and across generations. Wealthier families are better positioned to finance elite educations, access capital to start a business, finance expensive medical procedures, reside in higher amenity neighborhoods, exert political influence, purchase better counsel if confronted with an expensive legal system, leave a bequest, and withstand financial hardship resulting from any number of emergencies, including a global pandemic.
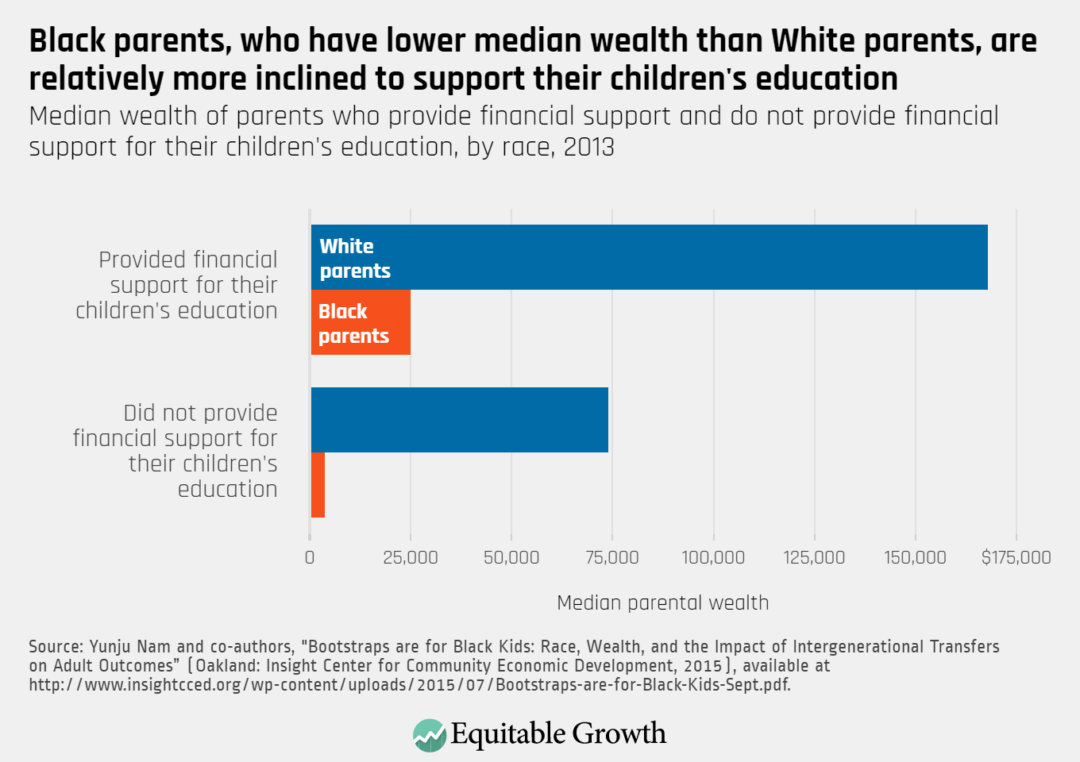
Several empirical studies support this view. Research shows that wealth and income divides between groups are important drivers of health, earnings, and educational gaps. A study analyzing the relationship between race and intergenerational transfers, for example, finds that disparities in families’ abilities to pass on resources have deep implications for long-term life outcomes. It shows that 34 percent of adult White children receive financial support from their parents to pay for higher education and 12 percent receive financial support for homeownership, while only 14 percent of Black adult children receive parental support for higher education and 2 percent receive it for homeownership.
The authors of this study also show that this divide is driven by disparities in economic resources rather than by preferences. This is because Black parents who do provide financial support for their children’s education do so at far lower levels of wealth than their White counterparts. (See Figure 1.)
Or take unequal access to employment opportunities. Matthew Staiger at Opportunity Insights finds that by providing access to networks and better-paying jobs, the intergenerational transmission of employers—where a worker finds their first stable job at the same employer as a parent—gives those workers a large earnings boost that persists over time. Non-Black men with higher-earning parents, Staiger finds, benefit most from this intergenerational transmission of employers.
A similar dynamic is at play in housing. A study by Rachel Atkins at New York University’s Stern School of Business shows, for instance, that Black-White differences in housing wealth contribute to Black-White differences in the likelihood of starting a business. Atkins also finds that Black homeowners are less able to leverage their housing assets as collateral to fund entrepreneurial endeavors.
Scholars also study how policies and institutions create disparities in groups’ abilities to pass on resources across generations. For instance, the forced relocation of American Indians and Alaska Natives and other harmful federal government policies create big barriers for members of these communities to own property and access affordable and high-quality financial institutions. Other examples include research on:
The adverse effects that the overrepresentation of Black, Latino, and Native American people in the U.S. criminal system have on their families and communities, with studies by Robynn Cox at the University of Southern California showing that incarceration is associated with racial health divides and greater rates of food insecurity among households with children
The impact that the threat and enforcement of harsh immigration policies have on the educational and employment outcomes of both undocumented and documented immigrants
These are just a few of the lines of stratification economics research examining the consequences of unequal access to resources in the U.S. economy.
Dominant groups have a material interest in actively maintaining their privileged position
One of the most important insights of stratification economics is that privileged groups’ material interest in maintaining existing social hierarchies is a key driver of inequality. Segregation, discrimination, and exploitation, for example, are all understood as mechanisms by which more powerful groups keep and protect their higher position in a social hierarchy.
In recognizing that groups have a collective self-interest in maintaining or improving their relative standing, stratification economists understand and study efforts by dominant groups to uphold inequality as unjust, intentional, and rational.
To this point, several studies document how outsized political and economic influence in conjunction with structural racism and other forms of oppression create and entrench economic inequities. A number of scholars point out, for example, that despite the race-neutral language embedded in the New Deal legislation of the 1930s, the exclusion of domestic workers and farm workers from the National Labor Relations Act of 1935 and the Fair Labor Standards Act of 1938 reflect deliberately racist and sexist efforts by southern Democrats to preserve the cheap labor and social privileges. These exclusions were designed to preserve the “quasi-plantation style of agriculture that pervaded the still-segregated Jim Crow South,” writes Juan Perea at the Loyola University of Chicago School of Law.
These findings are echoed in rhetoric about and around economic policy. In recent research, Chris Becker at Stanford University analyzed speeches from the Congressional Record and found the pro-segregationist language of the Jim Crow era embedded in economic policy speeches of conservative politicians in the late 20th and the early 21st centuries. Becker proposes that even though the precise language is less explicitly racist, conservative political rhetoric around issues, such as government spending, taxes, and anti-poverty policy, maintain so-called dog whistles that lead to the racialization of economic issues, expand support for a right-wing economic agenda, and ultimately create barriers for the implementation of redistributive economic policies.
Other examples of dominant groups protecting their privileged positions include opposition to affordable housing projects and voter suppression and income- and race-based barriers to voting. In the case of barriers to political participation and its relationship with economic inequality, research by M. Keith Chen of the University of California, Los Angeles and his co-authors shows that voter wait times are significantly longer in areas where a higher proportion of residents are Black than in areas where residents are predominantly White, increasing costs associated with political participation for Black Americans. This disparity in voting wait times, the authors suggest, is likely a result of the systematic underresourcing of Black neighborhoods.
Barriers to political participation, in turn, shape economic policy priorities when certain groups are disenfranchised. Research by Abhay Aneja of the University of California, Berkeley and Carlos Avenancio-León of the University of California, San Diego finds, for example, that the invalidation of the core provisions of the Voting Rights Act in the Shelby County v. Holder Supreme Court decision of 2013 contributed to increases in income inequality. The authors propose that removing voting rights protections, such as oversight by federal election monitors in counties that had been found to engage in voting discrimination, seem to have had knock-on effects by hindering disadvantaged groups’ political power and widening wage divides in public-sector employment.
Effective public policy is essential to push against discrimination and foster more equitable outcomes
Stratification economics centers the role of policies and institutions in alleviating—as well as perpetuating—social and economic disparities between different groups. For instance, the standard view of mainstream economics is that discrimination declines over time as competition progressively makes discriminatory firms inefficient and unprofitable, ultimately driving them out of business. While research does show that robust competition can lead to more equitable outcomes, stratification economists recognize that structural inequities, such as systemic racism and sexism, are long-lasting, persistent, and unlikely to disappear in the absence of effective public policies.
Empirical research shows that deep-rooted inequities, such as racial income divides, have only substantially narrowed because of proactive government efforts. The enforcement of anti-discrimination protections by the U.S. Equal Employment Opportunity Commission, for example, shapes the processes of racial desegregation in the workplace, with more resources and political will channeled toward enforcement fostering integration and lax enforcement reducing integration or stalling it altogether.
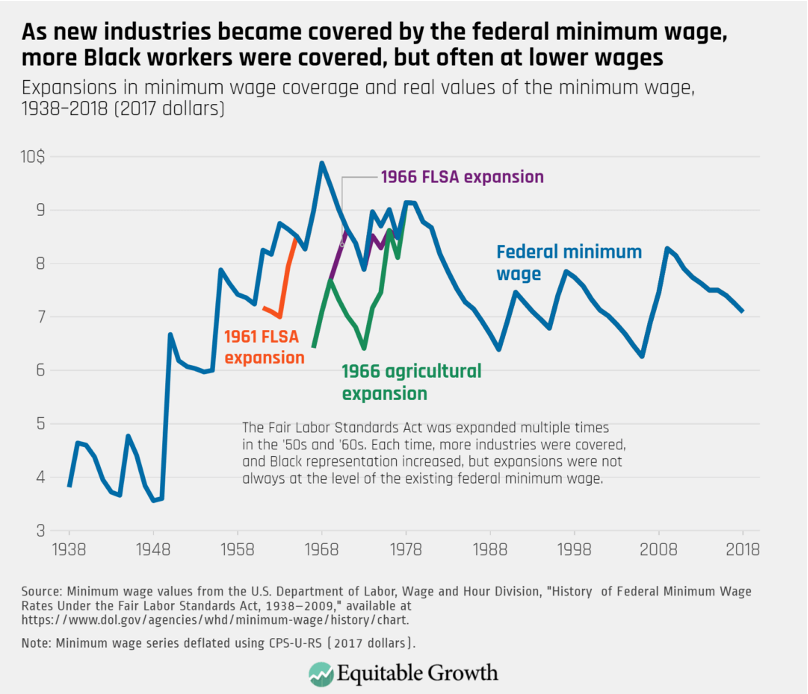
Similarly, research by Ellora Derenoncourt at Princeton University and Claire Montialoux at the University of California, Berkeley, finds that the Black-White income divide narrowed substantially as minimum wage protections under the Fair Labor Standards Act were extended in the 1960s to industries in which Black workers where overrepresented, such as restaurants and hospitality. Yet the authors also find that the real value of the minimum wage has declined after it was expanded to cover more Black workers. (See Figure 2.)
Figure 2
Other studies find that effective public policies to alleviate discrimination also include the enactment of Civil Rights era legislation and government agencies, such as the Equal Employment Opportunity Commission, and the launch of federal affirmative action programs. These efforts are all associated with a decline in economic inequality along the lines of race.
Stratification economists are not only concerned with explaining the consequences of social and economic inequality but also study, propose, and design policies to address them. Dania Francis at the University of Massachusetts, for example, examines how a reparations program in the United States can be designed to effectively address the legacy of slavery, the state-sanctioned discrimination that followed the Civil War, and the systemic racism that continues to hinder the ability of descendants of enslaved people in the United States from building wealth and achieving economic security.
Other such examples include the creation of a so-called baby bonds program that would establish a public trust account for children at birth. Naomi Zewde of the City University of New York, for example, estimates that a baby bonds program inversely tied to family wealth up to a maximum $50,000 investment would reduce the wealth disparity between young White Americans and young Black Americans. Zewde’s estimates show that while young White Americans currently hold about 16 times the wealth of their Black counterparts, a baby bonds program would reduce that number to less than 2 times after about 25 years. These programs thus demonstrate the transformative potential of public policy designed to address the economic impact of structural racism.
The acquisition of human capital does not guarantee that members of an underprivileged group will not experience the economic penalties that stem from discrimination
Stratification economists analyze inequality and discrimination as phenomena that are not mitigated through an individual’s acquisition of educational credentials. For instance, wage divides between different groups of workers are often explained and understood solely in terms of differences in the acquisition of human capital—disparities in the possession of skills, knowledge, and formal education that are associated with greater or lesser economic rewards. Yet empirical studies reveal that even when comparing individuals with similar backgrounds and human capital characteristics, race, ethnicity, gender, nationality, and the interaction between these social markers often result in economic premiums and penalties that cannot be accounted for by the factors economists traditionally associate with productivity.
Research shows, for instance, that even when accounting for a variety of factors—such as formal educational attainment, years of work experience, geography, family formation, occupation, and years of work—racial and gender pay divides among workers persist. What scholars call “unexplained pay penalties,” moreover, are strikingly persistent features of the U.S. labor market, hurting women, workers of color, foreign-born workers, and LGBTQ workers and harming the labor market outcomes of those who possess multiple marginalized identities at once, as is the case of Black women.
In addition, there is evidence that higher levels of human capital are sometimes associated with even greater pay disadvantages. An analysis by Elsie Gould and Teresa Kroeger at the Economic Policy Institute finds that women workers are not only paid less than men at every level of formal education, but also that the gender pay divide actually widens as workers acquire more educational credentials. Specifically, Gould and Kroeger find that while women with a high school degree are paid about 80 percent of what men with a high school degree are paid, women with an advanced degree are paid 73 percent of what men with the same level of education are paid.
Dysfunctional behavior by some individuals is not reflective of a collective characteristic of the broader group and should not inform policy design
Negative stereotyping against discriminated groups, as well as individualistic economic frameworks, are often used to conclude that disparities in outcomes are primarily, if not solely, the result of either individual behaviors or cultural practices, with the implication that policies are most effective when designed to nudge individual behaviors without interfering in the functioning of the market. The debate over income supports in the United States, for example, is often laden with racial stereotyping that is neither reflective of the reality of low-income Americans nor conducive to fostering upward economic mobility.
Ann Cammett of the City University of New York School of Law writes about how racialized stereotypes of dysfunctional parents—such as so-called deadbeat dads or welfare queens—reduce support for policies, such as cash assistance programs, and shape these and other poverty alleviation measures. Such stereotypes eroded the size and efficiency of income support systems. This, in turn, hinders their ability to support economic security. Research shows how income supports increase earnings for low-wage workers by alleviating poverty as a foundation for upward mobility.
Then, there’s the bias evident in explanations of inequality based on individual responsibility or cultural practices. Research demonstrates how the legacy of slavery contributes to persistent racial economic inequality in the United States today, yet policies that emphasize “financial literacy” to address wealth inequality reorient the solution toward individual responsibility based on the premise that current outcomes are reflective of group-based characteristics. As Darity and Hamilton have noted, despite a widespread belief that Black households have less financial acumen, Black households save at similar rates as White households when controlling for income. Furthermore, this is the case despite low-income Americans facing significant barriers to banking access.
Conclusion
Stratification economics shifts away from explanations that center personal responsibility and cultural practices as key drivers of inequality. Instead—and using the empirically grounded tools of the economics discipline—it highlights the role of structures, institutions, exploitation, and public policy in upholding the conditions that generate inequality between groups. Stratification economics contributes to the scholarly understanding of the causes and consequences of intergroup inequality and how to address longstanding inequities to inform public policy design so that the country can reach more equitable outcomes.
Once a year, since March 2020, the U.S. Department of Commerce’s Bureau of Economic Analysis releases its data series on the distribution of growth in personal income with updated annual data from 2 years prior, providing valuable intelligence on who is benefiting from economic growth in the United States. In December 2021, the bureau released the disaggregated data on economic growth for 2019 and extended these data back to 2000.
The data are full of insights into the past 20 years of economic growth. They show, for example, that the economic policy response to the Great Recession of 2007–2009 was insufficient and left a huge number of Americans behind, and that inequality has continued to increase over the past two decades. Yet until the introduction of this new data series almost 2 years ago, federal statistical agencies essentially did not produce any comprehensive income inequality data, even though rising inequality has been a defining feature of the U.S. economy for the past 40 years.
The U.S. Census Bureau does provide data on money income, and some other releases, such as the tables released alongside the Consumer Expenditure Survey, have some distributional data, but neither provides a comprehensive look at income. Research shows that the release of economic growth statistics powerfully shapes the U.S. economic narrative. But economic growth is not a neutral concept. Devoting considerable resources to the production of national growth statistics while ignoring how that growth is distributed reflects an implicit belief that the division of growth is not particularly important.
While this may have been a defensible position in the 1950s and 1960s, when growth was broad based and most households saw increases in income that were commensurate with Gross Domestic Product growth, over the past four decades, growth has increasingly skewed toward the rich. That means that when headline growth is, say, 3 percent, it is actually usually much higher for those in the top 10 percent of households by income and lower for everyone else. This misleads U.S. households about the state of the economy, tilts economic narratives in favor of high-income households, and makes it impossible for policymakers to mount a policy response to rising inequality.
The Bureau of Economic Analysis’ distributional income data series represents a critical step in modernizing federal data for the 21st century economy, but it needs considerable development before it can be a true corrective to headline growth. A critical component is missing: speed.
Currently, the data on inequality in growth is released just once annually and on a 2-year lag. Yet for this data series to have a real impact on the economic debate, and to provide actionable intelligence for analysts and policymakers, it must come out quarterly, and it must come out on a short lag—preferably with the same latency as GDP growth, which is released on a one-month lag.
In December 2021, along with the 2019 inequality data, the Bureau of Economic Analysis also released a report on the feasibility of releasing a quarterly distribution of the data. The report also studies the feasibility of releasing more current data in a forecasting exercise that tries to predict current years and quarters of data using available data, some of which is only available on a 2-year lag. Frequency and latency of data series production are closely related, and both should be long-term goals for this data series. Unfortunately, the BEA report is largely negative on the feasibility of both these issues.
Economists at the Bureau of Economic Analysis are correct to point out the significant challenges that come with trying to create a higher-frequency and lower-latency data product, given the currently available data sources. But this report must not close off future research into such methods. Rather, this should be the start of a conversation about the resources the bureau needs to create a robust data series that will inform policymakers and the public in something close to real time.
This issue brief proceeds in three parts. First, it discusses why the federal statistical agencies must target more rapid measurement of inequality. Then, it tackles the perennial debate around rapidly released data—specifically, what is the appropriate balance between speed and accuracy? Third, it discusses some of the specific arguments the Bureau of Economic Analysis makes against the feasibility of quarterly reporting.
The brief closes with proposals for how Congress, the Biden administration, and the Bureau of Economic Analysis can work together to properly resource this work and add this important new tool to U.S. data infrastructure. Simply, it suggests that:
The bureau should scope the work of improving this data series, identify both monetary and nonmonetary resources it needs, and request those resources from Congress. In scoping the work, it should solicit advice from academics and experts on how best to leverage existing data sources to construct high-quality estimates.
Congress should work with the bureau and the Biden administration to provide the necessary resources to the bureau.
These may seem like self-evident steps forward, but decades of frozen budgets and resulting statistical program cuts have led to hesitancy within agencies to make ambitious budget requests. Congress must take the needs of a 21st century data infrastructure seriously by properly resourcing the economic statistical agencies to adopt bold new programs and hire a skilled workforce to carry them out.
Let’s turn first to why now is the time for federal statistical agencies to pursue releasing these data in as close to real time as possible.
Federal statistical agencies must pursue real time statistics now
Interest in, and demand for, real time economic statistics is booming. Throughout the coronavirus pandemic, important policy questions have hinged on having almost-immediate data. Are people spending or saving their stimulus checks? Is enhanced Unemployment Insurance discouraging workers from searching for jobs? What industries should be shut down—and which ones should be allowed to stay open—to balance the health costs of the pandemic against the need to produce critical goods and services?
Answering these questions requires a fast turnaround for economic data, and in many respects, the U.S. federal statistical system is well-positioned to provide answers. Our system of national accounts, for example, which was set up in the 1940s, recognizes the value of speed, providing estimates for current quarters just a month behind the close of the quarter. First estimates are revised many times and slowly become more accurate over time with revisions, but the system recognizes that a first estimate with some error is more valuable than no estimate at all.
Yet the limitations of our existing statistical system also are apparent amid the pandemic. Federal data are ill-suited to understanding current consumption patterns, for example, and researchers instead have turned to high-frequency transaction data from financial institutions to understand how the pandemic and its associated fiscal stimulus have affected the economy.
The pandemic underscores that federal statistical agencies should pursue more real-time data that can inform urgent policy questions. Many such measures, such as the distribution of economic growth, will prove just as interesting in normal economic circumstances as during crises like the pandemic.
Even more importantly, though, data series produced by federal statistical agencies are an important source of shared truth and academic consensus in economic measurement. If the agencies do not take advantage of modern advances in computing, modeling, and data access to release high-frequency statistics, then policymakers, the media, and the public will increasingly turn to private measurement efforts.
Academic economists are already making advances in this area. The availability of private administrative data and new measurement techniques has spawned efforts, such as Opportunity Insights’ Economic Tracker, which monitors employment at different levels of income and at granular geographic areas in close to real time during the pandemic.
These projects are incredibly useful for examining the state of the U.S. economy, but they come with significant caveats. First, private datasets sometimes disagree with one another. There are already examples of private datasets offering conflicting views of the economy. Several sources of administrative transaction data, for example, take data from banks and payment processors, including the JPMorgan Institute, Earnest Research, the many different data sources used by Opportunity Insights such as Affinity Solutions, and many more. There are several reasons these datasets may vary, but the most common reason is probably geographic or demographic bias that makes the sample unrepresentative of the U.S. population.
Second, private and academic efforts are necessarily less transparent. Academic teams are often unable to document their methodologies to the same exhaustive level of detail as federal agencies because when federal agencies need to make changes to their methodology, those changes are publicly announced and are often discussed and debated with stakeholders. Private teams may make sudden changes without carefully documenting them or making it obvious that something has changed.
Even if the methodology is well-documented and transparent, it is usually impossible for anyone outside of the academic team itself to verify results obtained using private data because the data are not widely available. This is not true of many federal datasets, which are often available to the public. When agencies use data that are not generally accessible to the public, those data are usually available to researchers at Census Research Data Centers.
One academic team is already publishing real-time inequality estimates similar to the BEA dataset on the distribution of personal income. University of California, Berkeley economists Thomas Blanchet, Emmanuel Saez, and Gabriel Zucman recently debuted their Realtime Inequality website, which provides monthly updates on income and wealth inequality in the United States. This research team provides a clear methodology and uses only government or other publicly available data sources, and the result is a transparent data series that provides valuable information on current movements in inequality.
A federal product would be even better. Federal data series go through an enormous amount of consensus-building peer review at advisory boards, academic conferences, stakeholder meetings, and more. This process provides a forum to explicitly debate important measurement choices, such as the simplifying assumptions that are used in the creation of the dataset and how to balance the latency of estimates against accuracy.
The proliferation of academic measurement efforts using private datasets and methodologies that aren’t verifiable and widely understood—while useful in the absence of federal real time data—could eventually lead to end-users cherry picking the measurement tool that best fits their ideological priorities. In the worst-case scenario, researchers could themselves be ideologically biased, and their measurements could be made using questionable assumptions that are difficult for outsiders, who don’t have access to the raw data, to assess. This underscores the important role that federal statistical agencies play in building consensus around certain data and why now is the time for them to invest in real time data collection efforts.
The appropriate balance between speed and accuracy
The BEA feasibility report from December 2021 performs two exercises to assess the potential accuracy of quarterly and lower-latency data. It concludes that, “While transparent, these forecasts have significant errors, which limit their utility to policy makers.” Before addressing the methodology of these forecasts, it is useful to establish what constitutes an acceptably accurate forecast.
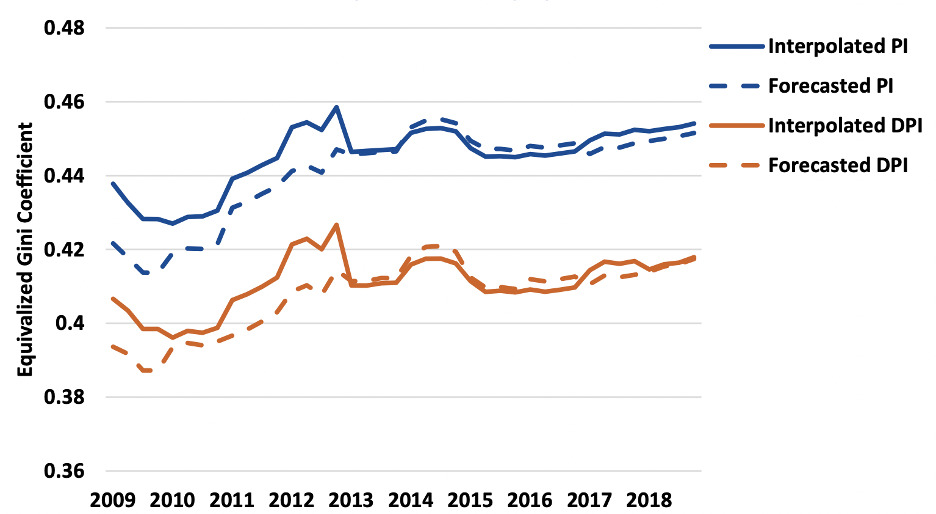
Figure 5 from the BEA report is shown below, depicting their estimates of personal income and disposable personal income. The solid lines show their annual estimates interpolated to quarterly estimates. The dashed lines are forecasts based on microdata on a 2-year lag. (See Figure 1.)
Figure 1
BEA forecasts of U.S. income inequality and growth
Gini coefficients for U.S. personal income and disposable personal income, with BEA forecasts based on lagged data versus a series based on current data with interpolation for quarterly estimates, 2009–2018
Source: Bureau of Economic Analysis, The Feasibility of a Quarterly Distribution of Personal Income (2021), p.18, Figure 5.
The Bureau of Economic Analysis says of this figure: “The forecast consistently underpredicts inequality for PI and DPI throughout the Great Recession and beginning of its recovery, while predicting fairly well during the stable growth period (2013–2018). The average forecast error for the quarters of 2009 (0.015) is larger than the growth in the Gini over the entire period (0.012).”
In other words, errors are high for the period between 2009 and 2013. Nonetheless, the series accurately captures the general trending up of inequality over the course of the recovery from the Great Recession of 2007–2009. Many parts of the U.S. statistical infrastructure deliver estimates that we know contain errors. The important question for agencies to ask is whether a noisy estimate nevertheless can provide useful information to policymakers and the public.
There is noise in this model, to be sure. In the first quarter of 2010, for example, the forecasted DPI series seems to rise sharply while the interpolated series falls slightly, indicating that this forecast was not simply the wrong magnitude but also the wrong direction of change for that particular period. These kinds of errors are more serious. When evaluating the validity of a forecasted series, agency economists should assess the extent to which a noisy series can transmit useful signal. Information on how a measurement is trending, even when levels are biased, is one such example of useful signal.
Our federal data infrastructure generally recognizes this issue. Many data series are constructed based on incomplete data and are revised multiple times, including our most foundational and important economic data series, such as GDP and employment. Analysts are aware that these datasets may be especially volatile in periods of rapid economic change. The U.S. Bureau of Labor Statistics recognized early in the pandemic, for instance, that the coronavirus could have huge impacts on the monthly Employment Situation release. It responded to this challenge transparently by educating data analysts and training its survey workers to collect more accurate information.
Recognizing the need for fast and accurate intelligence on the economic hardships faced by households during the pandemic, the U.S. Census Bureau quickly spun up two entirely new online surveys—the Census Household Pulse and the Census Small Business Pulse surveys—which track several measures of household well-being, including whether households are struggling to pay for basic expenses, food, or rent. There is some debate around how representative and accurate these data are, but in many cases, the Household Pulse has accurately tracked changes in more established data series, sometime before alternative data series were available.
None of this is meant to minimize the very real damage that can be wrought by inaccurate estimates. Large revisions to employment data series during the pandemic could erode trust in the statistical system with certain audiences. Agencies must proceed carefully. Prototype products such as the Household Pulse should be clearly labeled as experimental, and agencies should be transparent about unusual economic activity that may make data series inaccurate.
The Bureau of Economic Analysis currently describes the Distribution of Personal Income series as “prototype statistics,” as they should. The label is an acknowledgement that the possibility of error should not close off entire avenues of research.
Methods for improving income forecasts are available
The BEA feasibility report conducts two different statistical exercises to evaluate the feasibility of quarterly reporting of distributional income data. In the first forecast, the bureau simply converts its existing series from an annual one to a quarterly one by assuming that the distribution of each type of income remains constant during a year and applying these existing distributions to each of the dozens of components of quarterly aggregates for Personal Income.
In the second exercise, the bureau goes one step further, attempting to forecast future quarters using distributions from the past and new National Income and Product Accounts totals for income. As the bureau currently releases data on a 2-year lag, it attempts to forecast 2 years into the future, using distributions of income for quarter one of 2007 to predict quarter one of 2009, for example.
Both exercises assume the current distributions of the components of income will remain constant. So, if, for example, the 5th decile of income receives 6.3 percent of all wage income in the most recent year with comprehensive data, both forecasts assume that this group will continue to receive 6.3 percent of wage income and use updated aggregate earnings data from the National Income and Product Accounts to find totals for each group.
Although the methodology used in the report is an important first step, the size of errors in the BEA forecasts does not indicate that lower-latency or higher-frequency estimates are infeasible. The bureau did not consider creative ways of using existing datasets that could greatly reduce the error of current quarterly estimates. The authors of the feasibility report do acknowledge that a key to obtaining more accurate estimates is a data source available at quarterly or better frequency that distributes important income concepts so they can update these distributions more frequently. And while none of the data sources the bureau considered do exactly this, some could provide useful proxies if they are incorporated using appropriate imputation and modeling techniques.
A reasonable advance estimate of the distribution of growth does not require the bureau to have distributional data for every component of income. Compensation of employees—the name of the national accounts for employee wages, including benefits such as 401(k) contributions and employer contributions to Social Security—generally makes up about 62 percent of personal income, or about 58 percent of positive income, if you exclude the deduction for social insurance contributions. Accurately distributing this income component is the central challenge of modeling the income distribution in future periods.
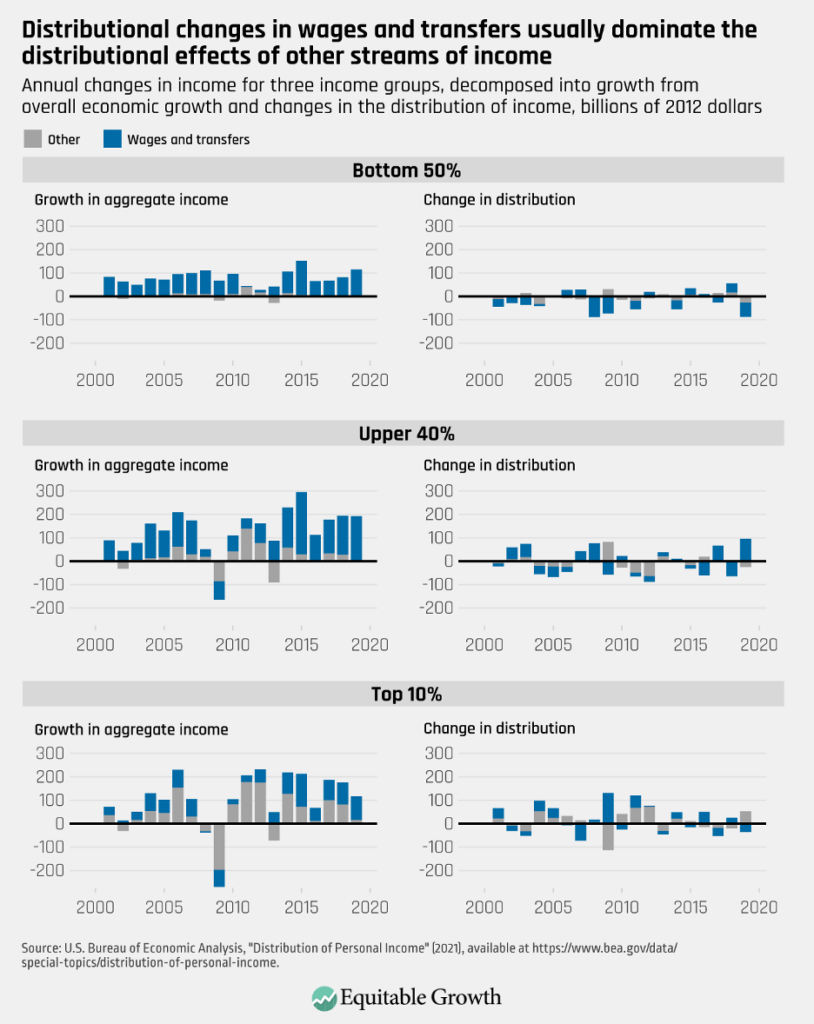
To demonstrate, I decompose annual growth for three income groups in the BEA distributing personal income product. Following UC Berkeley’s Blanchet, Saez, and Zucman, I create three income groups: the bottom 50 percent, the 50th to 90th percentile (referred to as the upper 40 percent), and the top 10 percent. In each year, I calculate what growth for the income group would have been if the distribution of all income types remained static, but aggregates are updated. The difference between this and actual income for the group in the previous period is the contribution to growth purely from economic expansion. The difference between this measure and what actually occurred is therefore attributable entirely to changes in the distribution of income. (See Figure 2.)
Figure 2
Figure 2 shows the results for all three income groups—the bottom 50 percent, the upper 40 percent, and the top 10 percent—with the contribution that comes from wages and transfers highlighted. As we can see, economic growth effects largely dominate effects from changes in the distribution. This is especially true if wages and transfers can be redistributed accurately, in which case both growth effects and the largest distributional effects could be removed as sources of error (with the caveat that an updated distribution will carry its own error), leaving only the gray portion of the bars of the right side of Figure 2 as unknown. Notably, these gray bars are larger for the top 10 percent, suggesting that it may be more difficult to make accurate estimates of this group.
Academic economists have made considerable progress on this methodological challenge. Jeehoon Han of Zhejiang University, Bruce Meyer of the University of Chicago, and James Sullivan of Notre Dame utilize the monthly Current Population Survey’s rarely used family income variable to predict poverty in current periods before the Census Bureau’s release of the annual poverty rate. An innovative paper from economist Byoungchan Lee at Hong Kong University of Science and Technology uses the Quarterly Census of Employment and Wages to measure earnings inequality in recent quarters.
Blanchet, Saez, and Zucman use Lee’s methodology to create their Realtime Inequality data series. As in the BEA forecasts, the Blanchet, Saez, and Zucman method holds the distribution for some components of income steady and distributes new aggregates according to the old, known distributions. But they also attempt to redistribute some categories in real time. Using the Quarterly Census of Employment and Wages’ granular geographic and industry breakdowns, they estimate changes in the distribution of wage income in current periods.
In its feasibility report, the Bureau of Economic Analysis notes that QCEW data are aggregated, and therefore not well-suited for distributional analysis. Yet Lee’s innovation is recognizing that although it does not contain data on individual employees, QCEW data are decomposed into more than 260,000 industry-by-county-by-ownership-type cells. This disaggregation, Lee argues, is “enough to capture major dynamics of earnings inequality.”
In fact, he is able to show that his constructed measure of earnings inequality closely follows an annual series based on the Current Population Survey’s Annual Social and Economic Supplement, which is the foundation of the BEA distributional dataset. Blanchet, Saez, and Zucman conduct their own validity check and find that their QCEW-based distribution of wages is a close match for the distribution in their primary data series based on tax data.
In addition to modeling changes in the distribution of wages, Blanchet, Saez, and Zucman also simulate changes in government transfers in real time. Although transfers are less than a third of the size of wages, they are the second-largest source of income for U.S. households and are especially important for households in the bottom of the income distribution: They make up a larger percentage of income than wages for the bottom three deciles. Moreover, transfer policies may change quickly when the economy is in recession, and the federal government swoops in to prop up struggling households. These policies can have a significant impact on inequality.
Blanchet, Saez, and Zucman account for this by simulating the distribution of government transfers using the known rules of each transfer program. The first round of pandemic stimulus checks, for example, sent out in late 2020, amounted to $1,200 for individuals and $2,400 for couples below a certain income threshold, allowing Blanchet, Saez, and Zucman to simulate the distribution of these checks in their microdata. They similarly simulate the impact of the Paycheck Protection Program—notably, they use program incidence information from a 2022 working paper that would not have been available if these measures were live in 2021—and the expanded Earned Income Tax Credit and Child Tax Credit.
Adjusting the distribution of wages and transfers leaves just the capital income components of Personal Income: rental income of households, household income receipt on assets, and proprietors’ income. To my knowledge, no researcher has yet identified datasets that could be used to calculate new distributions of these income categories in current periods.
Blanchet, Saez, and Zucman simply age previous distributions of these income sources forward. Rental income is the smallest source of income for households, at just 3.7 percent of total Personal Income. Proprietors’ income represents 8.7 percent of total Personal Income and is especially important to incomes in the top decile, where it represents 18.8 percent of Personal Income in 2019. The last bit of capital income is returns on assets, composed of interest and dividends income. This is the largest pot of capital income, representing 15.8 percent of all income and representing more than a quarter of all income for the top decile.
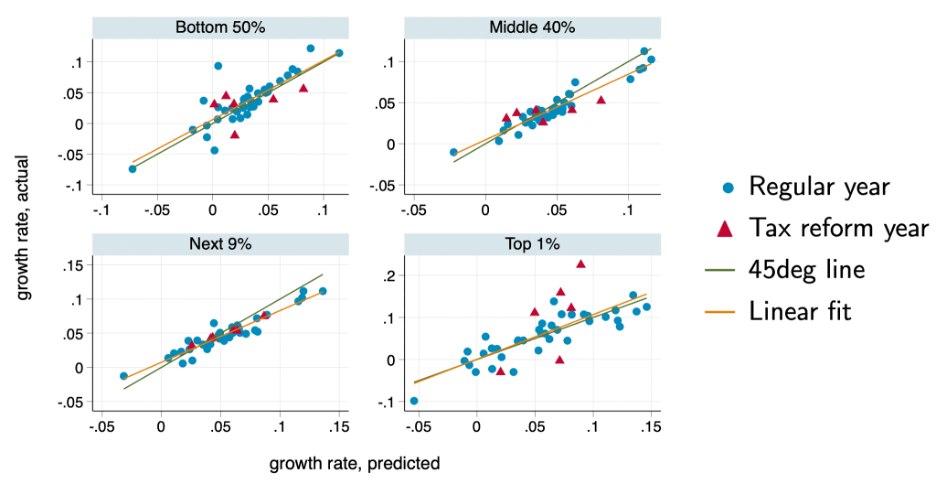
The overall accuracy and usefulness of the Blanchet, Saez, and Zucman model should be subject to scrutiny, but the initial results are promising. They are frequently able to closely predict the magnitude and direction of income growth for different groups. In 43 annual predictions of growth in the time period that is 1 year ahead of their current tax data, they rarely predict the wrong direction for growth for the four groups they analyze—the bottom 50 percent, the 50th to 90th percentile, the 90th to 99th percentile, and top 1 percent of the income distribution.
There are nonetheless significant errors in some years. While plots of their predicted growth against actual growth show mostly dots near a 45-degree line—a dot directly on the 45-degree line is a perfectly correct prediction—there are occasional outliers. In some cases, Blanchet, Saez, and Zucman’s predictions are several percentage points different from actual growth, and their predictions are less accurate at the top of the income distribution, as seen in Figure 3 from their paper, reproduced below. (See Figure 3.)
Figure 3
The Blanchet, Saez, and Zucman Realtime Inequality data series uses novel methods to predict U.S. income growth in real time
Realtime Inequality’s predicted income growth rates, compared to actual income growth rates, for four income groups in the United States
Source: Thomas Blanchet, Emmanuel Saez, and Gabriel Zucman, “Real-Time Inequality.” Working Paper (2022), available at https://realtimeinequality.org/methodology/.
Blanchet, Saez, and Zucman’s methodology for distributing wage income in current quarters, despite these issues, is an excellent starting point for building a data series with current years and quarterly data.
In the BEA feasibility report, the authors outline what an ideal data source would look like. It would be a panel. It would include joint distributional information for transfers and wages. And it would have a quarterly release cadence. There is no data source that meets all these criteria, but economic measurement is often based on incomplete data and a reasonable set of assumptions. The Bureau of Economic Analysis should explore whether simulation and imputation based on data sources, such as the Quarterly Census of Employment and Wages, can help reduce forecasting error.
Conclusion and recommendations
U.S. economist Simon Kuznets first produced the National Income accounts in 1934. In the nearly nine decades since, these statistics—which are now produced in the United States by the Bureau of Economic Analysis and have spread to the rest of the world—have arguably had a greater impact on the theory and practice of economic policy than any other economic data series.
Kuznets was keenly aware of the limitations of national accounting. In addition to the oft-repeated quote that “The welfare of a nation can, therefore, scarcely be inferred from a measurement of national income,” he also observed that “Economic welfare cannot be adequately measured unless the personal distribution of income is known.” That sentiment has only become more accurate over time as the broad-based growth of the 1950s and 1960s has given way to starkly unequal growth over the past four decades.
Kuznets’ admonitions remain relevant today. To understand how the economy is performing for U.S. households, it is imperative to add distributional data to the existing national accounts data. These should be produced at intervals comparable to GDP growth so that aggregate growth and the distribution of it can be analyzed jointly and on even footing with one another.
The purpose of the federal statistical system is to provide a reliable, transparent, nonpolitical set of measurements to analyze, discuss, and debate. But the system cannot serve this purpose if it cedes certain types of economic measurement to academics and private research groups. Federal agencies must respond now to the demand for more real time data.
Doing so will require the Biden administration and Congress to devote more resources to this effort. The Realtime Inequality dataset was created by a team of economists who have been producing distributional growth estimates for more than a decade and who have access to IRS tax data that the Bureau of Economic Analysis does not. The Federal Reserve produces a similar product called the Distributional Financial Accounts. The working paper that introduced these accounts had 12 co-authors. By comparison, the BEA estimates are mostly developed by two economists at the agency.
Insufficient resources are the biggest impediment to further development of the data series. While the Bureau of Economic Analysis has taken the first steps by conducting a feasibility study using fairly naive forecasting techniques, more sophisticated forecasting techniques and data work will be necessary to increase the utility and quality of these estimates—meaning more economists’ time must be spent on this work—and as such, the bureau will require more funding.
The BEA feasibility report does not directly address the question of what resources the agency needs to more aggressively develop the distributing personal income series, but the necessary sums are likely not large. The BEA budget is just more than $100 million total, a relatively small amount of money for the federal budget. The bureau must scope the work, with the assistance of academics and other experts where appropriate. Where current resources are insufficient, it should identify the resources it and other federal statistical agencies need and communicate these needs to their parent departments and to Congress, preferably in the Biden administration’s annual budget documents.
The U.S. Commerce Department’s next budgetary request should explicitly include funding for this project, alongside a description of how the Bureau of Economic Analysis plans to expand and improve upon the data. If the Commerce Department or the bureau do not scope this work and provide an estimated budget for it, members of Congress should request it. Any member of Congress who believes that inequitable growth is hindering the broader economy must take steps to ensure the federal statistical agencies can properly measure its impact across the income distribution.
Equitable Growth is committed to building a community of scholars working to understand how inequality affects broadly shared growth and stability. To that end, we have created the monthly series, “Expert Focus.” This series highlights scholars in the Equitable Growth network and beyond who are at the frontier of social science research. We encourage you to learn more about both the researchers featured below and our broader network of experts.
February is Black History Month in the United States. While we celebrate the vast contributions of African Americans to our economy, society, and culture, we must also consider the disparities, discrimination, and divides that continue to disproportionately harm Black individuals and communities in the United States. It is essential for all of us to acknowledge and address the continuing effects of institutional racism—not just during one month of the year, but always.
We at Equitable Growth can work—and are working—toward this goal by supporting Black scholars at various career stages and fostering more diversity in economics. Centering Black voices and making space for Black experts to share their knowledge and lived experiences is a key step in the process of enacting real structural change. This is exactly the goal of a new book edited by Anna Gifty Opoku-Agyeman, titled The Black Agenda: Bold Solutions for a Broken System. This compilation of essays shares the anti-racist ideas and proposals of Black experts and scholars seeking change across policy areas, from macroeconomics to climate change, and from the criminal legal system to the health care system.
This month’s edition of Expert Focus highlights six scholars who contributed chapters to The Black Agenda, showcasing their expertise in various policy and research areas and highlighting their ideas to reduce racial disparities in the United States, thus fostering strong, stable, and broad-based economic growth. Though we selected the following six scholars for this installment, we encourage you to explore the work of all the essayists, many of whom were featured in prior Expert Focus installments.
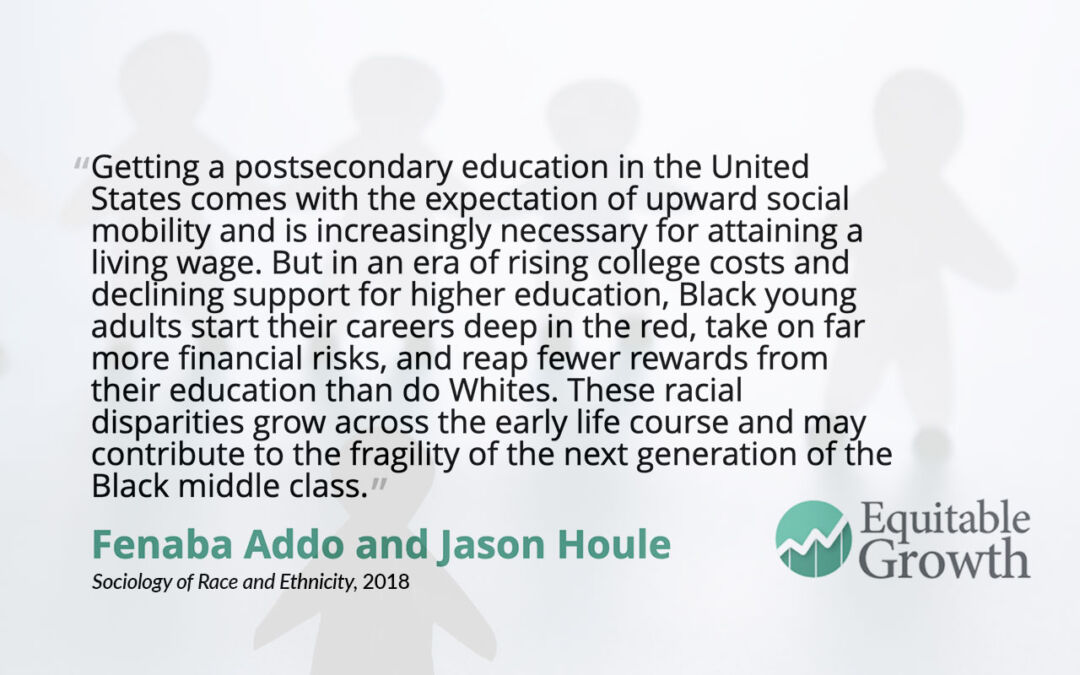
Fenaba Addo
University of North Carolina, Chapel Hill
Fenaba Addo is an associate professor of public policy at the University of North Carolina, Chapel Hill. Her research lies in the areas of debt and wealth inequality, economic strain as a social determinant of health and well-being, and union formation, with a focus on societal inequities stemming from historical and structural racism. In recent years, she has written extensively on the racial disparities in student loan debt, and in 2020, she received an Equitable Growth grant to examine the impact of debt-free tuition assistance on educational outcomes for students who transfer from a two-year to four-year college. In The Black Agenda, Addo illustrates how student loan debt is both a higher education issue and a wealth-building one, writing that Black students at all levels take on more debt and have higher default rates than their White peers. In fact, her research shows that if young adult Black and White students had an equal debt burden, the racial wealth divide in the United States would decrease by approximately 10.5 percent.
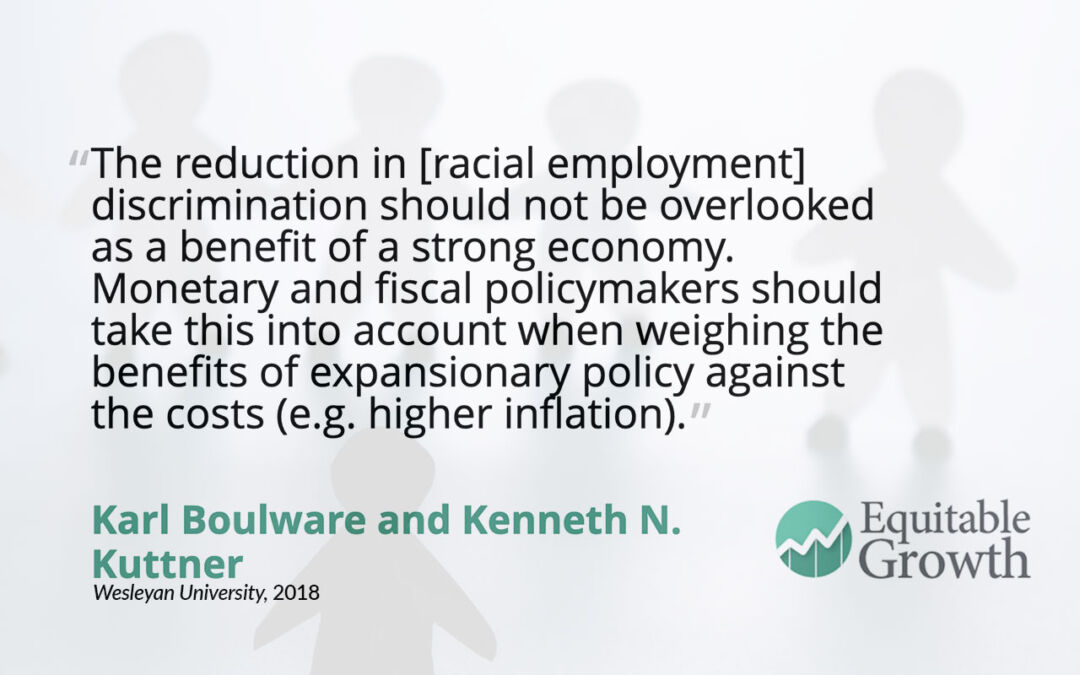
Karl Boulware
Wesleyan University
Karl Boulware is an assistant professor of economics at Wesleyan University. His research interests are in monetary economics, macroeconomics, and financial economics. Recently, he published work on racial wealth stratification and investment portfolio decisions in the United States as well as on the links between labor market conditions and racial discrimination claims. In The Black Agenda, Boulware’s chapter focuses on how U.S. monetary policy and the Federal Reserve must center its monetary policymaking on Black workers to ensure lasting economic growth and recovery. He urges the Federal Open Market Committee—the Fed’s monetary policymaking committee—to adopt a new long-term framework that enhances equal opportunity and reduces racial disparities in the U.S. labor market, allowing Black workers to share in the country’s economic prosperity.
Carycruz Bueno
Wesleyan University
Carycruz Bueno is an assistant professor of economics at Wesleyan University. Her research and teaching focus is on microeconomics, labor economics, race and education policy, education inequality, and health economics. Her recent work looks at the impact of enrollment in virtual school on student outcomes and how teacher pay differentials affect recruitment and retention. In The Black Agenda, Bueno and her co-author—her sister, economist Caridad Cruz Bueno at the State University of New York —write about the coronavirus pandemic’s impact on schooling. Existing racial inequities in U.S. education—including in school funding, access to pre-Kindergarten, advance-course options, high-quality teachers, and well-resourced facilities—meant COVID-induced disruptions created disproportionate challenges for Black students. They recommend a national response that addresses structural racism in education, including targeted interventions for and investments in Black and low-income students, and culturally responsive social justice curriculum and anti-bias training for teachers.
Tressie McMillan Cottom
University of North Carolina, Chapel Hill
Tressie McMillan Cottom is an associate professor at the University of North Carolina, Chapel Hill and a contributing opinion writer to The New York Times. Her writing focuses on technology, higher education, and racial and gender inequality, with her most recent book exploring the everyday culture of themes such as racism, sexism, inequality, and oppression, and how Black women navigate U.S. society. In 2020, she received a MacArthur Foundation Fellowship for her work that shapes the public discourse on class, race, gender, and digital technology. In the foreword to The Black Agenda, Cottom writes that there can be no progress, and no progressive agenda, in the United States without first recognizing and agreeing upon the debt owed to Black Americans because of racial capitalism. She argues that there is a critical need to align our economic behaviors with our cultural and social values. Developing anti-racist ideas and proposals—ideas and proposals this Expert Focus installment aims to elevate—involves centering upon Black lives and experiences, she explains, which is key to effectively creating structural change in the United States.
Jevay Grooms
Howard University
Jevay Grooms is an assistant professor of economics at Howard University and currently a visiting faculty and scholar at the University of Southern California. Her research lies at the intersection of public economics, health economics, and poverty and inequality. Specifically, she is interested in the impediments to the adequate delivery of health care among underserved communities with a focus on the role of wealth inequality on health outcomes among people of color. In The Black Agenda, Grooms addresses the wellness angle of the intersection of race, gender, and class, along with structural racism within the U.S. health care system. Her research on the pandemic’s effect on the mental health of essential workers, for example, shows that workers of color disproportionately displayed symptoms of anxiety and depression. Grooms’ chapter illustrates how unequal access to healthcare and mental health services, including substance abuse treatment, harms Black Americans more than their peers.
Hedwig Lee
Washington University in St. Louis
Hedwig Lee is a professor of sociology at Washington University in St. Louis, where she also is the co-director of the Center for the Study of Race, Ethnicity, and Equity. Her research centers on the social determinants and consequences of population health and health disparities, focusing on race and ethnicity, poverty, and the family. Her recent work looks at the impact of structurally rooted and race-related chronic stressors, such as mass incarceration, on health outcomes. In The Black Agenda, Lee continues to examine mass incarceration and its effects, specifically on Black families and Black women in particular, as the carceral system would not function without the labor of those on the inside alongside the financing from families for food and essentials for inmates and housing and health care support upon their release. She proposes that any policies aimed at improving the mental and physical health of the incarcerated must also incorporate and even center around the women and families connected to those in prison.
Equitable Growth is building a network of experts across disciplines and at various stages in their career who can exchange ideas and ensure that research on inequality and broadly shared growth is relevant, accessible, and informative to both the policymaking process and future research agendas. Explore the ways you can connect with our network or take advantage of the support we offer here.
Every school day, millions of students at public and private, nonprofit schools across the United States enjoy free or low-cost meals supported by the National School Lunch Program and School Breakfast Program. These programs are important complements to other anti-hunger and anti-poverty programs in the United States, such as the Supplemental Nutrition Assistance Program (formerly known as food stamps). Prior to pandemic-related disruptions to education beginning in 2020, these school meal programs fed 30 million and 15 million students, respectively, each year.
While advocates continue to push for improvements to the programs, including lower costs to families and more nutritious meal options, school meal programs serve an important role in our national education system: They ensure that students can get through the day with full bellies and the fuel they need to focus on their lessons.
It’s difficult to imagine a school without these meal options today, but they are, in fact, relatively recent advancements in the long history of public education in the United States. The School Breakfast Program, for example, was not permanently authorized until 1975—more than a century after the widespread expansion of public education across the country.
The program’s enactment didn’t come easily. Black activists—including civil rights leaders, the NAACP, and the often-demonized Black Panther Party—were instrumental in pushing policymakers in their neighborhoods and the halls of Congress to address the growing problem of hunger in their communities. In the absence of government support, these activists worked to establish their own meal programs—most notably the Black Panthers’ free breakfast program—and engaged in direct advocacy that inspired, shamed, and eventually spurred policymakers into action.
These efforts have fed generations of students, helping them focus in school and setting them on a path to longer-term productivity and economic security. In this column, we examine the activism that led to the expansion of government-provided school meal programs, as well as the long-run impact on students across the United States.
Black activists fed their communities while advocating for broader, permanent reform
The Black Panthers’ free breakfast program—similar to its other survival programs, including free medical research health clinics, free ambulance services, and free clothing services—was born out of material necessity. In 1969—the year that the Black Panther Party served its first free breakfast at St. Augustine’s Church in Oakland, California—around 1 in 3 Black Americans had incomes that fell below the poverty line, or approximately triple the poverty rate of White Americans. The effects of not being able to afford to put food on the table for children was described as one member of the Party in this way:
The teacher teaches, using examples and talks about taking 14 apples and dividing them with 7 friends and ending up with 2 apples apiece. At the sound of the word apple, the Black child’s face looks up and seems to know what she’s talking about, but soon his mind returns to the 14 apples and he wishes he had something to eat … the result is that the child falls farther behind. The root cause of this problem is not mental incapabilities or cultural deprivation, but hunger.
Another member of the Party posed the question, “How can a person be expected to pay attention and learn about history, math, science, and other subjects that are abstract to his reality when his mind is concentrating on a very real and concrete problem? Where is the next meal coming from?”
Important government action in the 1960s helped to alleviate poverty across the United States. The Federal Labor Standards Act, for example, was amended in 1967 to cover a larger share of the U.S workforce, including industries where Black workers were overrepresented, such as agriculture, nursing homes, laundries, hotels, restaurants, schools, and hospitals. President Lyndon Johnson’s “War on Poverty” in the 1960s also established landmark programs, such as Medicare, Medicaid, and Head Start, and expanded Social Security—all of which were critical to improving economic conditions for Black Americans but were not without limitations (for example, the failure to include policies advocated at the time, such as a jobs guarantee).
While the War on Poverty took the important action of making the food stamps program permanent, the program was unable to fully address pervasive hunger, meaning that children across the country continued to arrive at school hungry each morning. The Black Panthers’ free breakfast program thus filled a void left by existing government programs and rapidly grew in popularity and reach. The first day the program was in operation, it served 11 children. By the end of its first week, the program was serving 135 children daily at St. Augustine’s. In 1969, the program fed more than 20,000 children nationally. At its height between 1969 and 1971, the organization was operating at least 36 free breakfast programs nationwide, with larger chapters running multiple sites.
The popularity and effectiveness of this program did not go without notice, and for a government that saw the Black Panthers as a direct threat to a status quo of White supremacy, this was a source of alarm more than inspiration. In a 1969 congressional hearing, California assemblyman Jess Unruh put it bluntly: “I do not say this in defense of the organization. I say it by way of warning …The Black Panthers have supplied more free breakfasts than the Federal Government has.”
While it may be an overstatement to draw a direct line between the Black Panthers’ free breakfast program and the permanent establishment of the federal School Breakfast Program, the Black Panthers nevertheless provided a template for addressing community needs, as well as the motivation for a swifter government response. According to Joshua Bloom of the University of Pittsburgh and Waldo E. Martin Jr. of the University of California, Berkeley, government-sponsored breakfast programs took off around the same time that the Black Panthers were expanding their own breakfast program. In 1972, the federal government was feeding 1.18 million children—a significant improvement for a program that had only received $600,000 in funding just 5 years prior but still far short of the nearly 5 million qualifying children.
The Black Panthers were not the only ones to advocate for the importance of food programs during this time. Many Black activists, for example, testified before the U.S. Senate Select Committee on Nutrition and Human Needs chaired by Sen. George McGovern (D-SD), and, in a series of hearings in the spring of 1970, some of the nation’s most prominent civil rights leaders stood before the committee to make the case for urgent government action to address childhood hunger.
At a February 1970 hearing, for example, the NAACP director of South Carolina, Rev. I. DeQuincey Newman, said that no county in South Carolina was “devoid of the problems of hunger, malnutrition and bad housing conditions in both cities and rural areas.” On May 14, Rev. Ralph David Abernathy, the president of the Southern Christian Leadership Conference, pointed out gross deficiencies in President Richard Nixon’s existing food programs. And in a July hearing, Jean Fairfax, former chair of the Committee on School Lunch Participation and an NAACP lawyer, testified that school meal programs were underserving as many as 23 million children.
The school food movement continues to this day, boosting human capital development and long-term economic growth
As a whole, pressure from these activists and others was an important part of the effort to expand the federal School Breakfast Program and make it a permanent government policy. While President Harry Truman established the National School Lunch Program in 1946, providing free or reduced-cost lunches at public and nonprofit schools, it was not until 1975 that the federal government permanently instituted the School Breakfast Program as a resource to support vulnerable children—a move prompted by the work of Sen. McGovern’s committee to expand the initial pilot program.
Since then, policymakers and advocates have continued the work spurred on by Black activists to reform and improve these school meal programs so that no child has to go to class hungry. In 1994, for example, a number of changes were made to the National School Lunch Program, primarily emphasizing the need to standardize the nutritional quality of school meals. Then, in December 2010, Congress passed the Healthy, Hunger-Free Kids Act, reauthorizing the school meal programs and focusing on improving children’s access to nutritious foods and promoting healthy eating and physical activity. This revision of standards—which required meals to contain more fruit, vegetables, and whole grains, while also limiting the amount of calories, saturated fats, and sodium in the meals—was the first overhaul of requirements in more than 15 years.
The federal government has also integrated student health and school wellness into policy and practice through the Every Student Succeeds Act, recent legislation that amended school policy in the United States. Through this act, Congress provided additional funding for lunch programs and created a universal meal option—the Community Eligibility Provision—which allows high-poverty schools to offer breakfast and lunch at no charge to all students, thus eliminating the traditional school meal application process.
These policies meet a basic human need while helping students succeed in the classroom, strengthening the human capital of tomorrow’s workforce and ensuring a more vibrant economic future for us all. Research shows that eating breakfast before school can improve memory, alertness, mood, and school attendance among students. A 2016 study of the School Breakfast Program finds that policies requiring schools to offer breakfast were associated with healthier eating and even improvements in students’ math scores.
These findings are not surprising in light of the broader literature on similar policies. The school lunch and breakfast programs act both as nutritional support and income support as they offset families’ food costs and allow them to divert limited resources to address other needs. These are the same mechanisms through which the Supplemental Nutrition Assistance Program promotes long-term economic growth and well-being. A 2020 working paper by Martha Bailey, Hilary Hoynes, and Maya Rossin-Slater demonstrates that children with early access to these supports grow up to be better-educated and live healthier, longer, and more productive lives. These school meal programs, championed by Black activists for decades, may offer similar benefits as they feed more children consistently throughout the school year.
Conclusion
Today, the National School Lunch Program and School Breakfast Program feed tens of millions students every day with low-cost or free nutritionally balanced meals. While these school meal programs have been a tremendous resource for low-income and disadvantaged children, they alone are not the silver bullet for eliminating childhood hunger in the United States.
In 2020, 14.8 percent of households with children, disproportionately Black and Latino, were food-insecure. Along with school meal programs, income supports, such as SNAP and the expanded Child Tax Credit, have been shown to meaningfully reduce childhood hunger. Supporting school meal programs while expanding access to and duration of these income supports are critical policy tools for continuing to lower U.S. child poverty rates and setting more children on the path to a healthier, more productive future.
The revolutionary anti-hunger work of the Black Panthers and other Black activists demonstrates the power that community advocacy can have on national issues. Reacting to centuries of legalized harm and government inaction that led to poverty and hunger among Black, Indigenous, and other people of color, these activists engaged in mutual aid efforts and direct political advocacy that has helped feed the children of millions of U.S. families.
Faced with inaction, these activists made the urgency of the issue impossible to ignore and showed policymakers what a community-driven response can look like. The best way for policymakers to honor their legacy and historical contribution this Black History Month and beyond is to ensure that such efforts will no longer be necessary, and that no child, of any race or socioeconomic status, has to wonder where their next meal will come from.
U.S. history is rife with examples of groups and individuals upending their lives and migrating in search of better economic opportunities for themselves, their families, and their descendants. This process of “moving to opportunity” still occurs to this day, and it motivates a number of policies that attempt to combat poverty by helping families move away from disadvantaged neighborhoods.
One of the largest and most economically powerful instances of moving to opportunity was the Great Migration, when 6 million southern African Americans migrated to the North between roughly 1916 and 1970 to escape racial prejudice and a lack of upward mobility. During the Great Migration, the northern United States was rightfully considered a promised land for Black Americans, and research documents that Black people who migrated to the North made almost double what their southern counterparts did.
Yet despite these immediate returns to migrating, academics and policymakers alike are still left wondering if the descendants of these Black Americans prospered as their forebearers did. Were they able to “inherit” their parents and grandparents’ hard-fought mobility? Or did the gains from growing up in the North change for their children, grandchildren, and great-grandchildren?
I address these questions in my new article in the American Economic Review, “Can You Move to Opportunity? Evidence from the Great Migration,” and in my working paper included in Equitable Growth’s Working Paper series. I find that northern backlash to the second wave of the Great Migration (between 1940–1970) turned the promised land into a mobility trap for future generations of Black children. My study looks at all major non-southern cities that received Black migrants during the Great Migration—most famously Detroit, Baltimore, Chicago, and Pittsburgh—but also less major destinations across the Northeast, Midwest, and West. (See Figure 1.)
Figure 1
I find that while the first generation of migrants profited from a mass exodus from the South, the gains they accrued and hoped to pass on to their children were slowly eroded away by a multitude of factors. This resulted in a stark negative relationship between Great Migration inflows and upward mobility. The reactions of incumbent residents in northern cities to the migration were so corrosive and debilitating that outcomes for the third generation of Black Americans in the North are the same as, if not worse than, that of southern Black children whose grandparents did not move to opportunity.
To put it more quantitatively, I find that a one standard deviation increase in the Black population share of destination cities is associated with an 11.3 percent drop in adult income. And, in the absence of this backlash, the Black-White upward mobility gap in the North would be 27 percent smaller. (See Figure 2.)
Figure 2
Admittedly, this effect of the Great Migration could reflect changes in the composition of families in destination locations. It’s possible, for example, that after the Great Migration, families who tended to secure good opportunities for their children left the area, and only families who struggle were left behind. In this scenario, the Great Migration changed nothing about the environment for families—it simply changed who lives there.
Alternatively, could the Great Migration have changed the destination locations themselves, such that they no longer promoted good outcomes for children? In my working paper, I conduct a second analysis that answers this question, examining the impact of additional years of childhood spent in a Great Migration city, all else being equal. This analysis identifies the effect of the move to opportunity through changes in the environment for families. Critically, I find that the effect of spending an entire childhood in a Great Migration commuting zone accounts for all of the Great Migration’s negative impact on upward mobility. In essence, this firmly establishes location effects as the force behind low mobility in Great Migration commuting zones. (See Figure 3.)
Figure 3
One particularly interesting discovery of the project is that the effects of the Great Migration are not homogeneous across gender and race. In fact, the negative income effects of the migration are mainly concentrated among Black men, and the effects we see among comparable White men and women are far more muted. This provides a nice check to ensure that our results are being driven by responses to the Great Migration and not mass deindustrialization, which began to affect residents of northern cities toward the end of the Great Migration. (See Figure 4.)
Figure 4
These results naturally lead to the question of why Black men were affected so much more by the migration than Black women? The first explanation is that Black women tend to form households with Black men, and as a response to the diminished income of Black men in Great Migration commuting zones, Black women may have increased their labor supply to recover this missing income. A second explanation is rooted in literature showing that boys are far more sensitive to environmental characteristics such as school quality and the presence of two-parent households than girls are.
When I explore these two mechanisms, I find that Black women did not report higher earnings or more hours worked due to the Great Migration. But I do find that the Great Migration is associated with growing up in single-parent homes for Black men and women. I also discover that Black men from low-income backgrounds have worse educational outcomes in commuting zones that were more affected by the Great Migration.
My paper also provides a glimpse of some of the potential mechanisms behind the decline of Great Migration destinations. The portrait is one of urban decline matched with particular civic responses to social problems in cities. In the wake of the Great Migration, northern cities funneled public funds toward policing while investment in social infrastructure stagnated. Simultaneously, White flight to the suburbs and an overall erosion of the urban environment helped transform destination metropolises of the 1940s and 1950s into highly segregated opportunity deserts by the 1990s and 2000s. (See Figure 5.)
Figure 5
Conclusion
It would be disingenuous to claim, based on the backlash to the Great Migration, that this mass movement to opportunity by Black Americans was a mistake. After all, the children and grandchildren of migrants benefited from growing up in higher-income families than if their parents and grandparents had remained in the South. Furthermore, other research also shows that the Great Migration was important for changing the political landscape in the United States and increasing support for civil rights legislation.
But when destination cities in the North were in need of wide-ranging support to combat economic decline, increased racial segregation, and general social disintegration, they were left to fend for themselves. To put it plainly, we, as a nation, failed them.
Today’s solution of small-scale housing lotteries that allow a small fraction of families to escape disadvantaged neighborhoods is inadequate for making up for these decades of neglect. Instead, it is imperative that policymakers also commit to raising people up and supporting communities where they are. We owe at least that much to the millions of Black Americans who braved a long and harsh journey North in search of the American Dream.