JOLTS Day Graphs: November 2021 Edition

Every month the U.S. Bureau of Labor Statistics releases data on hiring, firing, and other labor market flows from the Job Openings and Labor Turnover Survey, better known as JOLTS. Today, the BLS released the latest data for November 2021. This report doesn’t get as much attention as the monthly Employment Situation Report, but it contains useful information about the state of the U.S. labor market. Below are a few key graphs using data from the report.

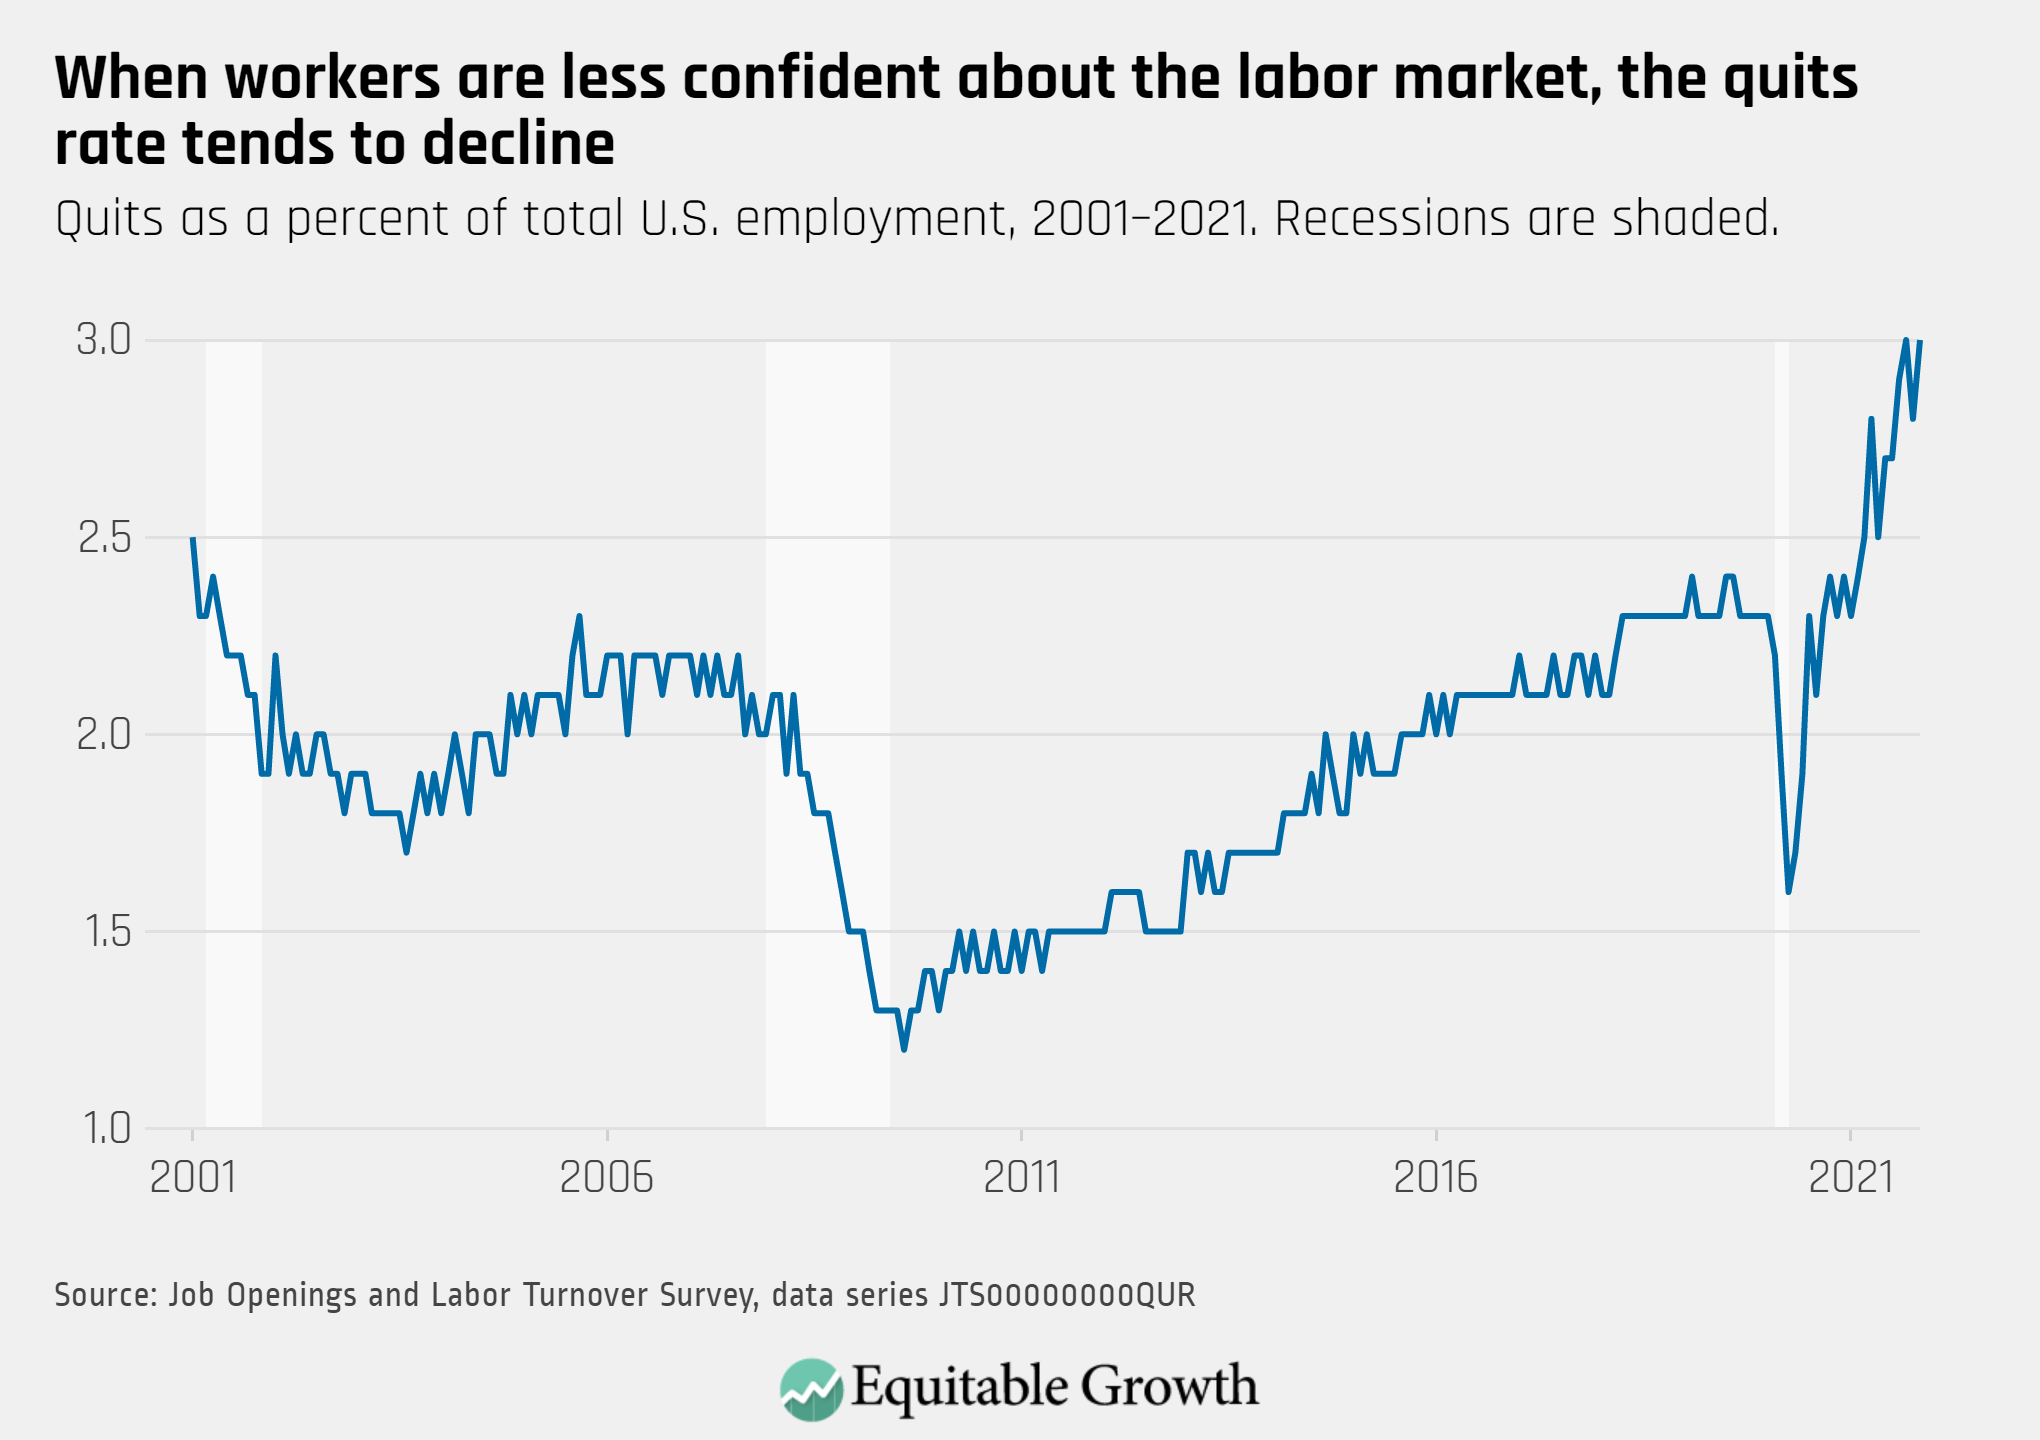
The quits rate rose in November to 3.0 percent as 4.5 million workers quit their jobs, an increase of 370,000 since October, while the job openings rate fell to 6.6 percent.

Quits as a percent of total U.S. employment, 2001–2021. Recessions are shaded.

The vacancy yield increased to 0.63 in November from a series low of less than 0.59 in October, as job openings decreased to 10.6 million.

U.S. total nonfarm hires per total nonfarm job openings, 2001–2021. Recessions are shaded

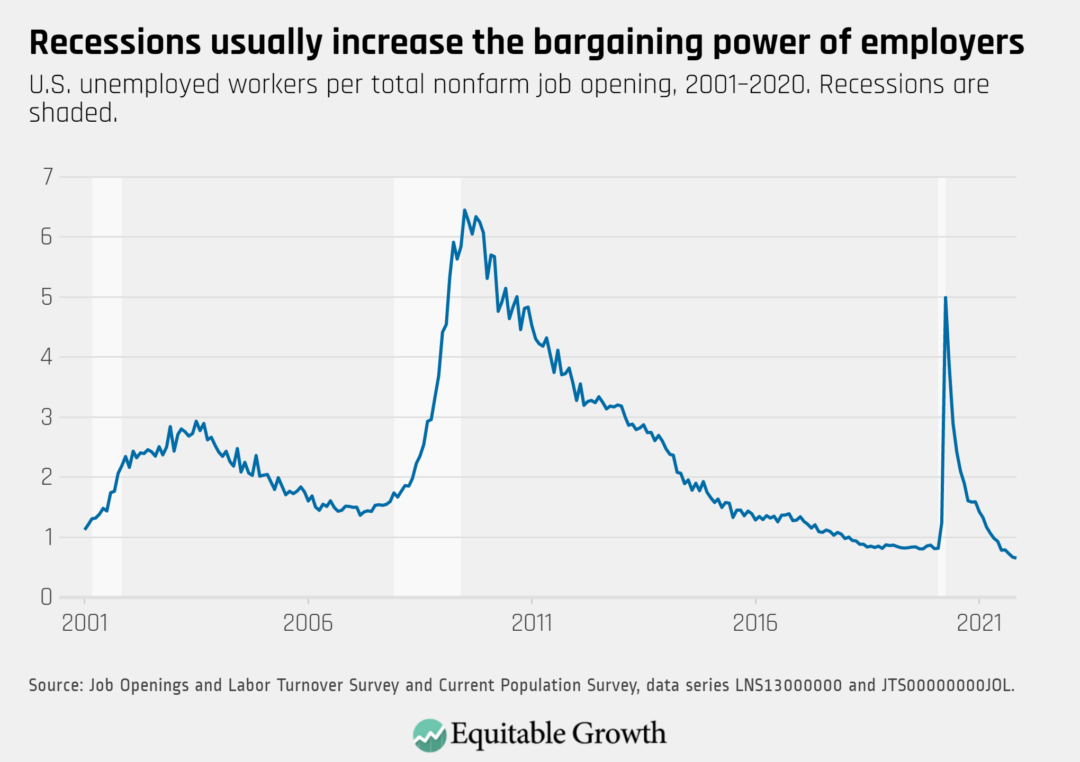
The ratio of unemployed-worker-per-job-opening fell further, from 0.67 unemployed workers per job opening in October to 0.65 in November.

U.S. unemployed workers per total nonfarm job opening, 2001–2020. Recessions are shaded.

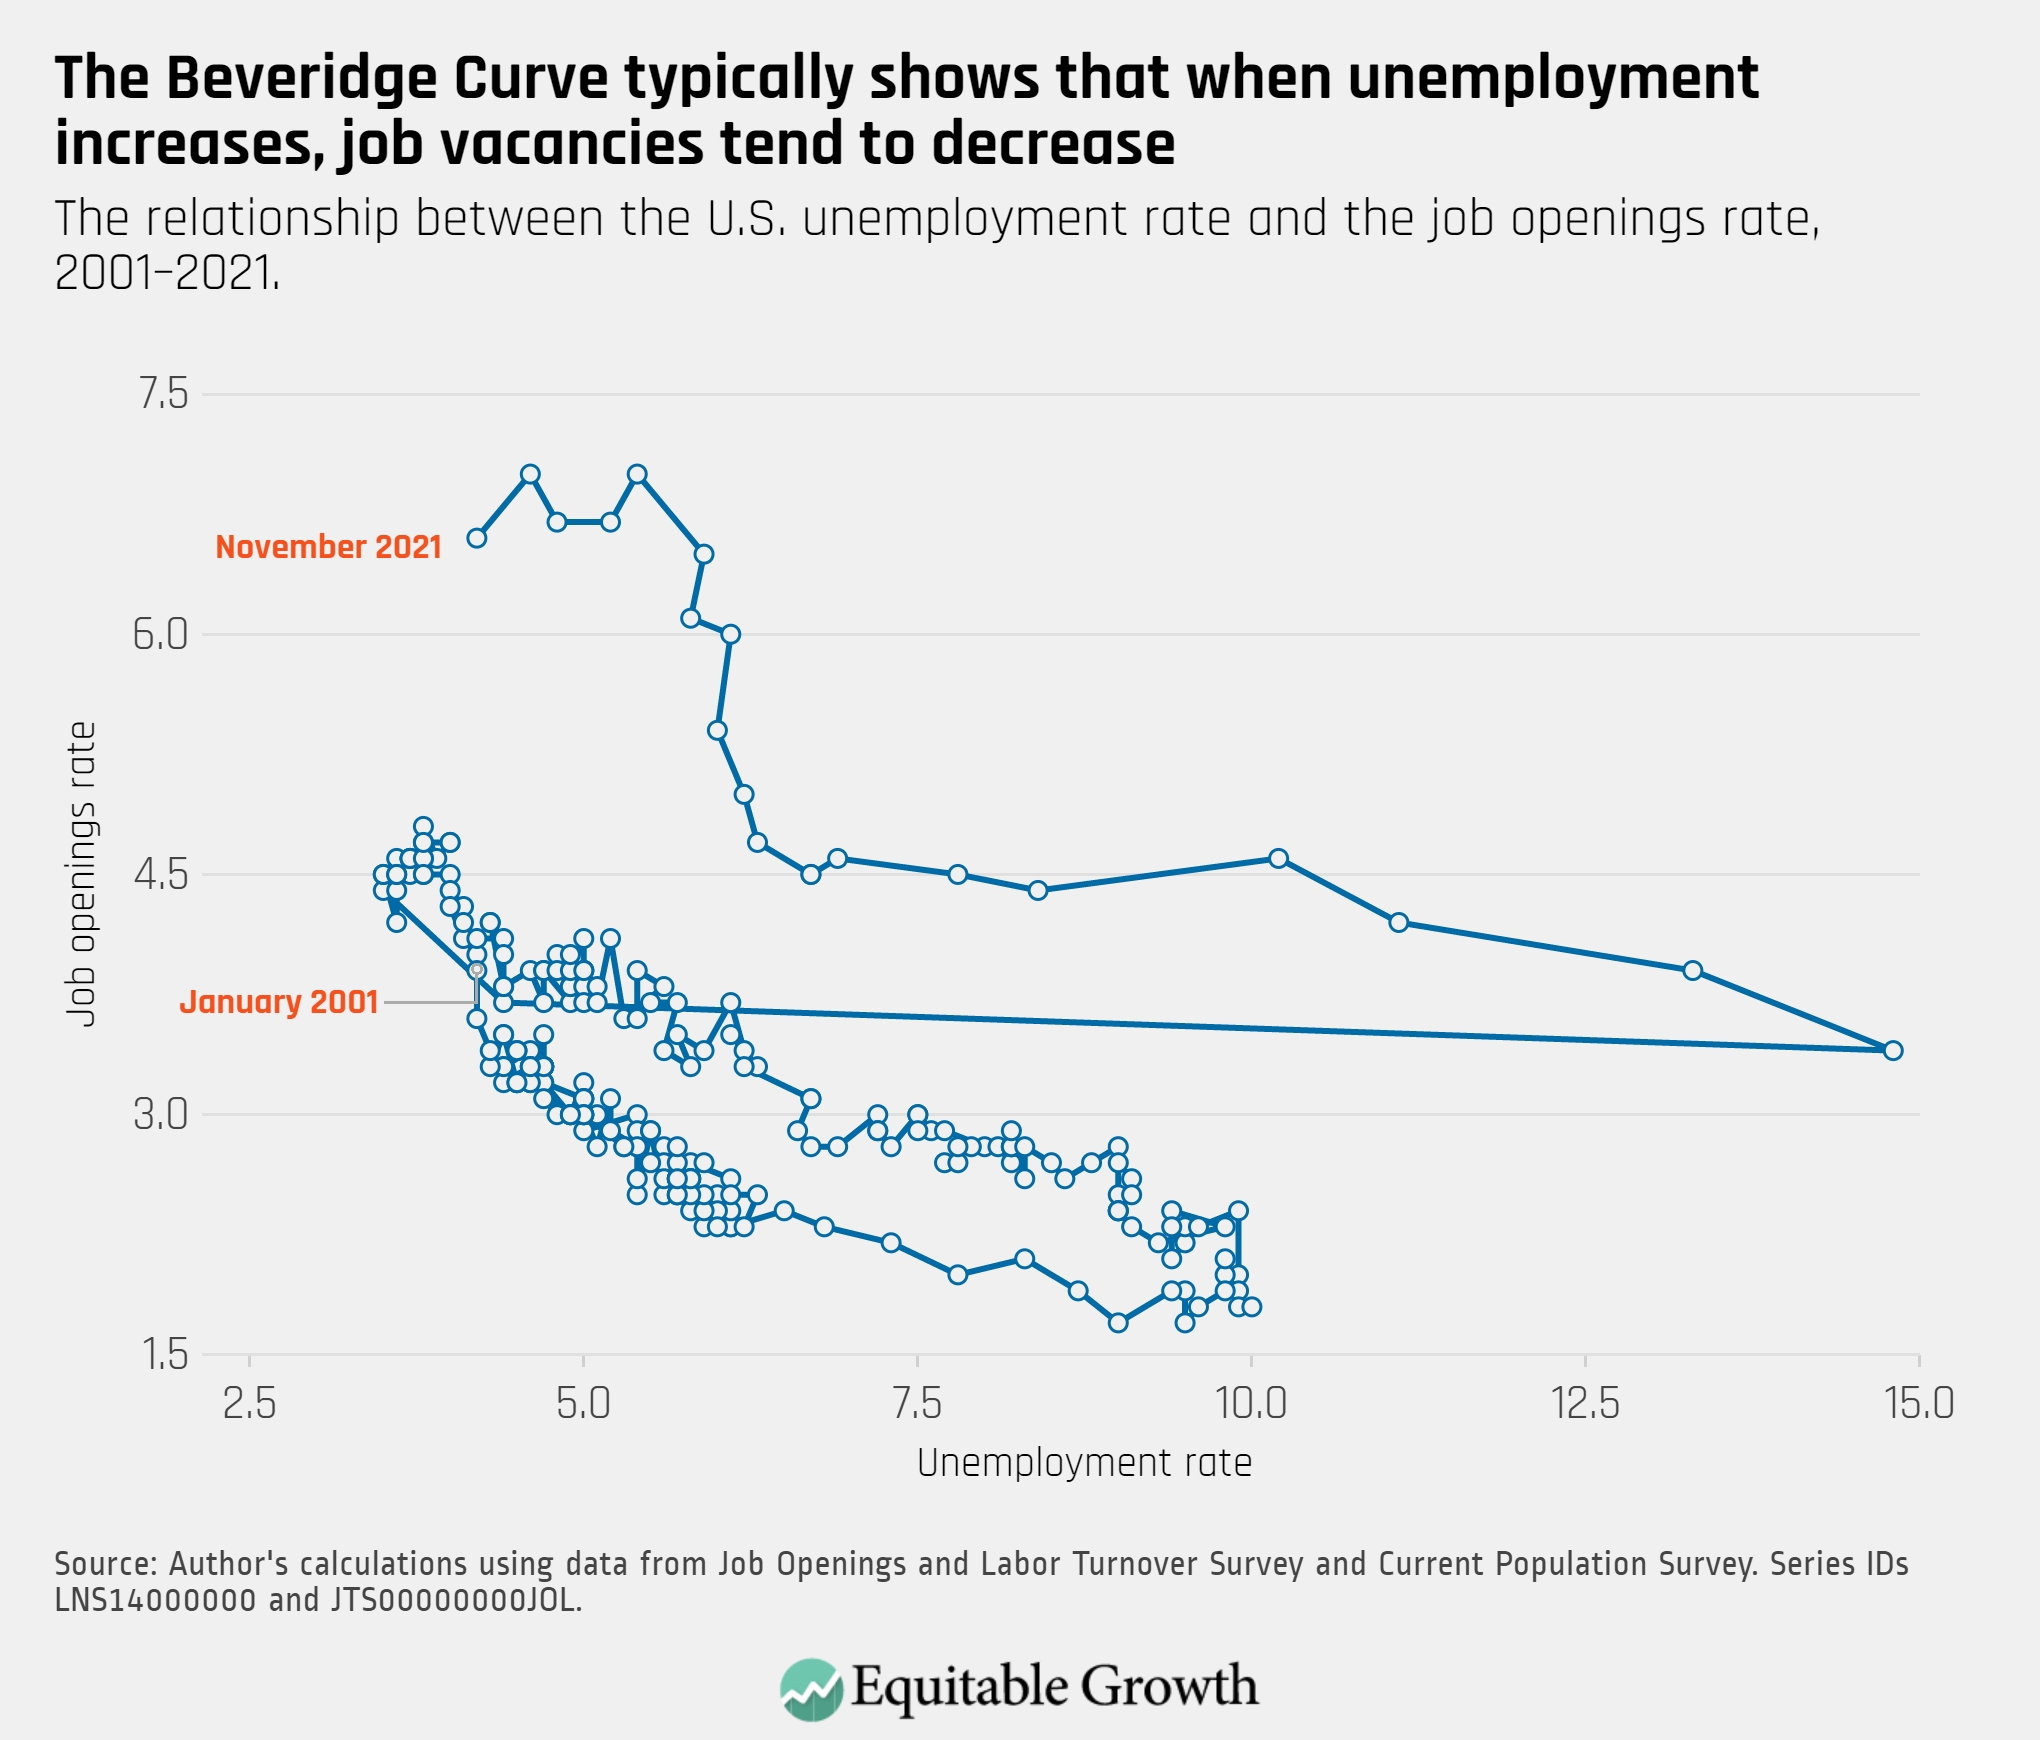
The Beveridge Curve continues to be in an atypical range compared to previous business cycles, as the unemployment rate declined to 4.2 percent and the rate of job openings decreased to 6.6 percent.

The relationship between the U.S. unemployment rate and the job openings rate, 2001–2021

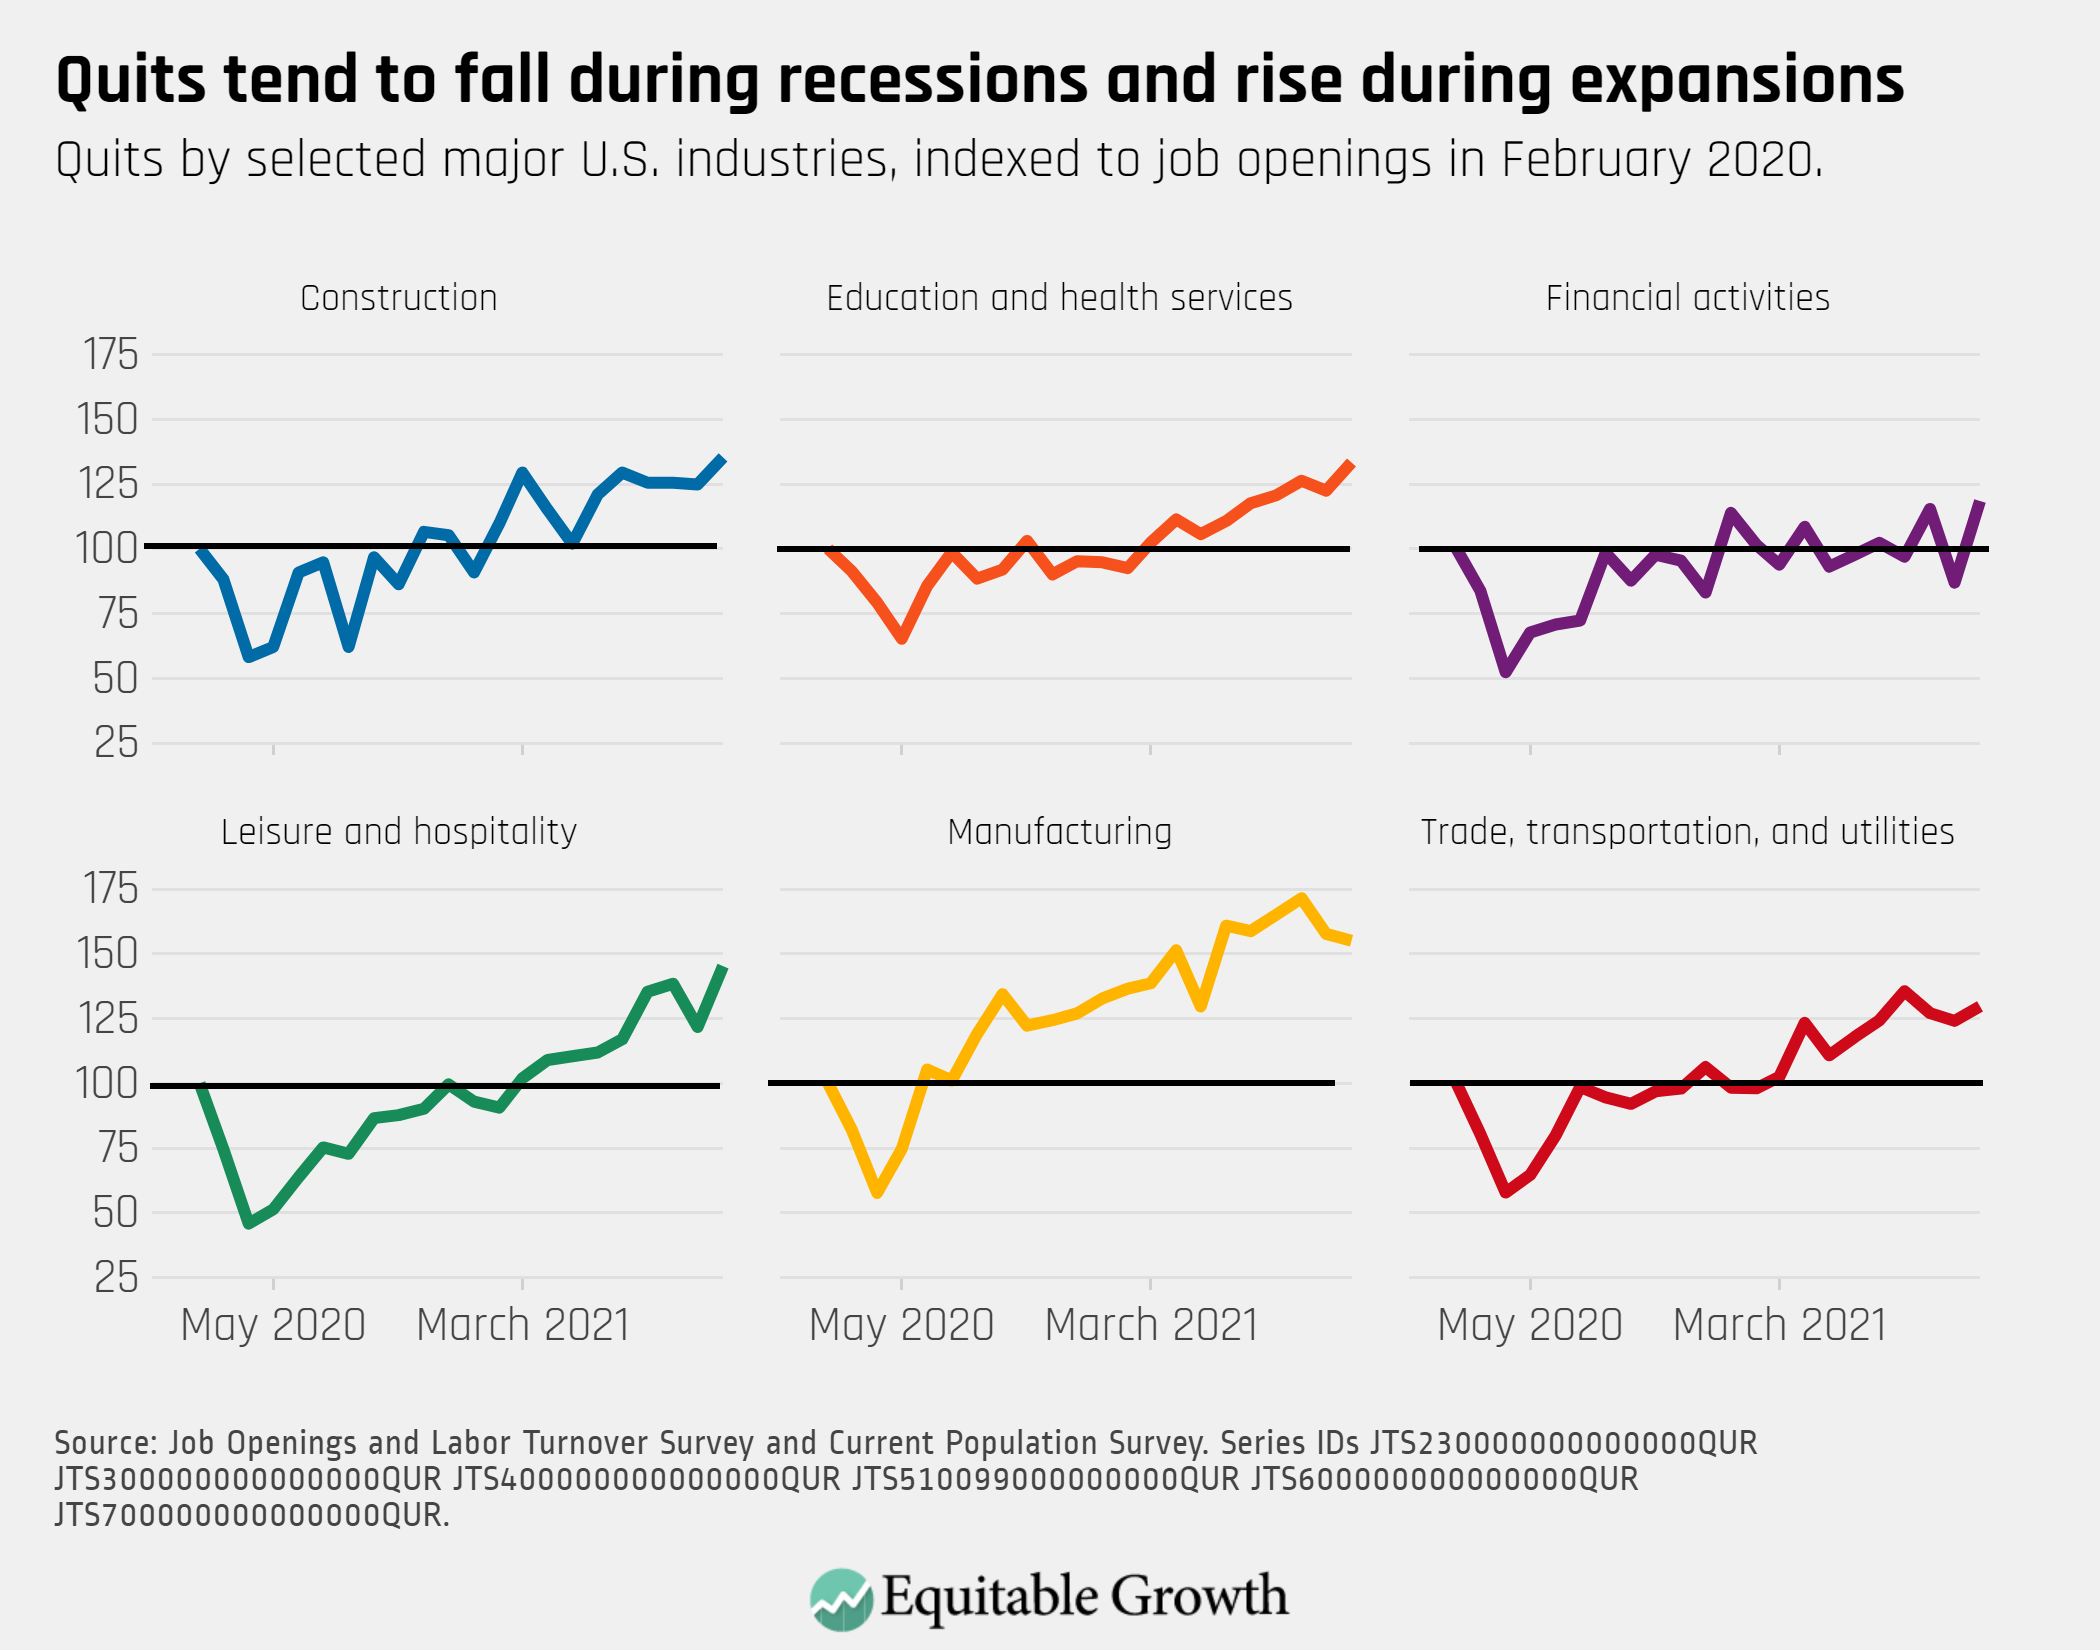
The quits rate rose in November and remains elevated in a number of industries relative to pre-pandemic levels, including construction, education and health services, and leisure and hospitality.

Quits by selected major U.S. industries, indexed to job openings in February 2020.
Connect with us!

Explore the Equitable Growth network of experts around the country and get answers to today's most pressing questions!

Get in Touch