On November 4, the U.S. Bureau of Labor Statistics released new data on the U.S. labor market during the month of October. Below are five graphs compiled by Equitable Growth staff highlighting important trends in the data.
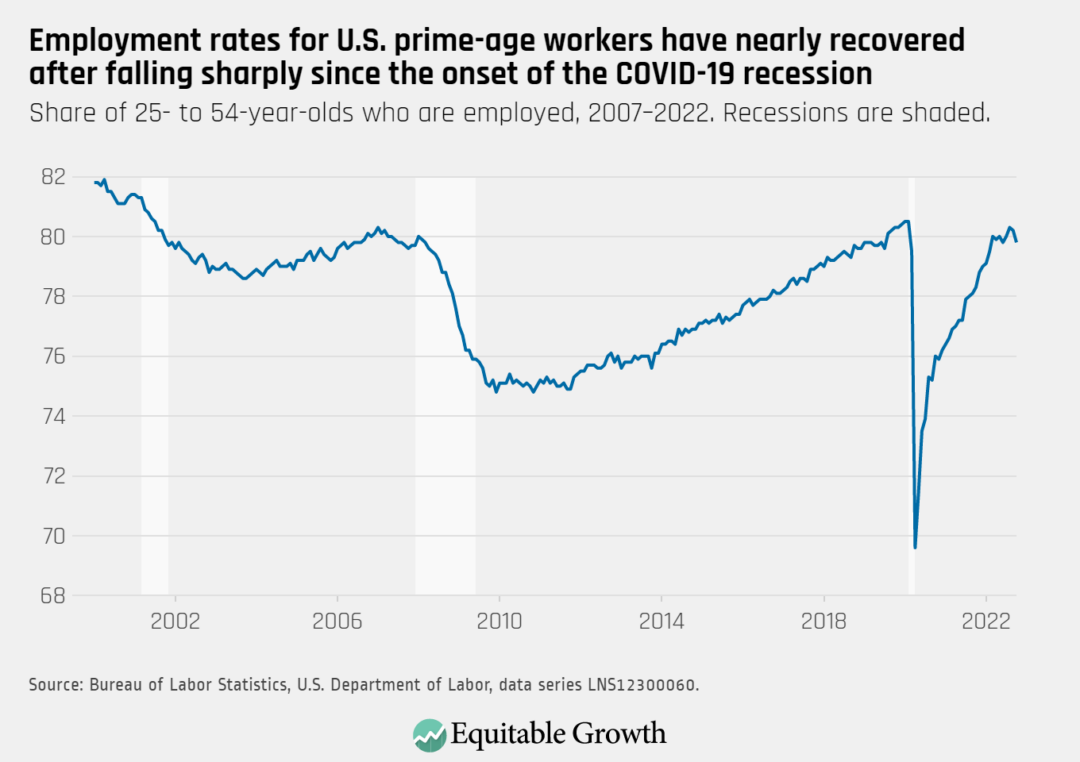
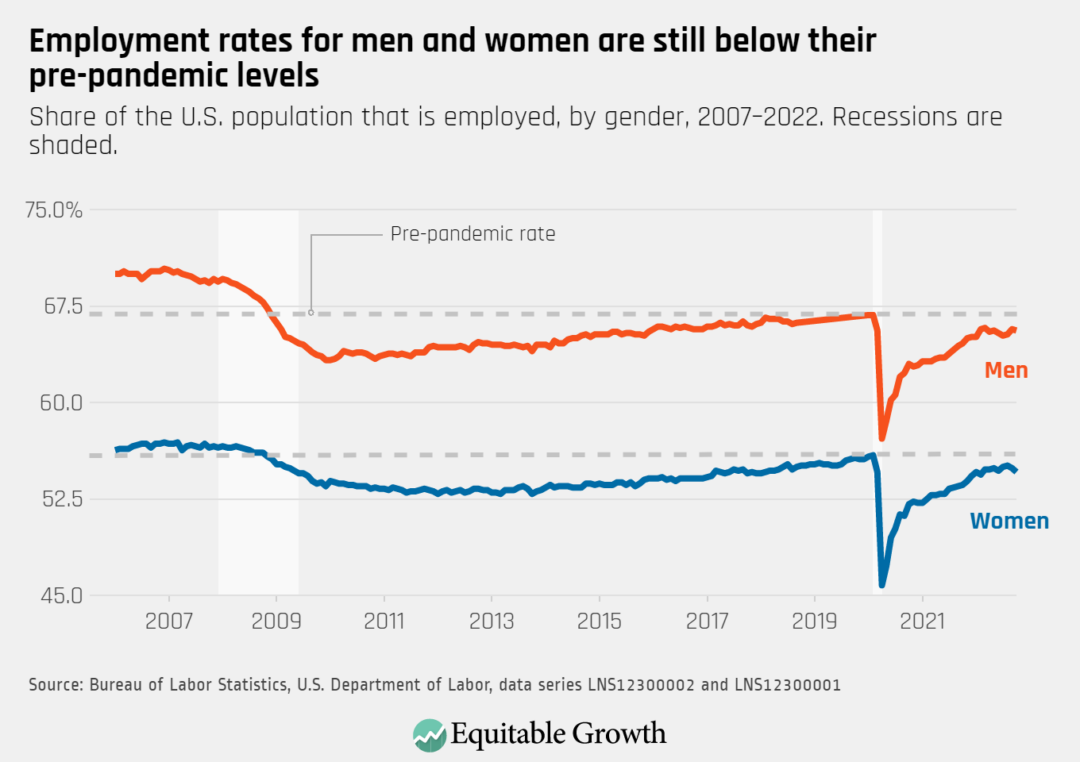
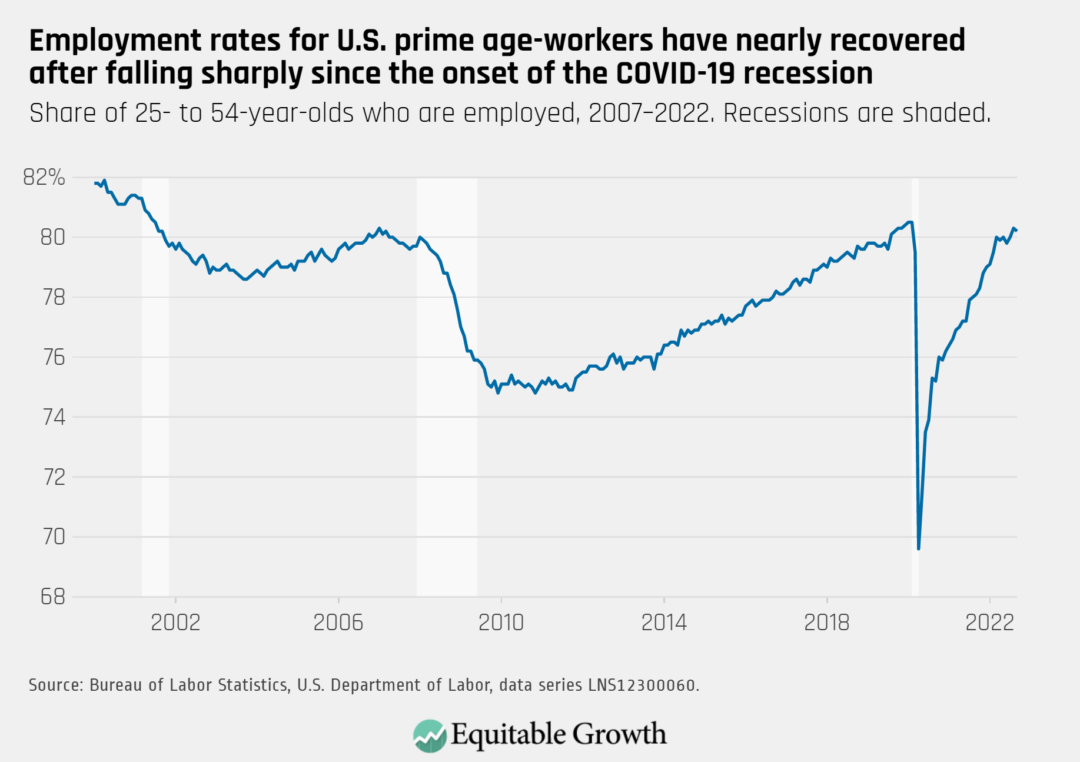
Job growth declined in October, with the prime-age employment rate falling to 79.8 percent and below 80 percent for the first time since June.
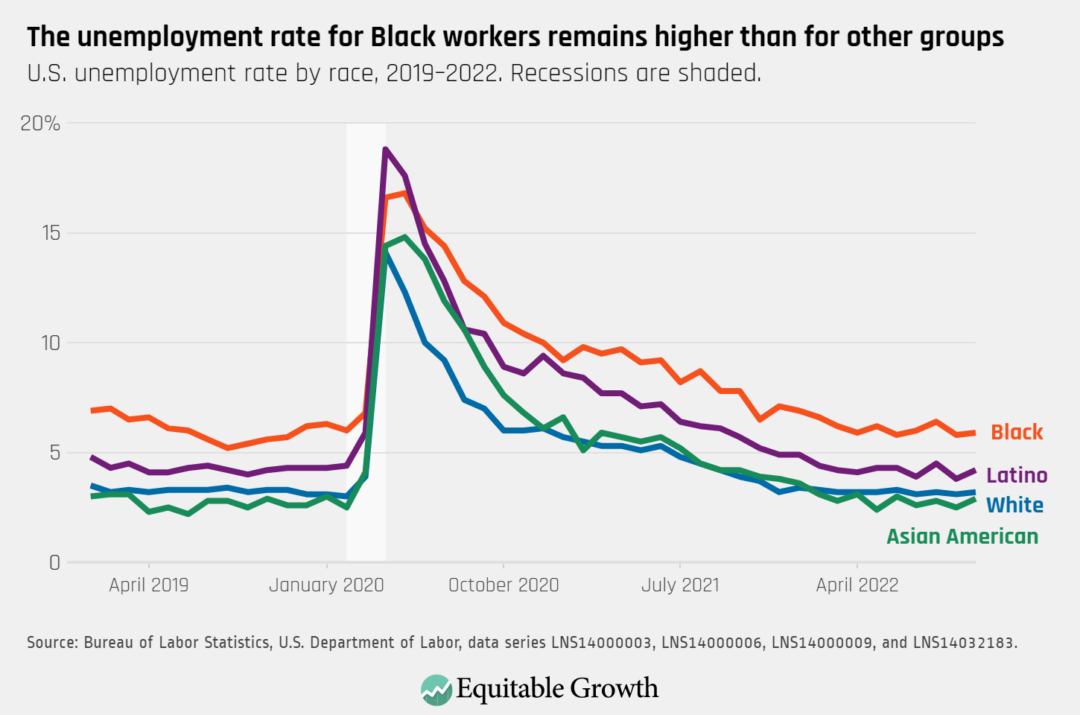
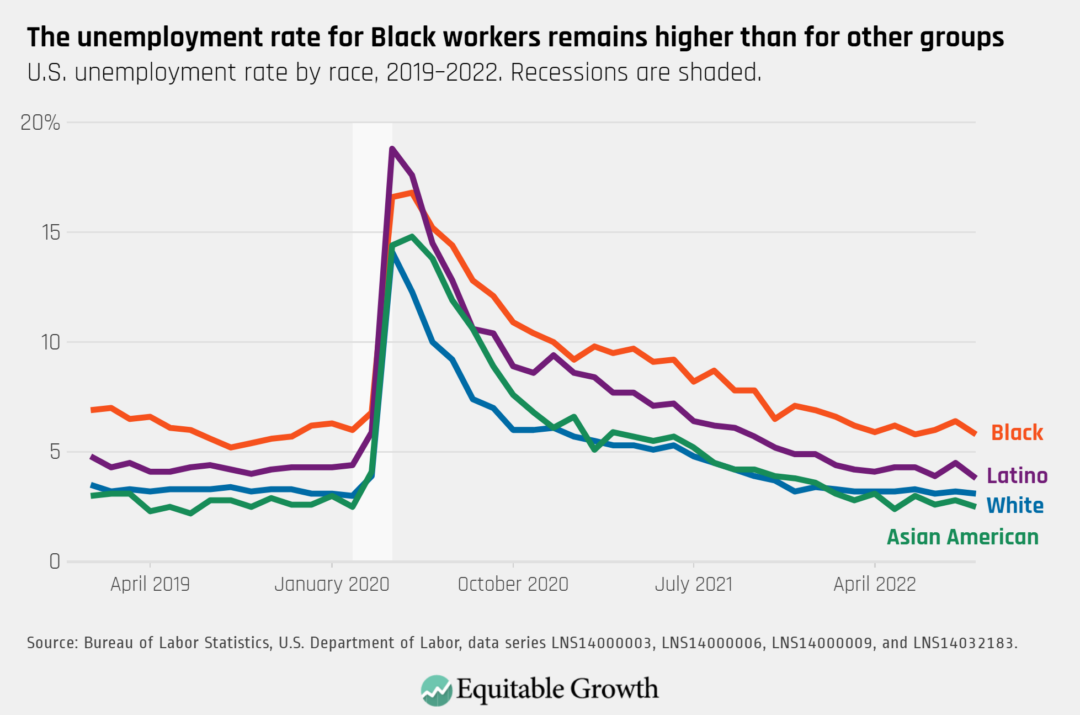
The unemployment rate increased for almost all major demographic groups, with the biggest increases for women and Hispanic workers.
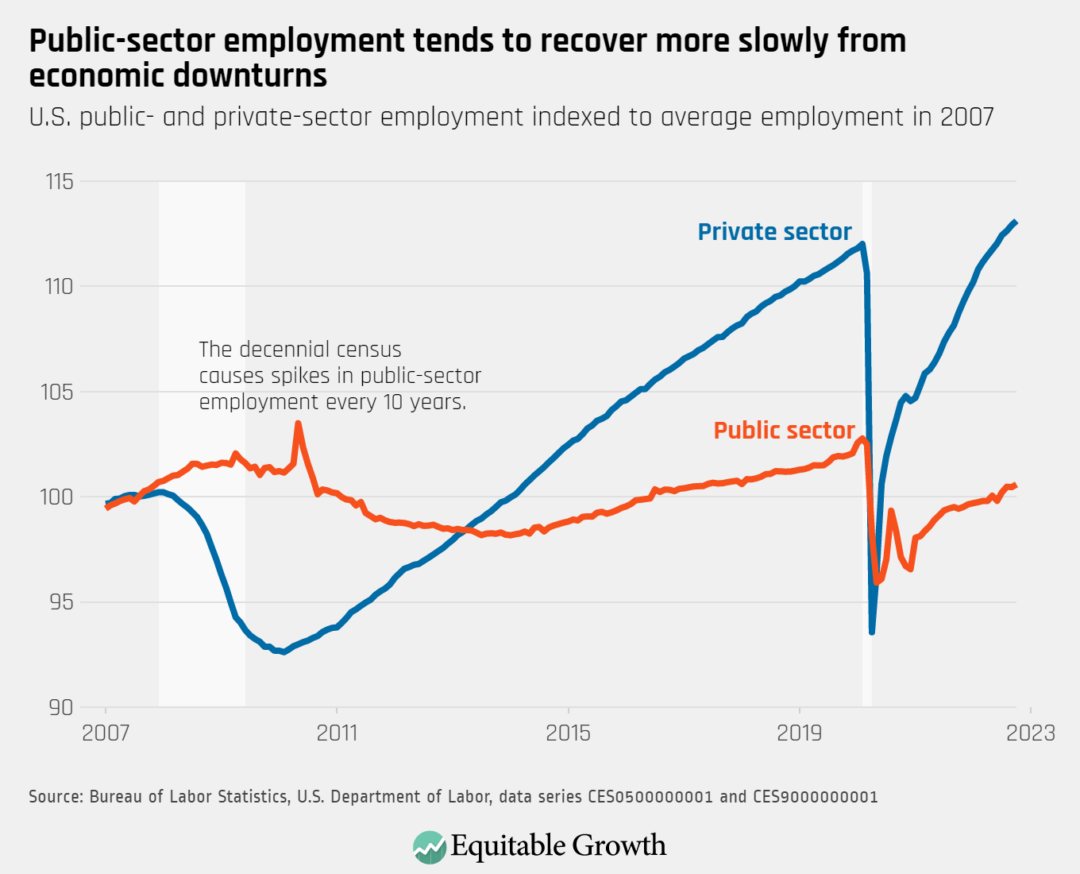
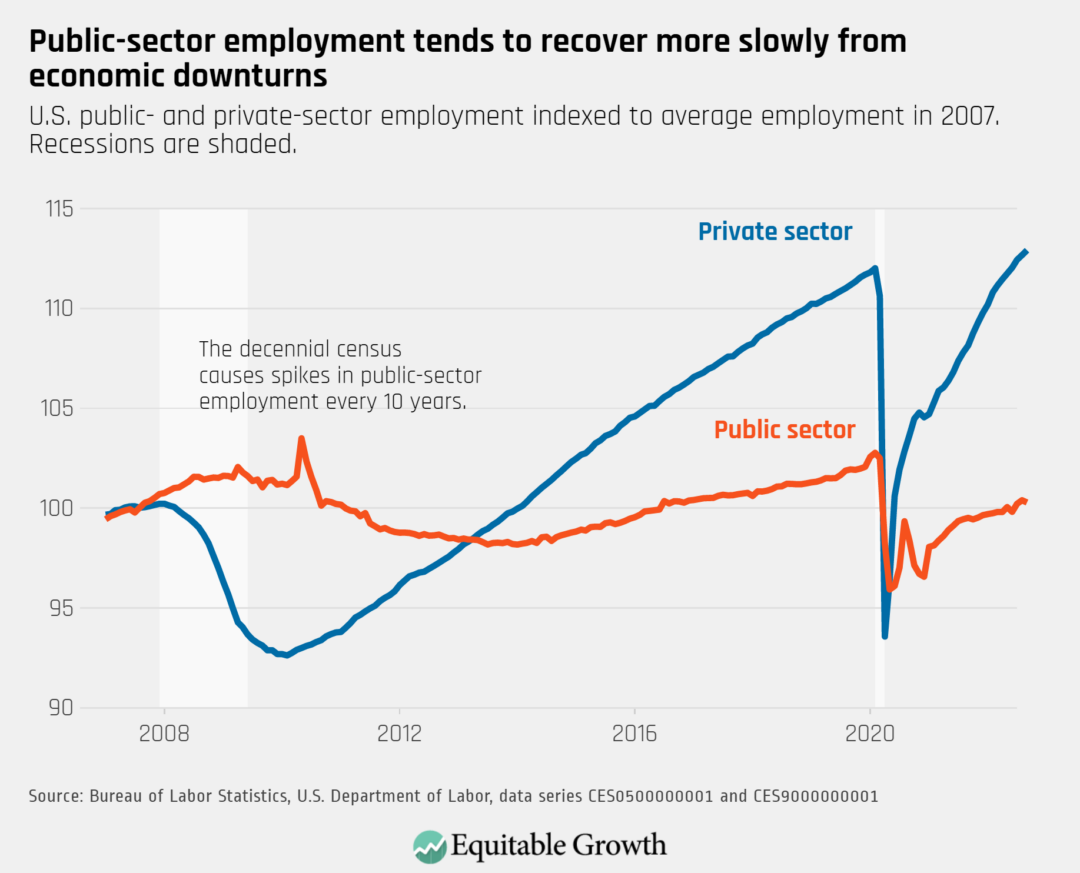
Public sector employment still lags in the recovery, with private sector employment above its pre-pandemic levels.
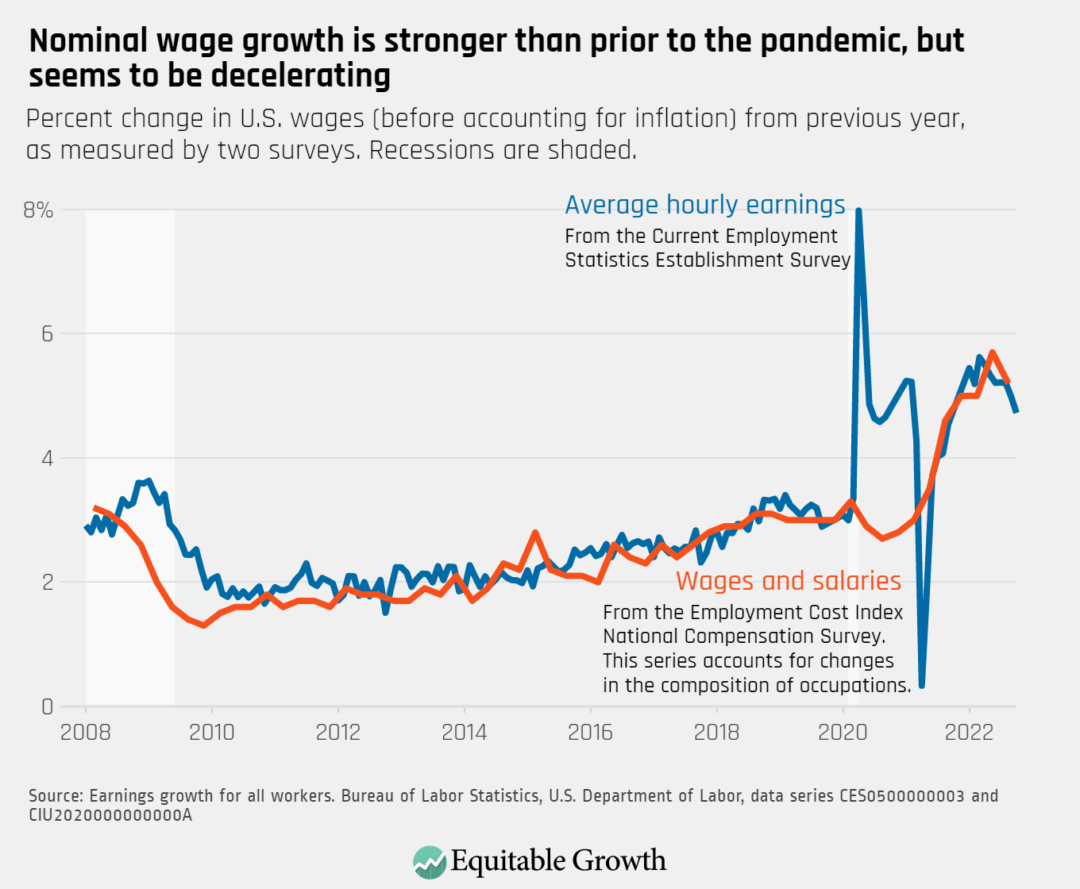
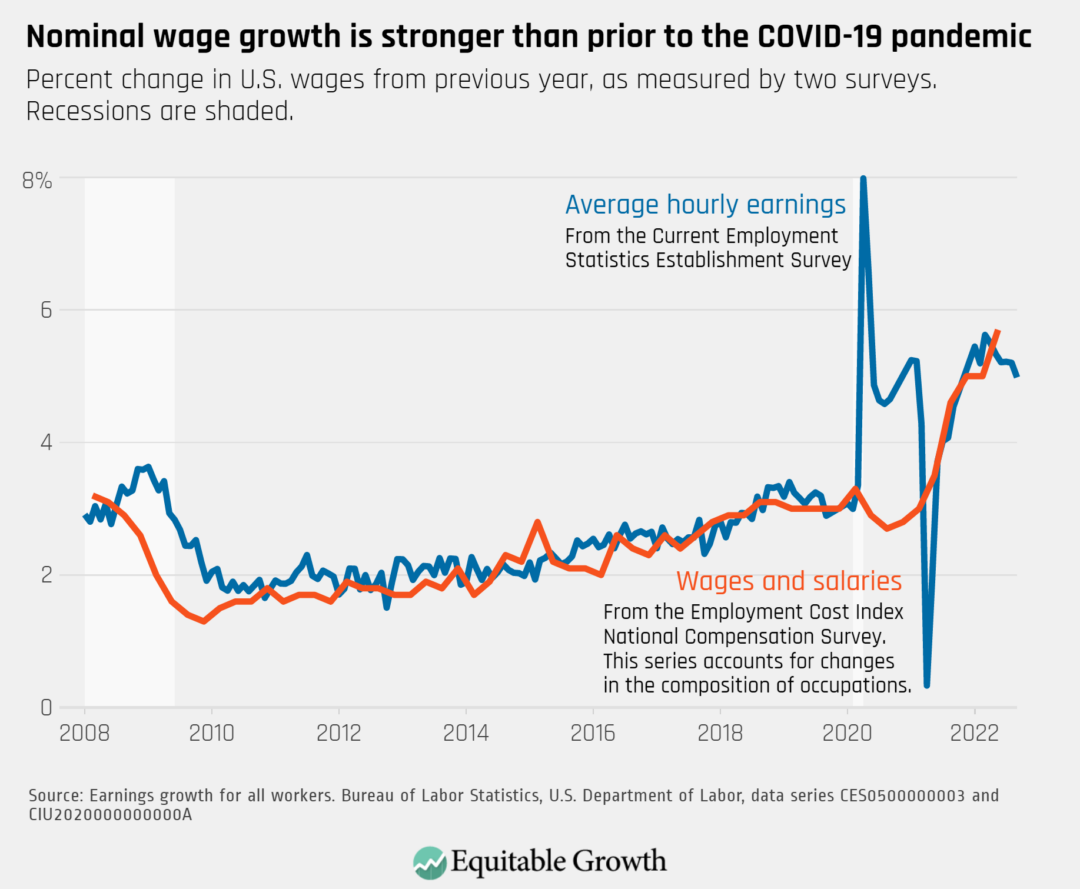
Wage growth decelerated in October, further demonstrating a lack of evidence that wage pressure is a primary cause of continuing inflation
Employment rates decreased for women and men in October, but slightly more so for women as unemployment levels increased and almost 200,000 dropped out of the labor force.
The members of the Federal Reserve Board’s interest-rate-setting committee are almost universally expected to raise interest rates by 0.75 percentage points this week, as they have at each of their past three meetings, and financial markets also expect an additional increase in December. The pace of the rate hikes since May 2022 by the Federal Open Market Committee, which is meeting November 1–2 to set the federal funds rate, is among the most aggressive on record.
While there are legitimate fears that these rate hikes are coming too fast, even risking a recession, a recovery with higher inflation should not be surprising in the context of the full response to the COVID-19 recession of 2020. A key question going forward is whether the Fed could be playing catch up on inflation now as a necessary consequence of using a well-studied monetary policy response to recessions that occur when inflation and interest rates are very low.
Importantly, key research on monetary policy discussed in this column contextualizes current above-target inflation. This research suggests that the Fed was neither unable nor late to react to inflation, but was constrained by policy compromises required when inflation and interest rates are too low entering a crisis.
The Fed reacted slowly to the inflation reversal that began in October 2021, but its policy has followed a thin playbook for setting rates amid economic uncertainty and the legacy of very low interest rates over the past decade. The combination of low real interest rates (after accounting for inflation) amid the low inflationary environment that persisted for the decade prior to 2021 gave the Fed few options to respond to the negative shock of the COVID-19 pandemic beginning in 2020 and the subsequent short but extremely sharp recession that year.
After all, cutting rates by 5 percentage points or more, as in previous recessions, would have required strongly negative interest rates. The Fed’s monetary policy response to the COVID-19 recession of 2020 instead was to cut policy interest rates to zero, commit to holding rates low in the future (forward guidance, in central bank jargon), and keep a host of financial markets from seizing up. But 2022 has underscored the more subtle challenge that using the stimulus tools of a low real interest rate environment dictated that the Fed had fewer options to respond if inflation suddenly took off.
The Fed’s policy choices going forward will hinge on both how quickly inflation and so-called neutral real interest rates—rates that neither depress job growth nor stimulate inflation—fall and how quickly the new normal for each can be spotted. If the Fed can successfully communicate that it is following the research, there is little reason that interest rates need to keep increasing quickly, especially if inflation begins to peak in the coming year or so.
This column briefly examines recent U.S. monetary policy history, offers up some research that has been little-discussed that may already be very influential to the Federal Open Market Committee, and offers some lessons perhaps to be learned in the process by monetary policy researchers and policymakers alike.
Was the Fed slow to respond or practicing deliberate monetary policy?
As recently as the third quarter of 2021, U.S. COVID-19 cases and inflation were in steady decline, with the Fed’s preferred core Personal Consumption Expenditure measure of inflation nearing the central bank’s 2 percent target. More importantly, little evidence of a long-term shift in inflation was apparent. What followed was 12 months of high and volatile inflation readings that were not predicted by markets or the Fed. So, after months of waiting, the Fed acted aggressively in May 2022.
This slow-then-aggressive path of rate hikes drew outsized attention to arguments that the Fed was “behind the curve.” Yet this pattern of rate hikes follows directly from well-established monetary policy scholarship. Two key insights from this literature that are often missing from the discussion are:
Monetary policy should respond more slowly and with more inertia when nominal interest rates start from low levels and monetary policy uncertainty is high.
Restraining from hiking rates in the early phases of inflation and reacting more aggressively once the emergence of inflation is more clear can be a prudent strategy when interest rates are close to zero. That is exactly where the Fed found itself over the past 18 months, but it can be difficult to identify this pattern looking backward.
The logic behind this policy is relatively straightforward. Because cash and other financial instruments blunt negative interest rates’ effectiveness, central banks face asymmetric risks when nominal interest rates are near zero.
Additionally, standard monetary policy rules, which the Fed uses as a guide to set interest rates, are defined assuming an inflation target and knowledge of steady-state unemployment and interest rates. When the steady states of unemployment and interest are ambiguous, the Fed can do better by instead moving interest rates in response to changes in inflation—a measure it can observe directly—rather than focusing on gaps between equilibrium interest rates and employment rates that depend on these estimated parameters.
In this framework, the past decade of nominal interest rates at or barely above zero makes the case for a slower-then-faster reaction to inflation—slowing the economy in 2021 risked recession and deflation. But, following the same literature, the Fed’s aggressive moves in the second half of 2022 are a consequence of the need to respond slowly to ambiguous signs of inflation in late 2021 and stronger signals of inflation in 2022.
Importantly, this response is not solely the result of low nominal interest rates, but the result of factors beyond the Fed’s control—low natural interest rates, which are essentially where the Fed is forced to set interest rates by long-run economic forces—and factors the Fed does control, namely its inflation target.
The monetary policy research upon which policymakers may well be relying
In the late 1990s and early 2000s, monetary policy research focused on sustained low inflation for the first time in generations and focused extensively on how the Fed should conduct monetary policy with low interest rates and amid uncertainty—precisely the state of the U.S. economy the Fed has faced since the pandemic. Among those researchers was John C. Williams, now head of the New York Fed and a vice chair of the Federal Open Market Committee, and not the only FOMC member to publish in this area.
Unfortunately, even as steadily declining U.S. unemployment and volatile inflation has validated the Fed’s use of tools from a relatively thin applicable playbook, some commentary questions the Fed’s credibility. Faced with pressure to retain credibility, the Fed has been hawkish in action and in communications for the past 6 months, and market measures suggest this has kept medium-term expectations closely in line with its 2 percent target rate of inflation.
The Fed may be strategically loathe to show too many cards, but Fed communications could have better foreshadowed its rate-hike path. Yet the good news is that as the need for catch-up rate hikes declines, so too does the downside to communicating this approach. Recent comments from FOMC members on possible pauses in rate hikes suggest the rate-hike path is following the catch-up trajectory prescribed by the near-zero and uncertain rates literature.
This spurt of inflation is not over, but even as it shows signs of easing in the coming year, the past 2 years present a challenge for the Fed’s policy framework and longer-term inflation targets. The political costs of high inflation to the Fed have been significant, suggesting that low inflation not only raises risks of deflation in the event of negative shocks, but also makes defeating inflationary episodes more politically costly for monetary policymakers than previously appreciated.
There are Fed credibility issues with moving to a higher inflation target without first reaching the 2 percent goal. Nonetheless, the inflation required to deal with the pandemic shock from a low interest rate baseline has left the case for moving beyond the 2 percent inflation target framework stronger now than it was before the COVID-19 pandemic and recession.
It’s too early for the Fed to discuss long-term strategy, but it’s not too soon for researchers and policymakers alike to begin improving on a framework that was delivering weak economic growth and rising inequality for a decade before the latest crisis.
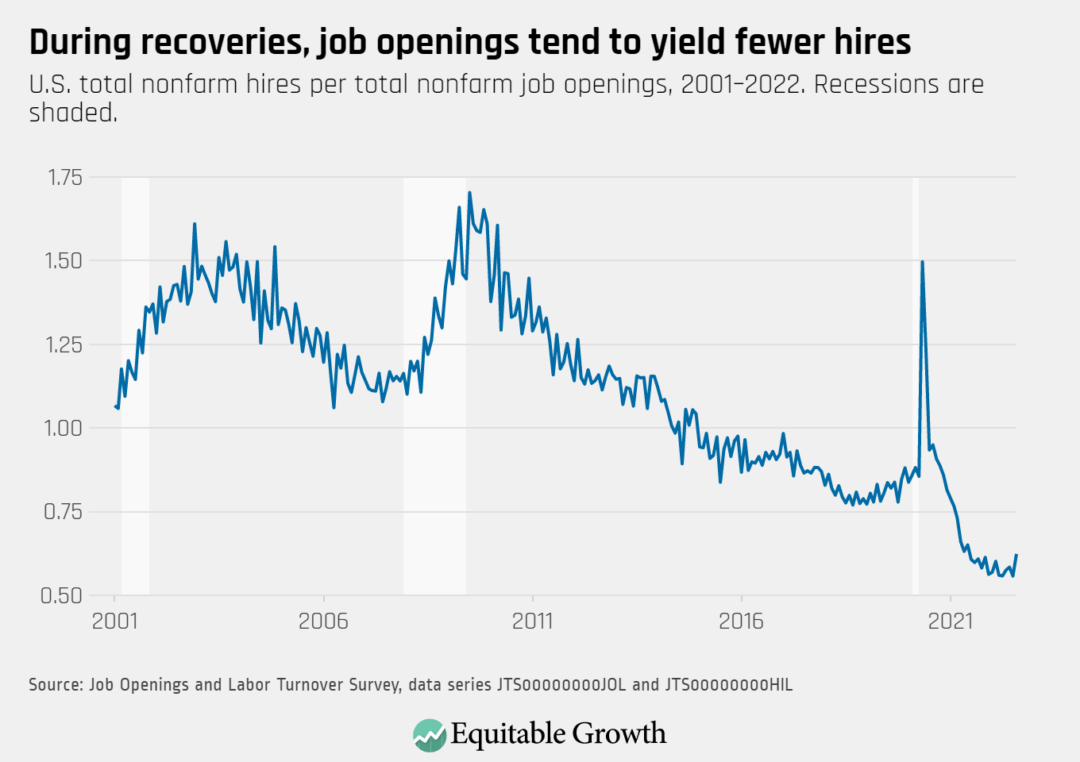
Every month the U.S. Bureau of Labor Statistics releases data on hiring, firing, and other labor market flows from the Job Openings and Labor Turnover Survey, better known as JOLTS. Today, the BLS released the latest data for September 2022. This report doesn’t get as much attention as the monthly Employment Situation Report, but it contains useful information about the state of the U.S. labor market. Below are a few key graphs using data from the report.
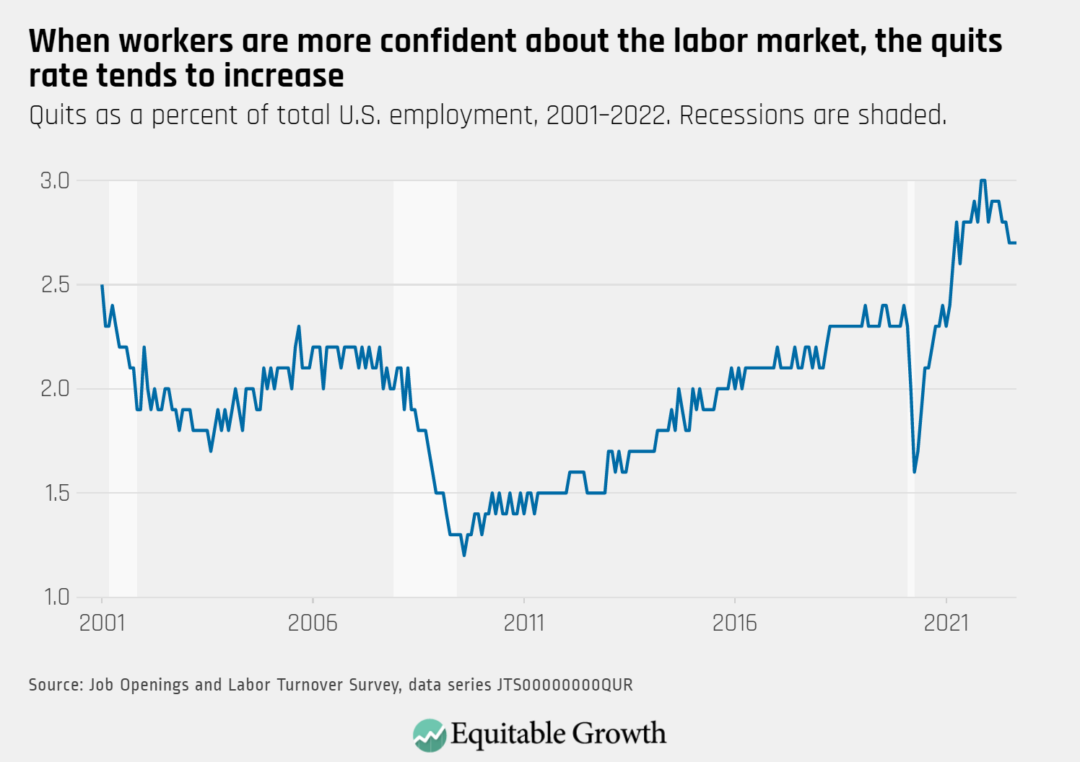
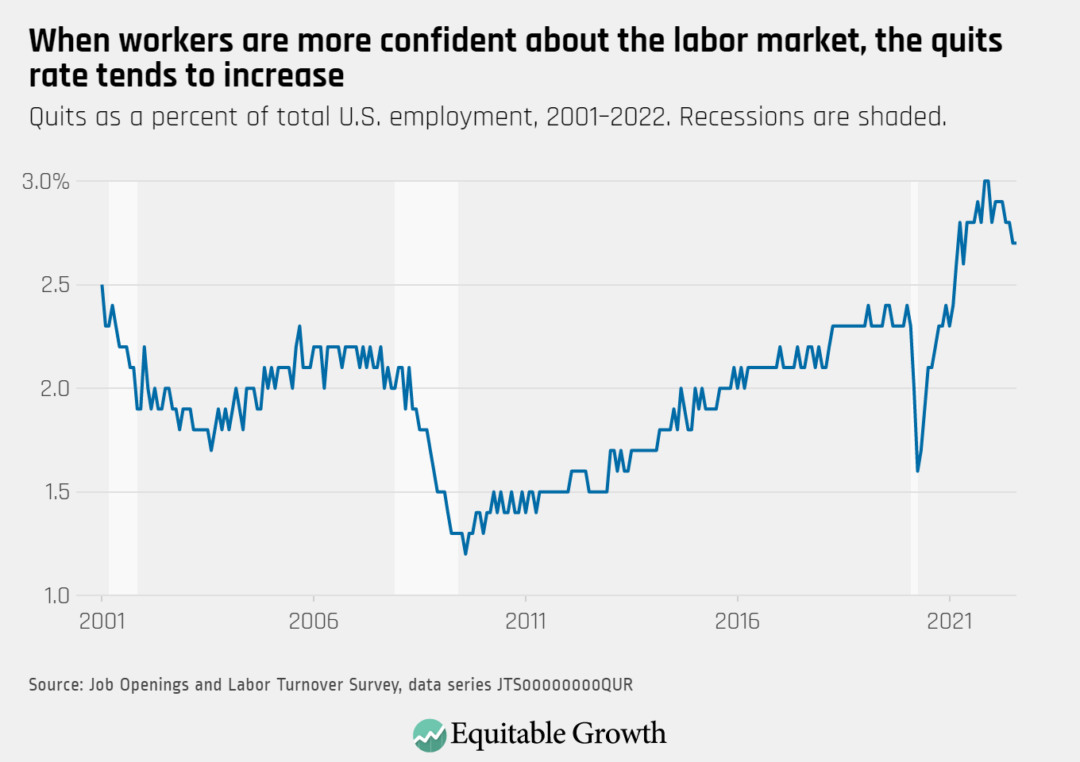
The quits rate remained steady at 2.7 percent as 4.1 million workers quit their jobs in September 2022.
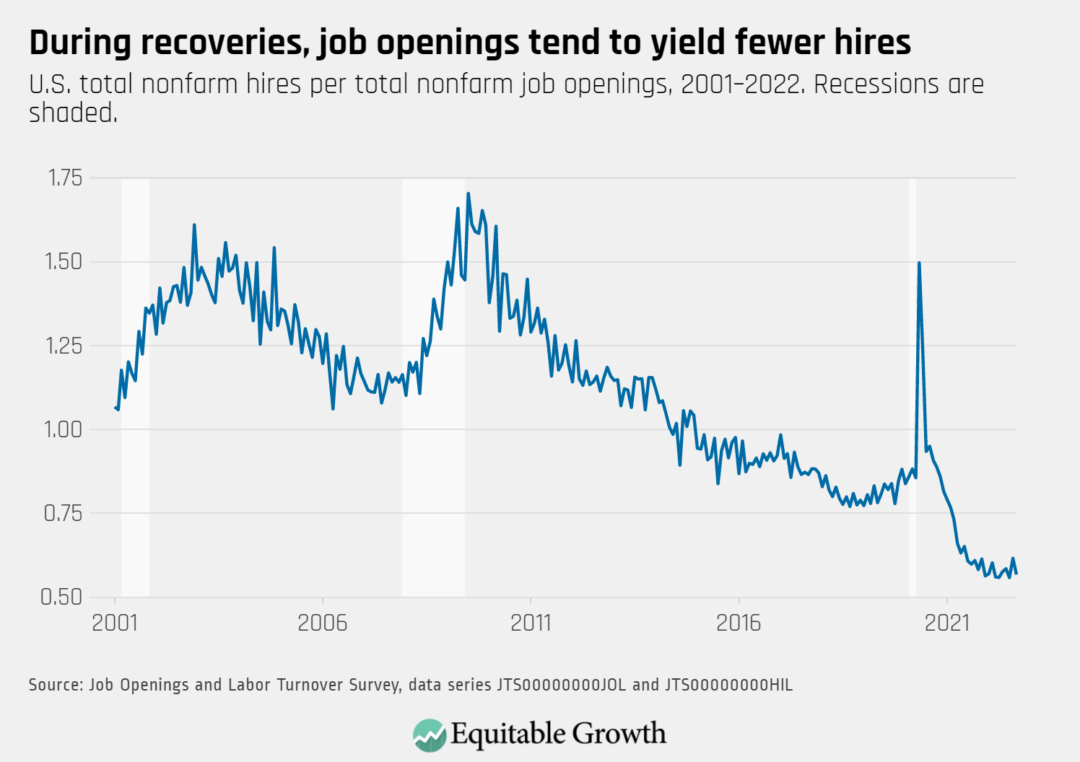
The vacancy yield declined to 0.57 in September from almost 0.62 in August, as job openings rose to 10.7 million and hires decreased to 6.1 million.
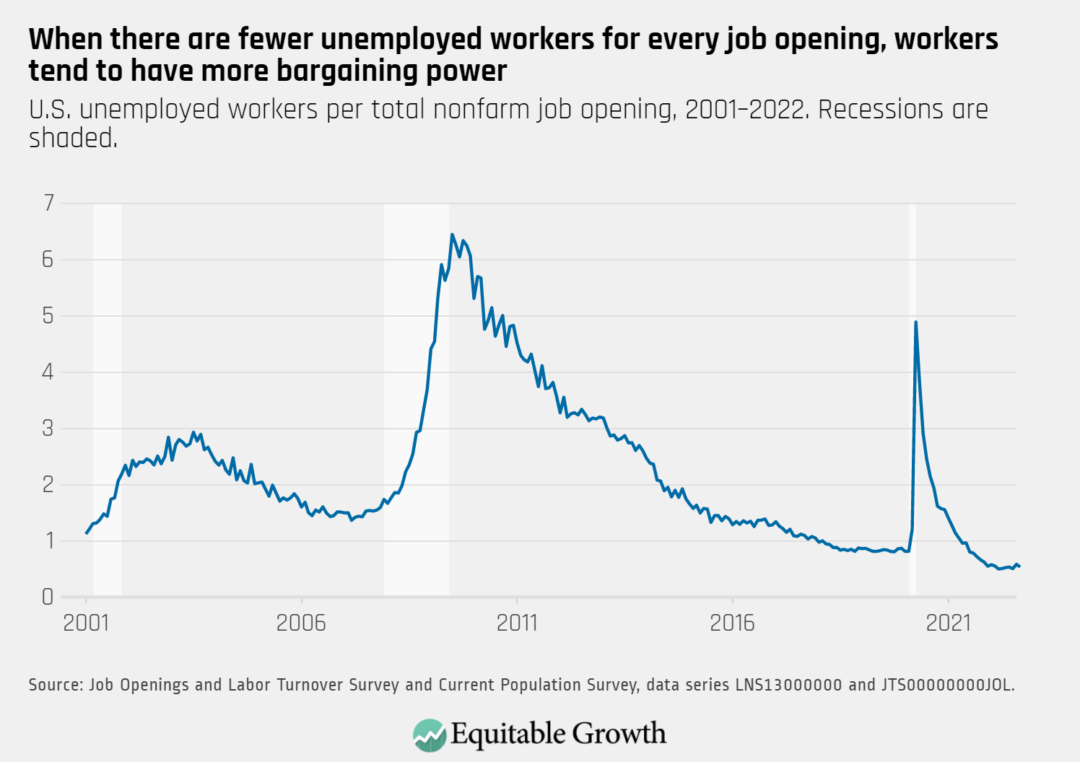
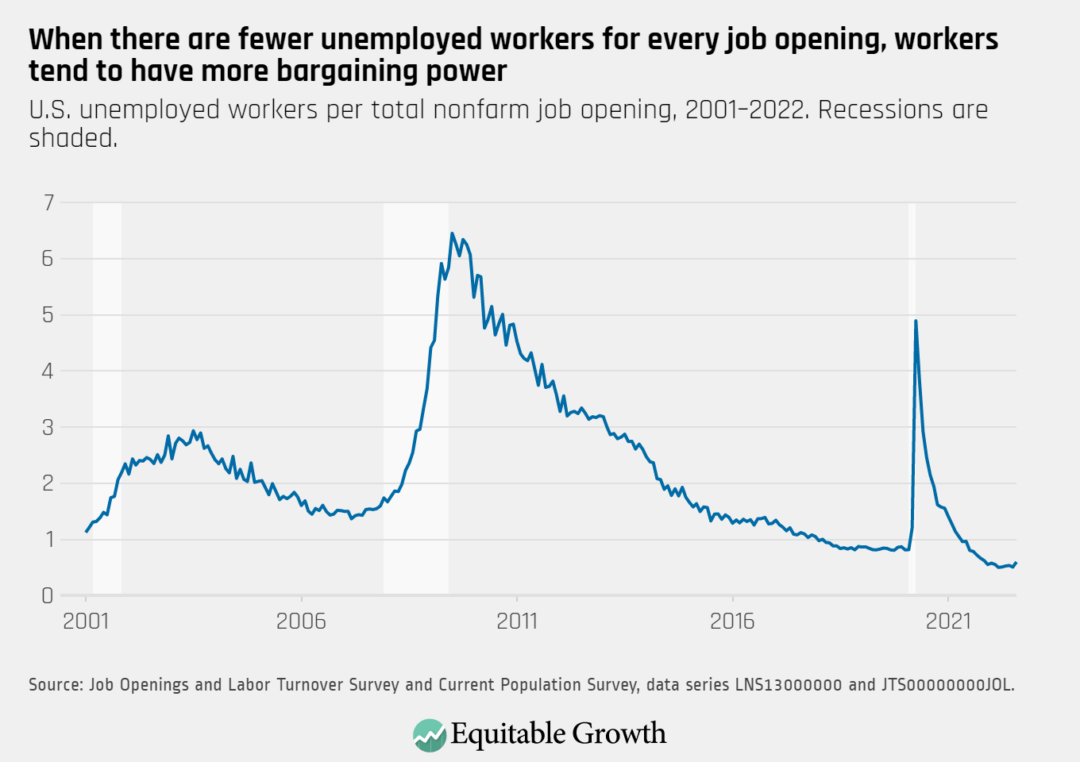
The ratio of unemployed workers to job openings decreased to almost 0.54 in September from just less than 0.59 in August.
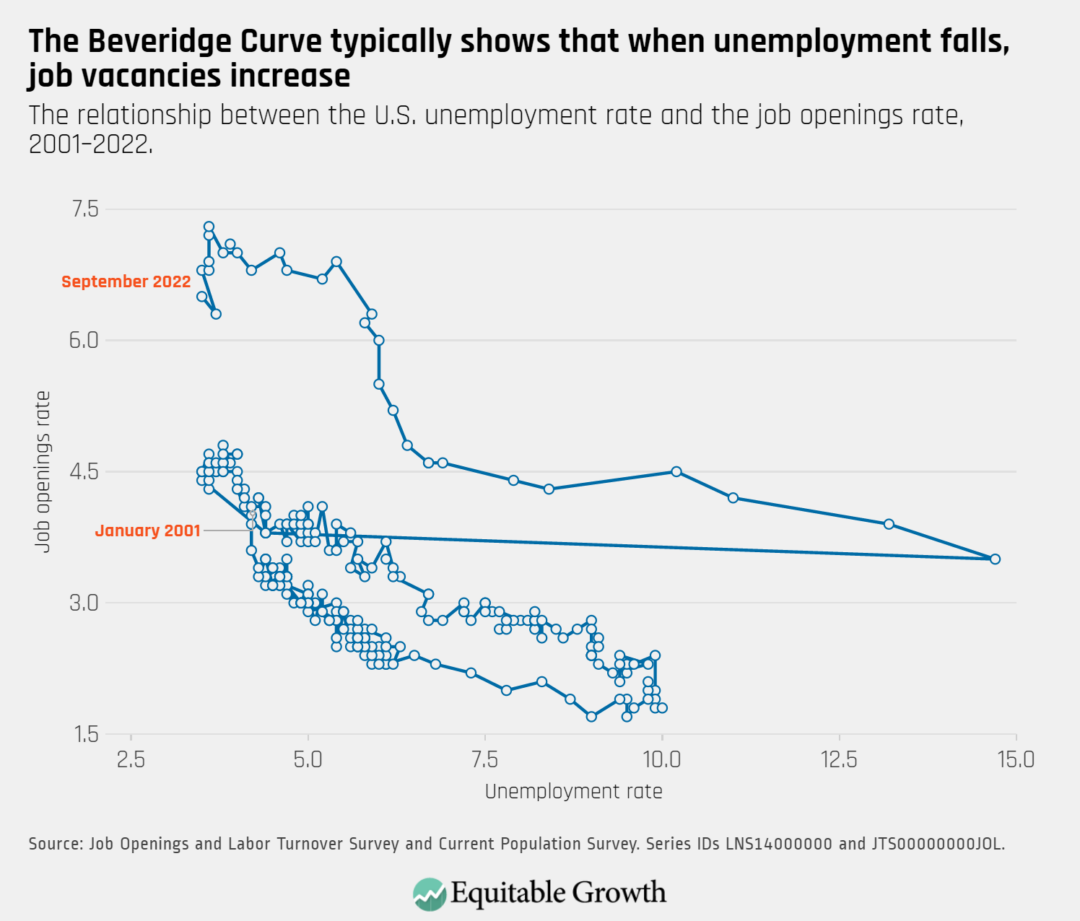
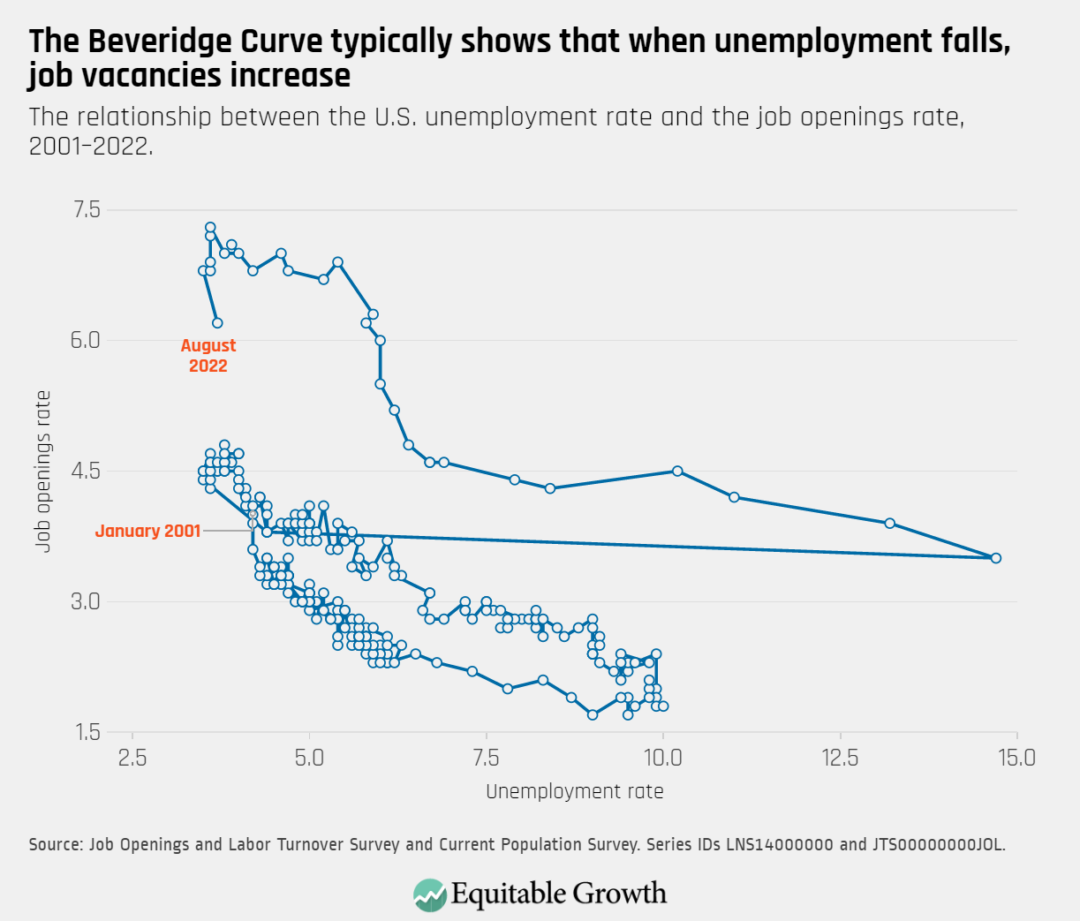
The Beveridge Curve moved upward in September as reported job openings rose and as the unemployment rate ticked down.
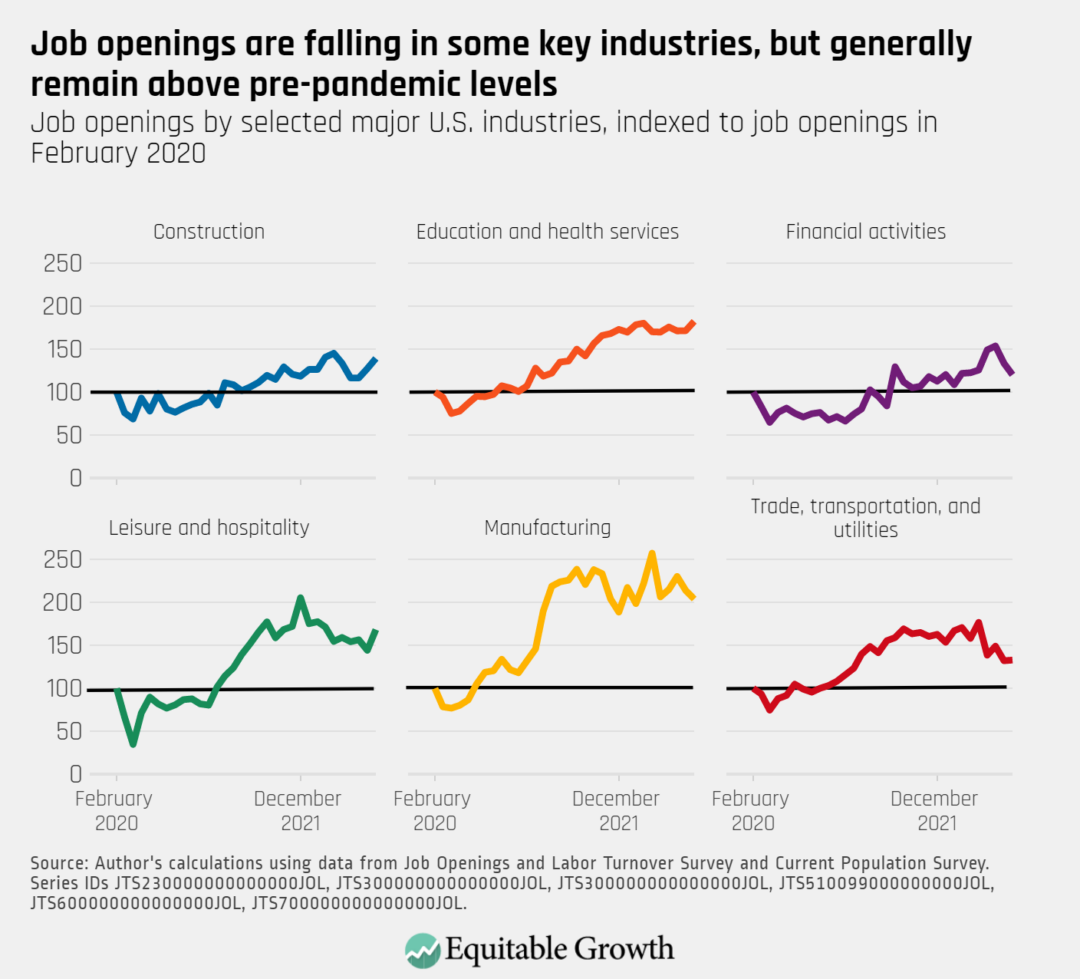
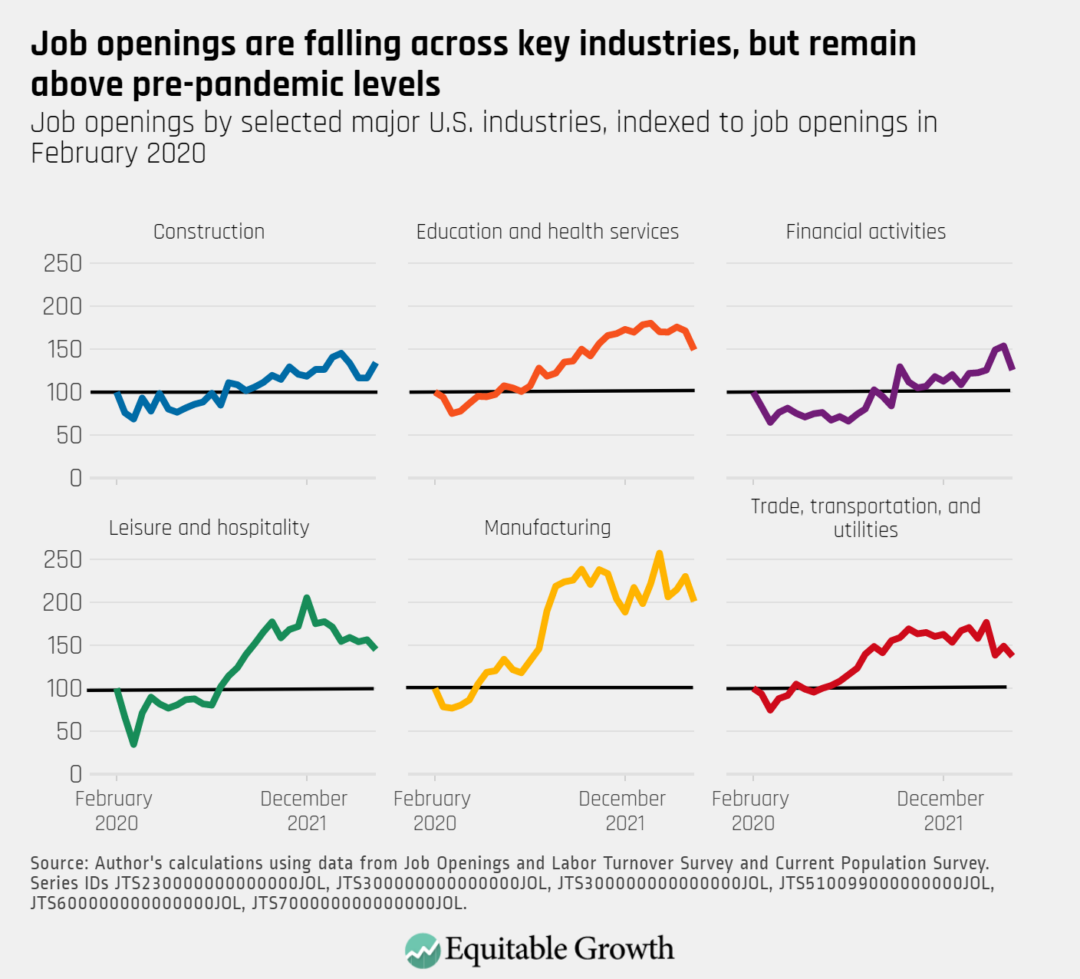
The overall number of reported job openings increased by 437,000 in September, with openings rising in construction, education and health services, and leisure and hospitality, but falling in financial activities and manufacturing.
Equitable Growth is committed to building a community of scholars working to understand how inequality affects broadly shared growth and stability. To that end, we have created the series “Expert Focus.” This series highlights scholars in the Equitable Growth network and beyond who are at the frontier of social science research. We encourage you to learn more about both the researchers featured below and our broader network of experts. If you are looking for support to investigate the U.S. child care policy and the early care and education system, please see our funding opportunities and stay tuned for our next Request for Proposals in November 2022.
Child care and early education underpins the U.S. labor force and the overall economy. Yet broad investment in U.S. social infrastructure, including in child care, is often overlooked as a contributor to creating a strong, stable, equitable, and prosperous labor force and economy. When the COVID-19 pandemic hit, many early care and education providers closed their doors and schooling became virtual, forcing millions of workers—many of them women and mothers—to stretch themselves thin balancing child care and work or even to leave the workforce entirely.
Child care workers also are severely underpaid and have one of the highest turnover rates in the U.S. labor market, leading to unstable and inadequate care environments for many children and a dearth of quality, affordable providers for many others. Despite these challenges—all of which were exposed and worsened by the pandemic—policymakers have, year after year, failed to make the necessary public investments in early care and education and its workforce.
There is a broad base of evidence showing the importance of these investments and how they more than pay for themselves by boosting economic growth in both the short and long term. U.S. child care policy remains inadequate for how vital this industry is to the functioning of the overall economy. Research shows that the U.S. child care sector remains woefully unprepared to navigate future economic downturns and is on the brink of a potential crisis.
This month’s Expert Focus highlights scholars whose research will help inform U.S. early education and child care policy. The body of work put out by these and other early childhood experts shows that policy interventions will not only offer much-needed support to the child care workforce, but also strengthen family economic security and well-being, improve children’s future economic and health outcomes, and boost the broader U.S. economy.
Lea Austin
Center for the Study of Child Care Employment
Lea J.E. Austin is the executive director of the Center for the Study of Child Care Employment at the University of California, Berkeley, where she leads the center’s work to ensure the well-being of U.S. early educators. She is an expert on the U.S. early care and education system and its workforce, and has extensive research experience in the areas of compensation, preparation, working conditions, and racial equity in the child care sector. Recently, she has explored the effects of the COVID-19 pandemic on the child care sector and early care workforce, finding that preexisting disparities and challenges in the industry were deeply exacerbated by the economic and public health crises.
Jessica Brown
University of South Carolina
Jessica H. Brown is an assistant professor of economics at the University of South Carolina’s Darla Moore School of Business. Her primary research interests are in public and labor economics and the economics of the child care market. Her recent co-authored research looks into the impact of increased public investment in early childhood education, finding, for instance, that subsidizing families’ child care payments would increase mothers’ employment by 6 percentage points and full-time employment by around 10 percentage points, with most increases occurring among low-income families. Another recent paper, co-authored with Chris Herbst of Arizona State University, examines the effects of macroeconomic cycles on the child care industry, finding that child care employment requires more time than other low-wage industries to recover from downturns. Her investigations into how the child care market responds to early care and education policy change have helped inform policymakers and advocates in crafting policy solutions that promote the stability of the entire early care and education market.
William Gormley
Georgetown University
William T. Gormley is university professor and professor of government and public policy at Georgetown University, as well as the co-director of the university’s Center for Research on Children in the United States. For nearly two decades, Gormley has worked to shape early childhood education and child care policy. His extensive work on the Tulsa preschool project—which began in 2001 to track the effects of Oklahoma’s universal pre-Kindergarten program—has been covered by many popular media outlets and academic journals. He also has recently written on universal pre-K and how to make it work in the U.S. context, analyzing President Joe Biden’s calls on Congress in 2021 to pass a nationwide public preschool program.
Julia Henly
University of Chicago
Julia R. Henly is a professor in the Crown Family School of Social Work, Policy, and Practice at the University of Chicago, where she also serves as deputy dean for research and faculty development. Her research interests lie in the economic and caregiving strategies of low-income families and the design, implementation, and effectiveness of employment and child care policy and programs. Her ongoing projects include investigations into how COVID-19 impacted center- and home-based child care programs, equity in child care subsidy access and the effects of recent subsidy policy changes on program participation, child care decision-making of low-income families who use child care subsidies and families seeking care in Latino communities, and the effects of work schedule precarity and workplace flexibility on worker and family well-being. In 2021, Henly was awarded an Equitable Growth grant with David Alexander of Illinois Action for Children to further her work on child care subsidies and the home-based child care sector, particularly amid the COVID-19 pandemic.
Taryn Morrissey
American University
Taryn Morrissey is a professor in the Department of Public Administration and Policy at American University. In the spring and summer of 2022, she was on leave from her faculty position to work at the Office of Child Care at the U.S. Department of Health and Human Services. Her research focuses on public policies for children and families, including early care and education, nutrition and income assistance, and paid family leave, as well as family economic instability. Recent co-authored research includes a paper that looks into the connection between parent economic stability and the stability of children’s child care subsidy receipt, as well as another paper on access to early care and education in rural communities. In 2020, Morrissey contributed a chapter to Vision 2020: Evidence for a stronger economy, a compilation of 21 essays to shape the policy debate published by Equitable Growth. Her essay examined the need for affordable, high-quality, and universal early care and education in the United States.
Corey Shdaimah
University of Maryland, Baltimore
Corey Shdaimah is the Daniel Thursz Distinguished Professor of Social Justice at the University of Maryland School of Social Work. Her research focuses on the policy implications of child care, dependency court, and street-based sex work. Recent media appearances focus on the U.S. child care sector, including the failure to support families and providers who bear care responsibilities. In 2021, she received an Equitable Growth grant, alongside Bweikia Steen of George Mason University and Elizabeth Palley of Adelphi University, to study the various challenges facing informal, home-based child care providers in the United States—a relatively unstudied group. She is also the co-author, with Palley, of In Our Hands: The Struggle for U.S. Child Care Policy (NYU Press, 2017), a book that explores why there hasn’t been much policy action to improve the U.S. child care industry.
Equitable Growth is building a network of experts across disciplines and at various stages in their career who can exchange ideas and ensure that research on inequality and broadly shared growth is relevant, accessible, and informative to both the policymaking process and future research agendas. Explore the ways you can connect with our network or take advantage of the support we offer here.
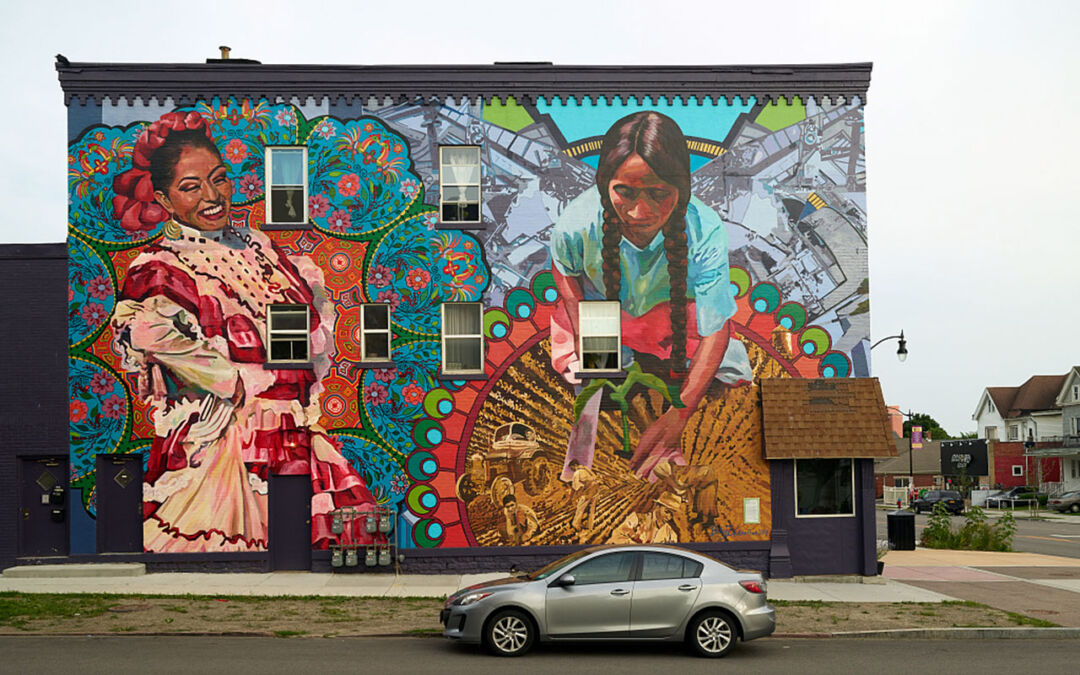
Betsy Casañas 2017 mural celebrating the contributions made by the region’s Hispanic and Latinx communities, Buffalo, New York.
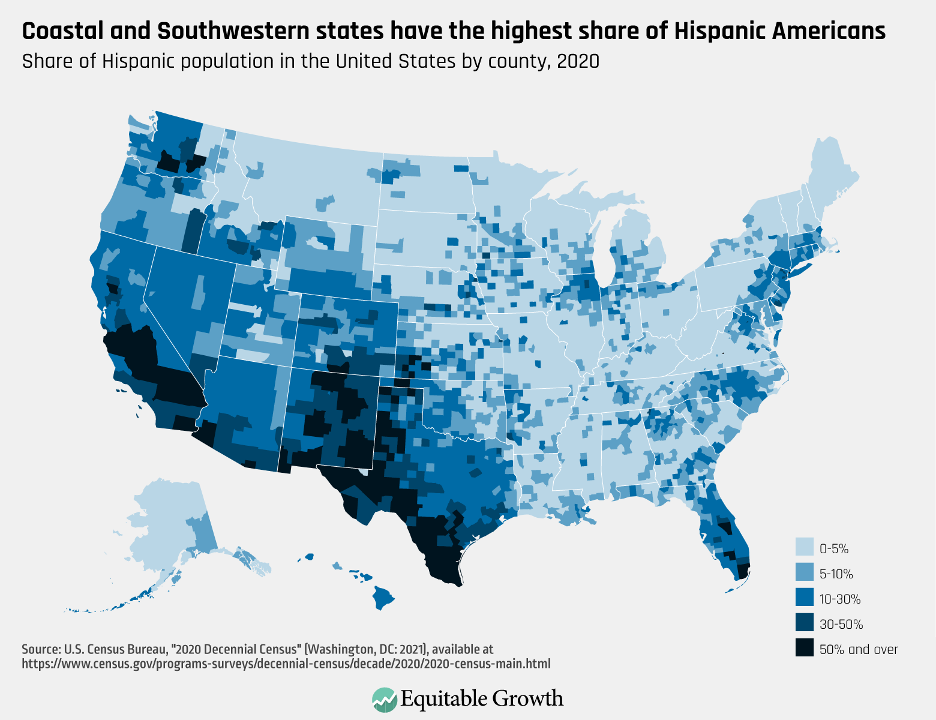
Between 2010 and 2020, the Hispanic American population grew 23 percent, making it one of the fastest-growing communities in the United States. According to the 2020 decennial census, Hispanic Americans make up 20 percent of the total U.S. population. Figure 1 shows the geographic distribution of Hispanic Americans by county in the 2020 decennial census.
Figure 1
Disaggregating economic and social data by race and ethnicity allows researchers to better understand the socioeconomic well-being of Hispanic communities and other communities and their key contributions to U.S. economic growth, allowing policymakers to create legislation and regulations that tackle the issues these specific communities face.
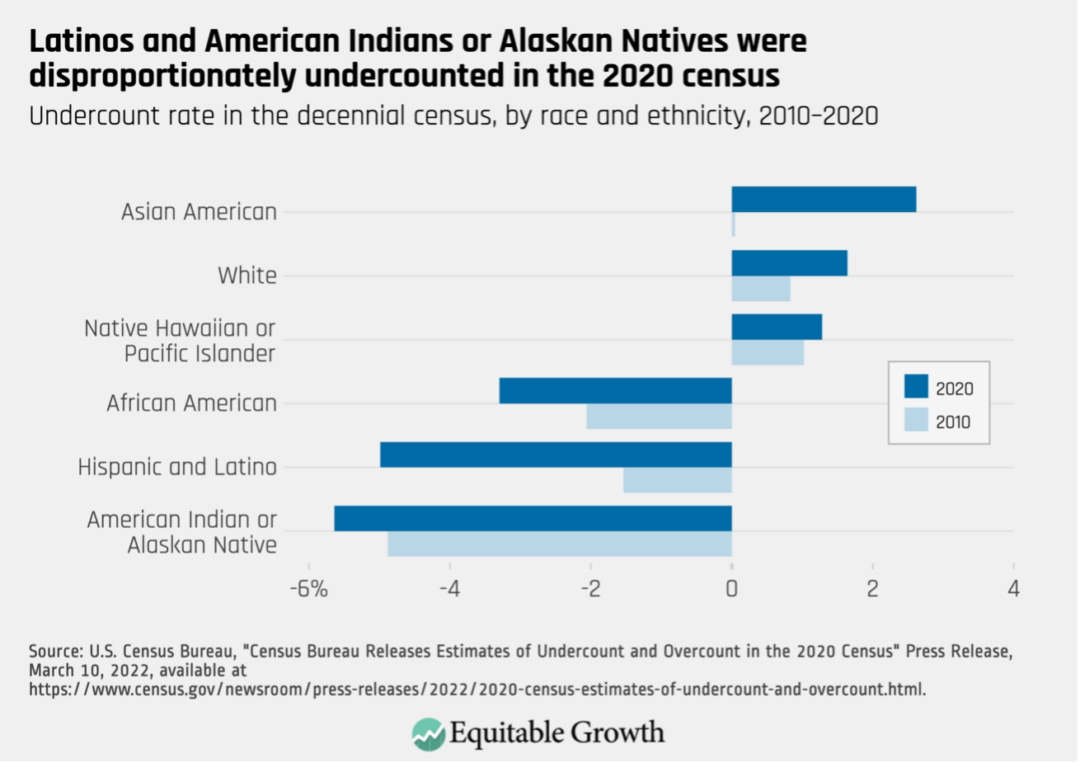
Yet studies show that Hispanic Americans have a lower response rate to federal surveys than other racial and ethnic groups. In the most recent decennial census, for example, survey collectors reported that Hispanic Americans had the second-highest undercount rate of all racial or ethnic groups after American Indians and Alaska Natives. (See Figure 2.)
Figure 2
Approximately 1 out of every 20 members of the Hispanic community was not counted in the most recent census in 2020. That undercount will impact the creation of local and federal voting districts and the allocation of federal funds for community development in Hispanic-populated regions.
This is not a new issue for the U.S. Census Bureau, and the agency is open to new ways of counting non-White populations. The Census Bureau first began collecting data on Hispanic communities in the 1930 decennial census by including “Mexican” as an option to the race/ethnicity question. Federal data collection has come a long way since then in providing a more inclusive list of race and ethnicity options from which respondents can choose.
The most recent census in 2020 includes options for Hispanic respondents to indicate their country of origin. Adding inclusive race and ethnicity options in surveys is important, but survey collection is only successful if enough members of the population respond to these surveys.
As mentioned above, recent analysis indicates that members of Hispanic communities have a lower response rate to federal surveys than other race or ethnic groups. There are many reasons for the discrepancy in the response rates, but researchers identify three potential causes that have a significant impact on response rates:
Distrust of government
Language barriers related to data collection
Lack of inclusive race and identity options in survey questions
In this column, I briefly survey the current research on each of these three factors. Resolving these discrepancies in response rates will enable policymakers to better understand how economic inequality may be affecting Hispanic communities and enable them to design policies that create more equitable—and thus stronger and more sustainable—economic growth.
Government distrust
Hesitancy in responding to surveys often stems from a general distrust of government or fear of deportation even among those who are legally residing in the country, often because respondents residing legally in the country live with or are related to undocumented immigrants. Federal law states that federal statistical agencies can only use data collected in federal surveys for statistical purposes. In other words, sensitive information from these surveys cannot be shared with other agencies and cannot be used to identify individuals within specific populations.
Yet with the rise in hateful rhetoric about immigrants, often from elected officials, many members of Hispanic communities say they can’t trust the government to protect them, even if their health and safety is at risk. In a recent survey on public trust, only 29 percent of Hispanic respondents said they trust the government in 2022, as opposed to 57 percent of Hispanics in 1998.
The U.S. Supreme Court eventually ruled that the 2020 census would not contain a citizenship question. But the damage was already done: The National Association of Latino Elected and Appointed Officials Educational Fund reported that even after the Supreme Court’s ruling, members of Hispanic communities were hesitant to fill out the survey over fears of a citizenship question.
Despite statistical agencies reassuring respondents that information collected in federal surveys is kept confidential, one Census Bureau study found that 31 percent of Hispanic respondents “were ‘extremely concerned’ or ‘very concerned’ that the Census Bureau would share their answers with other government agencies,” and 34 percent of respondents who answered the survey in Spanish said that they feared that their answers would be used against them. This general distrust in government is present in other demographic groups, but it particularly hurt Hispanic communities in the 2020 decennial census.
In 2015, surveys such as the decennial census and the American Community Survey were used to determine how 132 federal programs distributed almost $700 billion in federal funding. A misestimation of the disaggregated composition of the U.S. population means that this vital funding could ignore thousands of vulnerable households among historically marginalized communities.
Rebuilding trust in government is the first step in improving survey response rates for Hispanic communities. In a series of focus groups of Census Bureau field representatives and supervisors, these representatives indicated that some Spanish-speaking survey respondents were hesitant to complete surveys if they were required to share personal information on surveys. But when they were encouraged to provide fake names, they acquiesced.
Field respondents and the Center for Survey Management consequently recommended that in order to erase some of the distrust in federal surveys, survey questionnaires should include language at the start that ensures anonymity and security of data. Additionally, they recommended that field respondents who go door to door collecting survey data receive training on how to interact with communities who fear government, including clearly identifying themselves as not immigration officers.
Emphasizing the importance of completing surveys for the benefit of individual communities can help erase the distrust component for the sizable survey nonresponse rates among Hispanic populations. In a private study on recruiting Hispanic and Latino survey respondents, the report’s authors indicated that in addition to explicitly stating the privacy measures agencies intend to take to protect individuals’ identities, survey administrators should emphasize the impact that participation may have on respondents’ communities. Stressing the effects that federal survey results have on disproportionately affected communities can inspire individuals to complete surveys in the name of community improvement.
Additionally, a 2015 study of survey response patterns among African Americans and Latinos found that respondents were more likely to participate in and complete a survey if they learned about it though members or agencies within their communities. As such, the Census Bureau partnered with numerous community organizations to try to spread the word about the importance of completing the 2020 census. Going forward, broadening these partnerships for the next census and applying this approach to other federal survey outreach plans, such as those for the American Community Survey and the Current Population Survey, can improve the quality of data collected on the economic and societal well-being of vulnerable populations.
Language barriers and collection methods
After English, Spanish is the most-commonly spoken language in the United States, with more than 42 million people in the country speaking Spanish in their homes. The federal statistical agencies know that to capture an accurate representation of the U.S. population, they need to provide bilingual survey options, especially in Hispanic-populated areas.
The 2020 census was offered in 12 languages besides English. In addition to making it possible for non-English speakers to respond to federal surveys, this practice opens up possibilities for more disaggregated analysis of the U.S. population. The Census Bureau found, for example, that respondents to the Census’ Household Pulse Survey Spanish questionnaire reported double the rates of food insecurity during the COVID-19 pandemic than Hispanic-identifying respondents who took the English version of the survey. This discrepancy could be the result of Spanish-only speakers or those with limited English language proficiency facing economic, social, and health barriers when navigating U.S. institutions and communities that largely favor English.
Bilingual questionnaires are common practice today, but some researchers argue that the existing structures of the administration of bilingual verbal surveys might fail to accurately capture more accurate data. In their National Survey of Latinos, for example, the Pew Research Center conducted over-the-phone surveys using two methods: a fully bilingual method in which interviewers were prepared to collect respondent’s data in either English or Spanish, and a modified bilingual method in which interviewers only spoke English. In this latter method, if interviewers encountered a respondent who preferred to answer the survey only in Spanish, then they would inform respondents that they would instead receive a call from a Spanish-speaking interviewer.
The Pew study found that more interviews with Spanish-language-dominant respondents were conducted with the fully bilingual method over the modified bilingual method. The Census Bureau has already taken steps to ensure the decennial census in 2030 maintains the fully bilingual method for phone interviews. Applying this methodology to all federal surveys, including the American Community Survey and the Current Population Survey, could ensure better-quality information on various communities as a whole.
Noninclusive race and identity options
Confusion over how to identify one’s race and ethnicity has led to inconsistencies in data collection among Hispanic communities. According to the federal government, “Hispanic” is an ethnicity to identify people “of Cuban, Mexican, Puerto Rican, South or Central American, or other Spanish culture or origin regardless of race.”
To help respondents identify themselves within this definition, the federal government, over the past decade, has established a two-question structure for asking respondents about their race and ethnicity: They first ask if respondents are Hispanic or Not Hispanic to determine ethnicity and then ask what race they identify themselves as, with the choices of White, Black, Asian, American Indian or Alaska Native, two or more of these choices, or Other.
Not surprisingly, this type of question structure can cause confusion for those who may consider “Hispanic” to be a race rather than an ethnicity or who don’t identify with the provided race options. In an analysis of the 2010 census, researchers found that 13 percent of respondents who selected “Hispanic” in the ethnicity question left the race question blank, and another 30 percent of such respondents wrote in “Hispanic” for the race question.
Furthermore, a 2015 Pew Research study found that different respondents have very different impressions of what these questions are asking. Their polling found that 42 percent of Hispanic adults consider “Hispanic” to be a matter of one’s culture, while 29 percent said that it was a matter of ancestry and another 17 percent said it was a matter of race.
Results from the 2020 census show that Hispanic respondents primarily identified as being “Some other race” or “White,” yet previous test surveys conducted in advance of the 2010 census found that most Hispanic respondents who selected “White” as their race did not actually identify as White but did so in order to complete the survey. When Hispanics select “Some other race,” they are putting themselves in a category that also includes Middle Eastern and North African respondents and many others.
In fact, “Some other race” is now the second-most frequently selected category on the Census after “White.” The category has become so large, it has little analytical value, and its catch-all quality is obscuring the true number of Hispanics in the United States.
In order to dispel confusion surrounding race and ethnicity and improve the accuracy of self-reported race statistics, federal statistical agencies have been experimenting with the structure of this question. In 2016, the Census Bureau studied what the effects a combined race and ethnicity question would have on survey responses. This structure added “Hispanic, Latino, or Spanish origin” to the list of previously designated races and asked respondents to write out their origin.
The results indicate that this structure not only made it easier for Hispanic respondents to accurately self-identify their race and ethnicity, but also improved the accuracy of those who identified as Hispanic and another race category. Under this new structure, for example, someone who identified as Hispanic and Dominican would be able to identify as such, rather than Hispanic and “Some other race.”
Demographic experts suggest that adopting this approach to federal survey collection, not just in the decennial census but also across all federal surveys, would reduce the share of Hispanic respondents identifying as “Some other race” and could improve Hispanic undersampling rates.
Fixing the nonresponse problem in the collection of federal survey data is not easy. It requires federal survey administrators to assess the causes in each community and be attentive to building public trust, breaking down language barriers, and establishing more-inclusive identity questions. In their efforts to improve response rates among the Hispanic community in advance of the 2030 decennial census and other federal data collection efforts, federal statistical agencies should revisit current practices to ensure they are leveraging the newest research on factors that influence response rates for Latinos and other ethnicities.
Incorporating this approach can lead to improved representation of Hispanic and Latino communities, better funding for programs vital to these communities, and a greater sense of inclusivity among all demographic groups in America. The resulting data would enable U.S. policymakers to produce more equitable economic policies that, in turn, drive stronger and more sustainable U.S. economic growth.
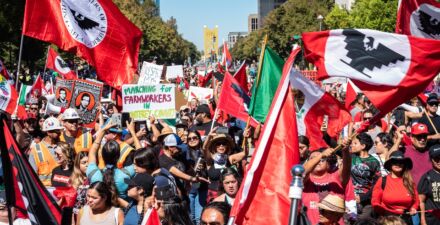
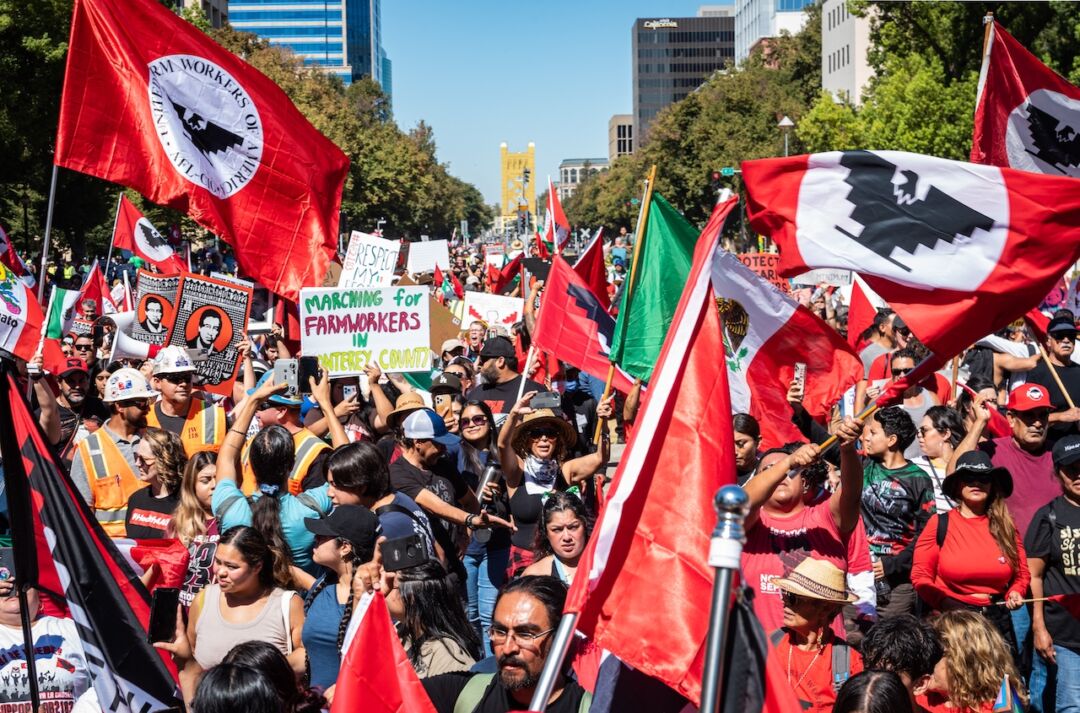
Latino workers represent a large and growing share of the U.S. workforce. But even with the highest employment rates in the United States, Latinos face a number of barriers to accessing good jobs and economic security. Their median earnings are lower than those of their Black, White, and Asian American counterparts. And along with Black workers, Latino workers tend to be especially vulnerable to losing their jobs amid economic contractions.
What’s more, insufficient bargaining power, gaps in legal protections, discrimination, and social norms all can cluster Latino workers into jobs that pay low wages, offer little in terms of employer-sponsored benefits, and rank high in labor law violations. Unions and labor organizers, however, have long pushed back against these obstacles, delivering important gains for both Latino and non-Latino workers.
In the mid-20th century, for example, the late union activist Emma Tenayuca fought for fair wages, advocated for workers’ right to unionize, and led what continues to be one of the largest strikes in U.S. history. In the early 1960s, civil rights activists and organizers Dolores Huerta and Cesar Chavez co-founded what is now the United Farm Workers. As one of the first and longest-lasting farmworkers unions in the country, the UFW played an important role in securing better working conditions in the agricultural sector—in which Latinos disproportionately are employed—including regulations that protect workers against the harms of heat and pesticides.
Then, between the late 1980s and early 2000s, the Justice for Janitors movement achieved better pay, greater access to benefits, and union contracts for many of these workers at a time when domestic outsourcing began to greatly deteriorate job quality in janitorial services. Janitorial services is an occupation in which Latinos represent almost a third of the overall workforce.
More recently, through both worker organizing and policymaking efforts, Chief Officer of the California Labor Federation Lorena Gonzalez Fletcher helped secure overtime protections for farmworkers and improve labor standards for fast-food workers in California. And in the past few years, unions maintained wages and protected workers against job loss as the COVID-19 crisis launched the economy U.S. economy into a recession.
Indeed, a report by the Latino Policy and Politics Institute at the University of California, Los Angeles finds that workers covered by unions were less likely to experience unemployment during the height of the pandemic. This protective effect, the report finds, was particularly strong for unionized Latinos.
This column examines some of the employment characteristics that determine whether a job is high or low quality, how occupational segregation can sort Latino men and Latina women into jobs with poor working conditions, and how greater worker bargaining power and effective public policy can boost job quality for all workers. While there are many components that go into determining whether a job is good, the focus of this column is on predictable schedules, workplace safety, and minimum wage standards—job characteristics that are not as frequently discussed as pay and access to employer-sponsored benefits but that affect working conditions in many occupations, including those in which Latino workers represent a disproportionately high share of the workforce. Addressing these disparities through greater worker power would go a long way toward narrowing economic inequality in the United States and boosting overall U.S. economic growth.
Right now, Latino workers face several barriers to accessing good jobs
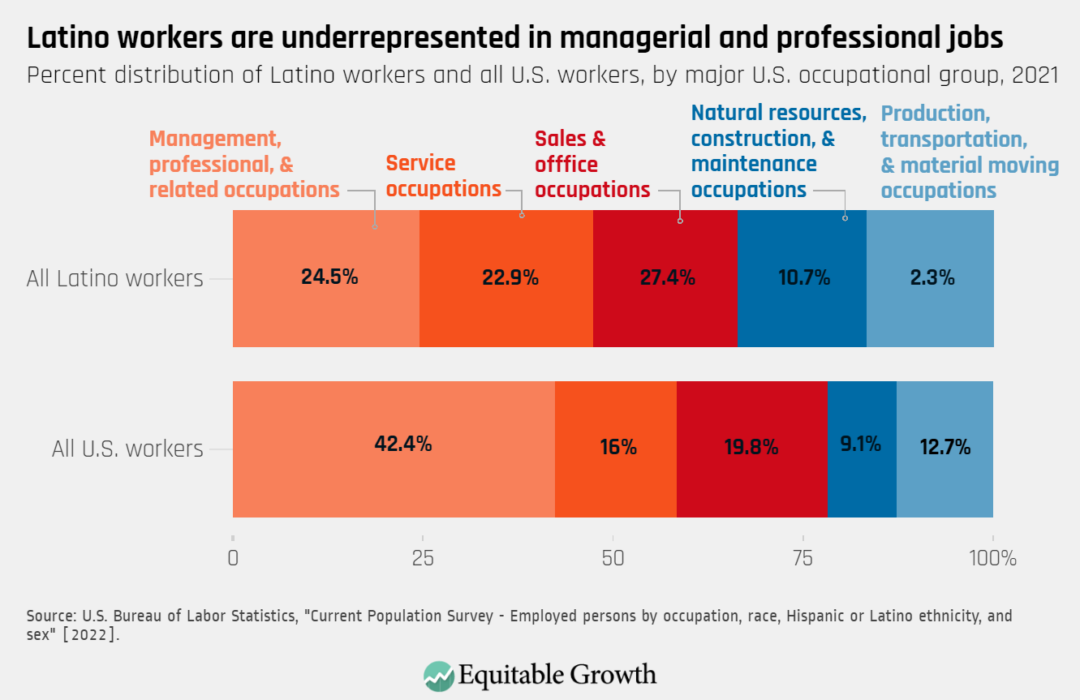
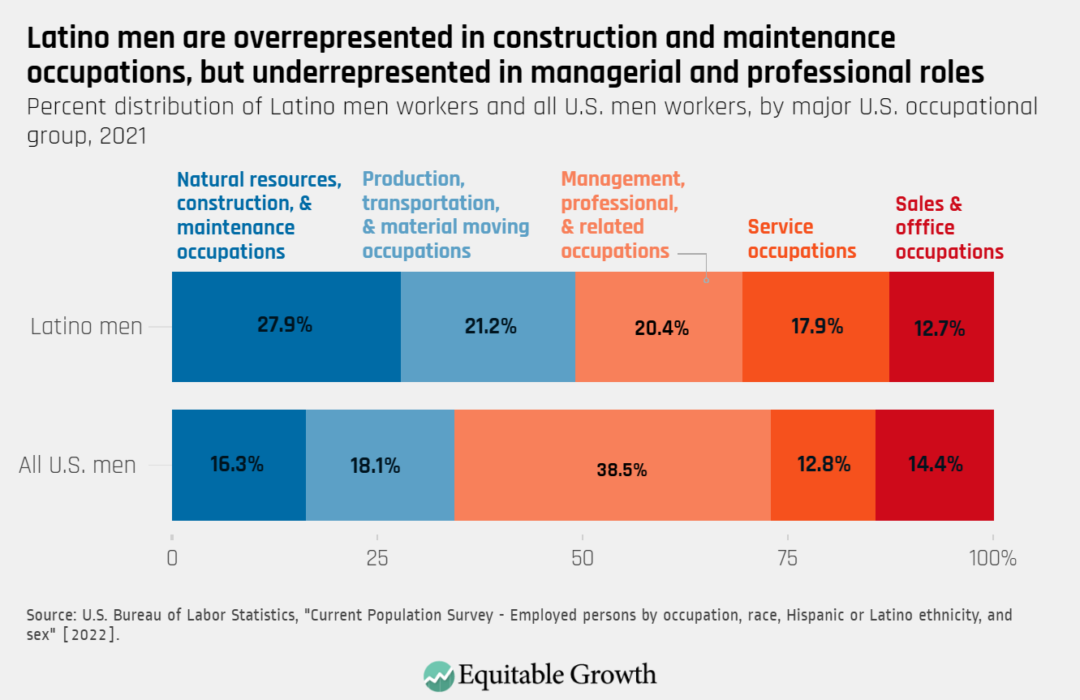
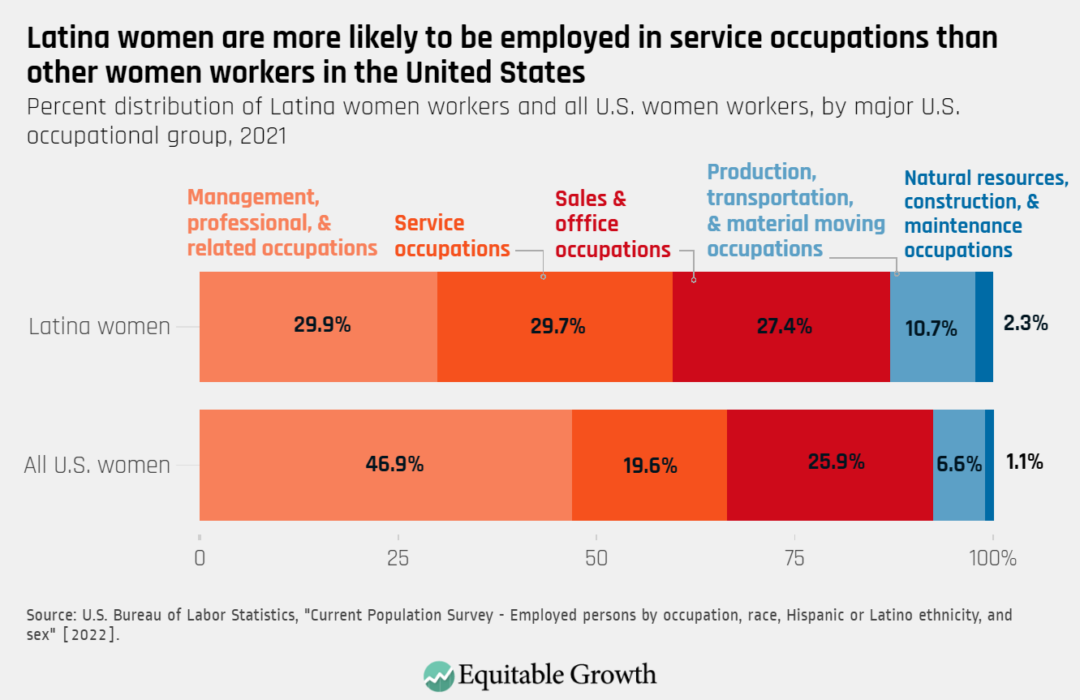
Latino men and Latina women are more occupationally segregated than men and women of any other major ethnic group. In other words, Asian American, Black, and White men are all more likely to work in the same occupation as the women workers of their same racial or ethnic group than Latino men are to work in the same occupation as Latina women.
Specifically, occupational segregation results in an overrepresentation of Latino men in natural resources, construction, and maintenance jobs. In contrast, Latina women are overrepresented in service occupations. And both Latino men and Latina women are underrepresented in the highest-paying jobs in management and professional occupations. (See Figures 1, 2 and 3.)
Figure 1
Figure 2
Figure 3
But even though Latino men and Latina women are overrepresented in different types of jobs, occupational sorting hurts them in the U.S. labor market. In general, structural and interpersonal discrimination, unequal access to education and training opportunities, cultural norms and expectations, social networks, and hostile working environments all can make some jobs more or less accessible to different groups of workers, resulting in an uneven occupational distribution that exacerbates economic disparities and holds back U.S. economic growth.
For instance, occupational sorting by gender, race, and ethnicity can result in a misallocation of talent by keeping workers from holding jobs that are a good fit for their interests and skills. A team of researchers finds, for example, that as women and Black workers faced fewer barriers to accessing higher-paying jobs after the 1960s, more workers could pursue their competitive advantage, thus boosting aggregate U.S. productivity. They estimate that greater occupational integration thus accounts for about two-fifths of the growth in the country’s Gross Domestic Product per person between 1960 and 2010.
For marginalized groups, occupational segregation does not only mean that already-vulnerable workers are more likely to be clustered into lower-paying jobs. Occupational stratification also leaves some workers especially exposed to economic contractions, explains an important chunk of the stubbornly persistent gender, racial, and ethnic wage divides that exist in the U.S. economy, and entrenches wealth inequality. Occupational segregation also means that some workers are more likely to be exposed to low-quality job traits, such as poor scheduling practices, unsafe working conditions, and labor law violations.
Fair scheduling
Take poor scheduling practices first. When U.S. employers do not provide information about schedules ahead of time, workers have little or no say about when and how long they work, and work hours vary substantially from week to week, making it much more difficult for workers to organize their lives and achieve economic security. Research finds that people working precarious schedules are more likely to experience hunger, struggle to find child care, and experience material hardship. Because low-wage workers, particularly low-wage workers of color, are more likely to experience last-minute shift changes and other bad scheduling practices, low-quality schedules also perpetuate existing economic disparities.
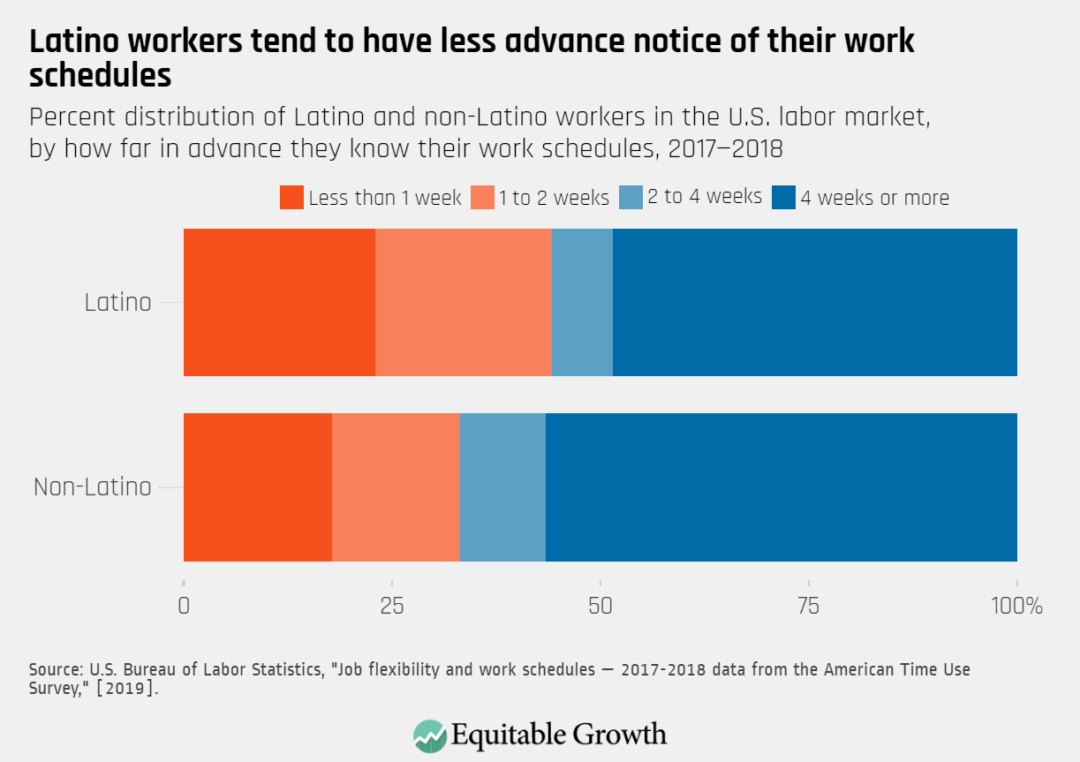
Many Latino workers are exposed to bad schedules. According to data collected between 2017 and 2018 by the U.S. Bureau of Labor Statistics, Latino workers are much less likely than their non-Latino counterparts to be able to shift their schedules according to their preferences. Further, the same data show that a relatively small share of Latino workers receives information about their schedules ahead of time. The data show that 57 percent of non-Hispanic workers know their work schedules at least 4 weeks in advance, but for Latino workers, that number shrinks to 49 percent. Indeed, almost a quarter of all Latino workers have less than 1 week’s notice about their schedules. (See Figure 4.)
Figure 4
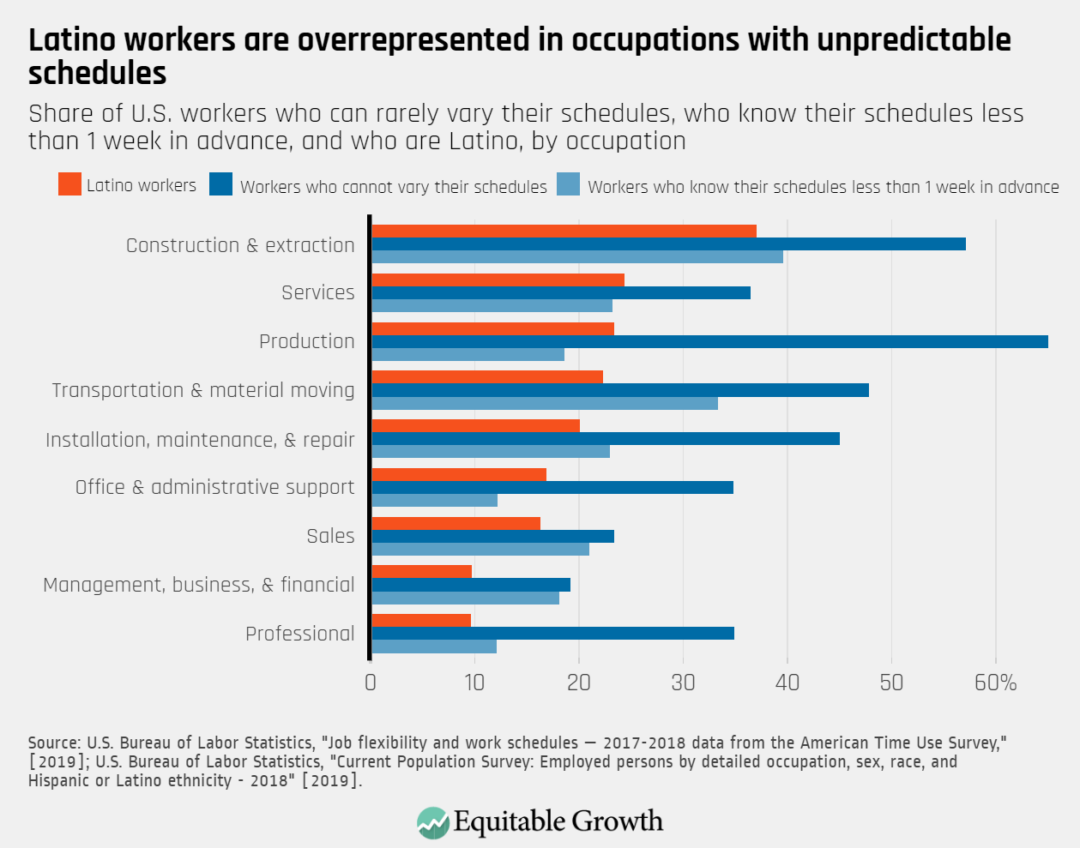
An important reason why Latino workers are less likely to have good schedules than their non-Latino counterparts is that they are overrepresented in jobs and industries in which problematic scheduling practices are more prevalent. Latinos represent about 18 percent of all workers in the United States. In construction and extraction occupations—jobs in which Latinos represent 39 percent of the overall workforce—almost 40 percent of workers know their schedules with less than 1 week’s notice.
Latino workers also make up a disproportionately high share of workers in some of the occupations that have the most rigid schedules. For instance, Latino workers represent almost 25 percent of all workers in production occupations—jobs in which 65 percent of workers are not able to vary the times they begin or end their workday. (See Figure 5.)
Figure 5
But research by Adam Storer at the University of California, Berkeley, Daniel Schneider at Harvard University, and Kristen Harknett at the University of California, San Francisco also shows that occupational segregation alone cannot fully explain why Latino workers are more likely to have precarious schedules. In other words, even when employed in the same type of job, Latinos seem to have worse schedules than their White counterparts.
Indeed, using survey data from workers employed in the largest retail or food-service firms in the United States, the team of researchers finds that having a manager of a different race or ethnicity, overrepresentation in firms with poorer scheduling practices, and discrimination also help explain why both Black and Latino workers are especially likely to work unstable and unpredictable hours.
Workplace safety
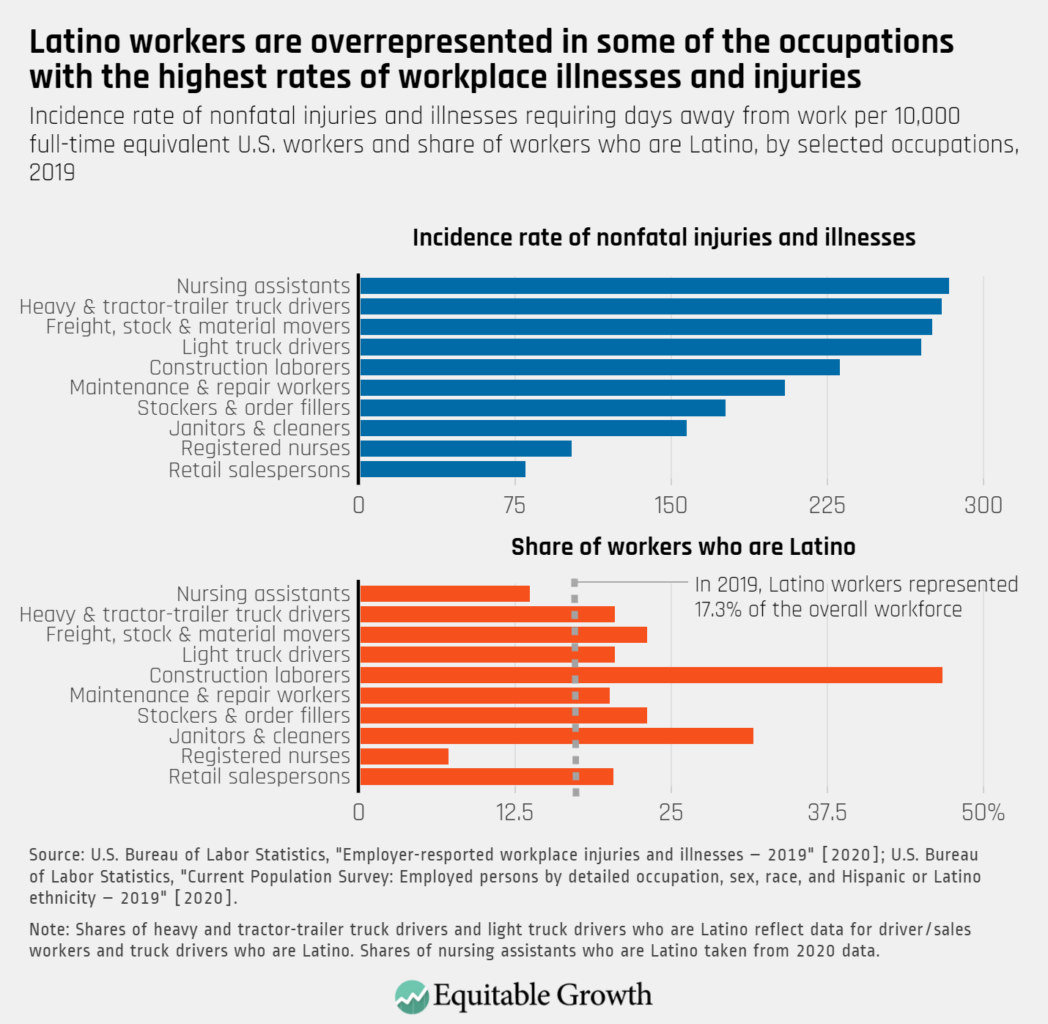
Workplace safety is one of the most basic components of a good job, yet many workers in the U.S. are exposed to dangerous working conditions. Even before the onset of the COVID-19 crisis in 2020, private-sector employers in 2019 reported 2.8 million injuries and illnesses at work. That same year, there were more than 5,000 fatal work injuries. In 2020, illnesses at work skyrocketed at the same time that injuries dropped, leading to a total of 2.7 million employer-reported nonfatal injuries and illnesses that year.
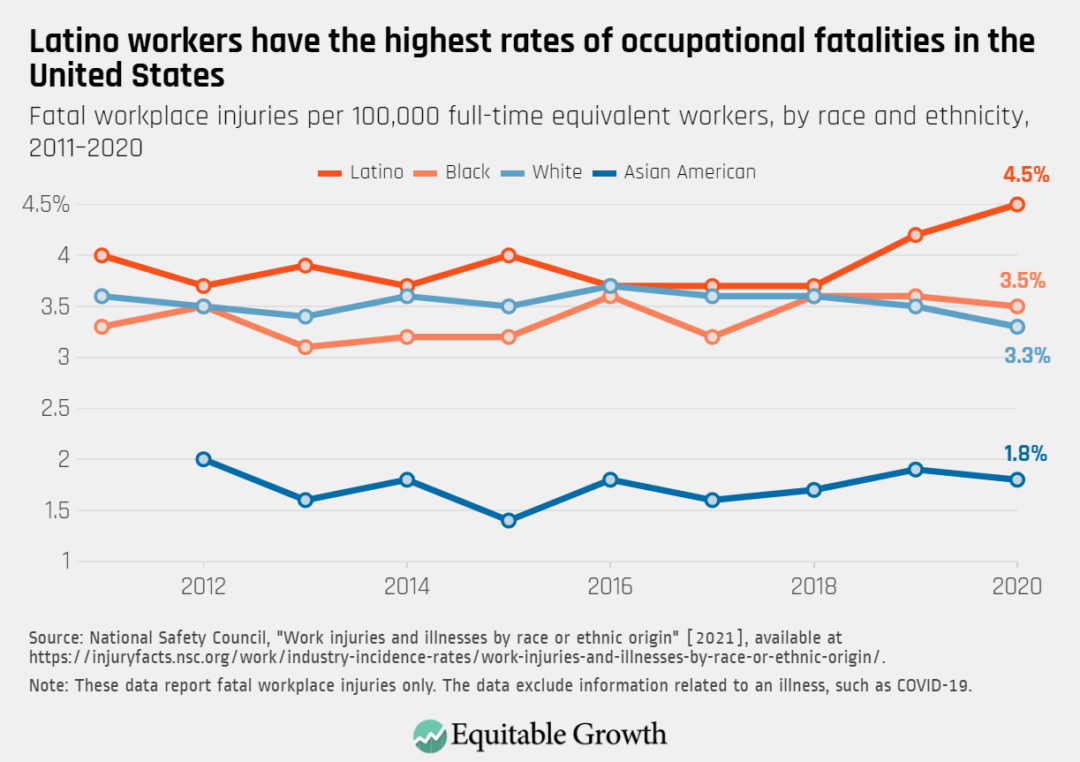
The total number of fatal work injuries did decline during the first year of the pandemic, but for Latinos, the occupational fatality rate actually climbed from 4.2 per 100,000 workers in 2019 to 4.5 per 100,000 workers in 2020. Latino workers thus face the greatest rates of fatal injuries at work, followed by Black workers, White workers, and Asian American workers. (See Figure 6.)
Figure 6
As with poor-quality schedules, overrepresentation in certain types of jobs is an important reason why Latino workers are disproportionately likely to experience dangerous working conditions. Indeed, Latinos make up a large share of workers in some of the occupations in which incidences of both fatal injuries and nonfatal injuries and illnesses in 2019 were highest, representing about 21 percent of all truck drivers, 23 percent of all freight, stock, and material movers, and 47 percent of all construction laborers.
Overall, evidence suggests that even when accounting for level of formal education, Latino men who are not U.S. citizens are more likely to work in risky occupations than any other group of workers. (See Figure 7.)
Figure 7
In 2020, the COVD-19 pandemic triggered an explosion of work-related illnesses. The onset of the health crisis shifted the brunt of risky conditions at work toward nursing jobs—positions in which women in general, and Black women in particular, are greatly overrepresented.
For Latino workers, available evidence shows that overrepresentation in essential occupations and industries, such as agriculture (where crop and farmworkers often live in crowded housing), food processing and meatpacking plants (the sites of some of the worst COVID-19 outbreaks), food preparation and serving (where in-person interactions expose workers to infections), and construction (an industry in which very few workers have access to paid leave) play a large role explaining their higher-than-average COVID-19 infection rates.
Gaps in legal protections leave millions of workers in the United States exposed to abuses and poor working conditions. For instance, many farmworkers and domestic workers are excluded from important provisions in the Fair Labor Standards Act, which establishes a federal minimum wage floor, child labor laws, and the right to overtime pay. Similarly, agricultural workers, domestic workers, and independent contractors are not covered by the National Labor Relations Act, which guarantees workers’ right to organize, form and join unions, and bargain collectively. And workers in private households are also excluded from standards and retaliation protections included in the Occupational Safety and Health Act.
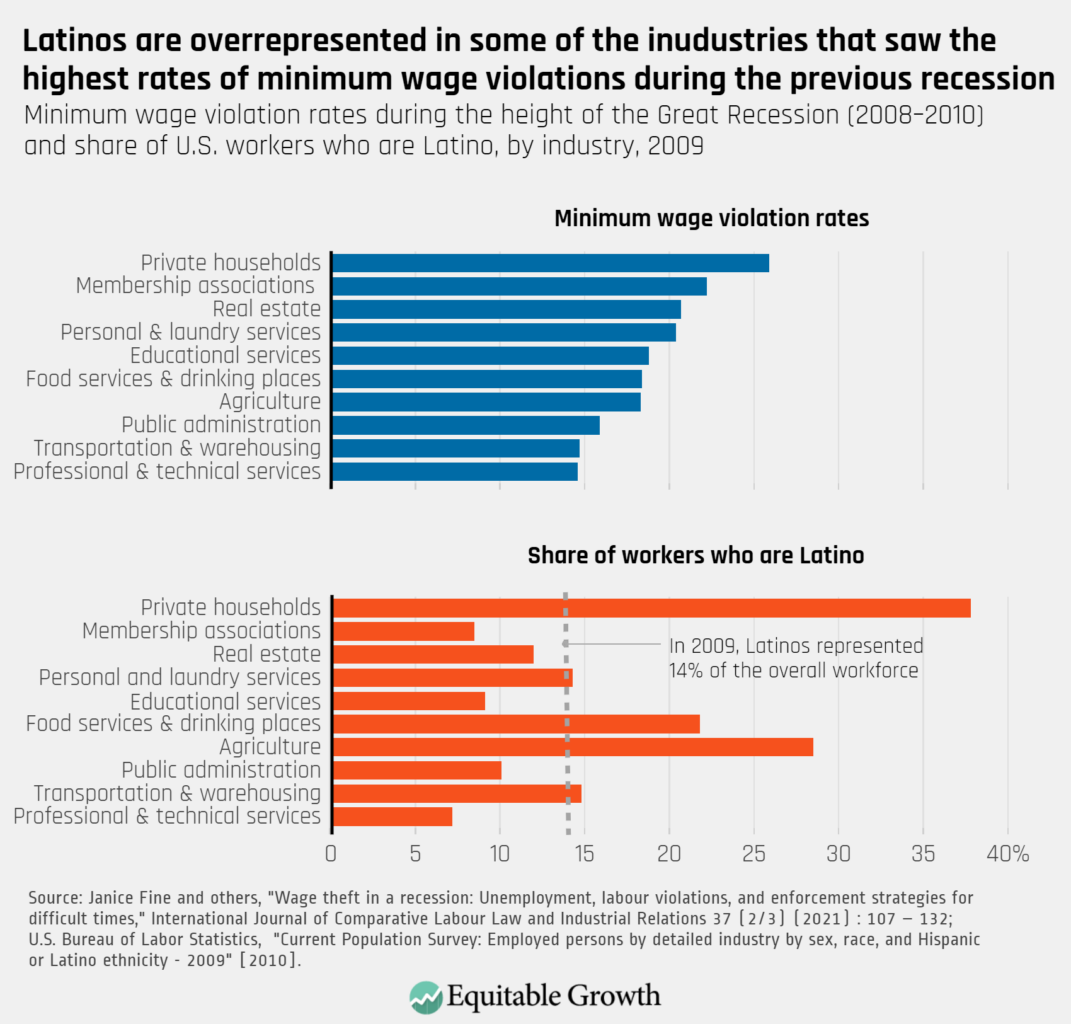
Latino workers are not only disproportionately likely to work in the domestic and agricultural jobs that are not covered by some of the country’s key labor protections, but also are overrepresented in occupations and industries in which outright violations to labor law are high. Research by Janice Fine, Jenn Round, and Hana Shepherd of Rutgers University and Daniel Galvin of Northwestern University shows, for example, that as wage theft rose in tandem with the unemployment rate during the Great Recession of 2007–2009, minimum wage violation rates were highest for workers in private households, membership associations, real estate, food services, and agriculture. (See Figure 8.)
Labor unions and worker power help increase job quality
While many U.S. workers are exposed to poor scheduling practices, unsafe working conditions, and labor law violations, research finds that unions can push back against these bad-job traits in a number of ways. For instance, research shows that greater union coverage is associated with a decline in violations to labor regulations, including those enforced by the U.S. Occupational Safety and Health Administration, the U.S. Department of Labor’s Wage and Hour Division, and the National Labor Relations Board.
Research also shows that unions boost support for measures that protect workers against illegal employment practices, with one study finding that states with higher union density are more likely to pass anti-wage-theft legislation. And because unions help workplaces meet U.S. labor laws and regulations, both academics and advocates have called for “co-enforcement,” in which government agencies partner with labor and community-based organizations to encourage, help, and generate support for workers filing complaints of violations by their employers.
In addition, there is strong evidence that unions help make workplaces safer. Research on the manufacturing sector by David Weil at Brandeis University finds, for instance, that union establishments are substantially more likely to enforce health and safety regulations than nonunion establishments. Similarly, in a recent study, Adam Dean at George Washington University, Jamie McCallum at Middlebury College, Simeon Kimmel at Boston University, and Atheendar Venkataramani at the University of Pennsylvania find that the presence of a labor union in nursing homes is associated with lower COVID-19 infection rates. Indeed, the team of researchers shows that in unionized nursing homes, resident COVID-19 mortality rates and staff COVID-19 infection rates were 11 percent and 7 percent lower, respectively, than in nonunion nursing homes.
There many other ways in which unions improve job quality. Union workers are much more likely to successfully apply for Unemployment Insurance benefits after involuntarily losing a job, and union members are more likely to have access to employer-sponsored benefits, such as health insurance, paid sick leave, and retirement plans, than their nonunion counterparts.
Workers belonging to unions also have what researchers call a union wage premium—earnings that are higher than for otherwise-similar nonunion workers. While union members in general benefit, the boost in pay that Black and Latino workers get by belonging to a union is especially large. For Latino workers and workers in the United States overall, labor unions and the ability to bargain collectively offer recourses against employer retaliation, mechanisms to better enforce labor laws and regulations, greater equity in pay, and job security.
Indeed, measures such as extending collective bargaining protections under the National Labor Relations Act to independent contractors, domestic workers, and agricultural workers would be an important step toward creating higher-quality jobs in sectors of the U.S. economy that too often have poor working conditions.
On October 7, the U.S. Bureau of Labor Statistics released new data on the U.S. labor market during the month of September. Below are five graphs compiled by Equitable Growth staff highlighting important trends in the data.
The employment rate for prime-age workers declined to 80.2 percent in September 2022 from 80.3 percent in August, with total nonfarm employment rising by 263,000.
The unemployment rate decreased to 3.5 percent in September and remains higher for Black workers (5.8 percent) and Latino workers (3.8 percent), compared to White workers (3.1 percent) and Asian American workers (2.5 percent).
Private-sector employment continued to rise in September, while public-sector employment declined slightly and remains below pre-pandemic levels.
Nominal wage growth (not accounting for inflation) cooled in September, with average hourly earnings growth at 5 percent over the past 12 months.
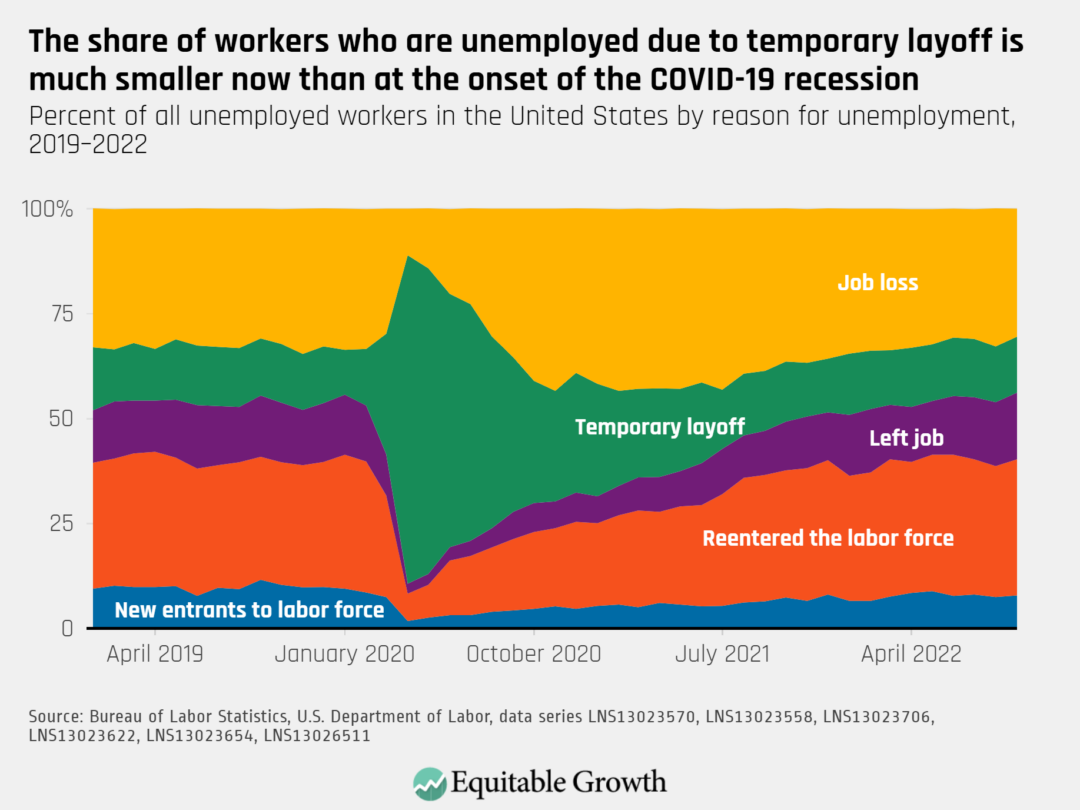
The number of unemployed workers decreased in September. The share who are unemployed due to job loss fell to 30.5 percent, and 13.3 percent have been temporarily laid off; 15.9 percent left their jobs, 32.4 percent are re-entering the labor force, and 7.9 percent are new entrants.
The Washington Center for Equitable Growth each year offers funding and mentorship opportunities to two pre-doctoral students through our Dissertation Scholars program. This program, whose application coincides with Equitable Growth’s annual Request for Proposals, offers students in the social sciences opportunities for professional development, trainings, and exposure to how we bridge the academic and policymaking communities.
Equitable Growth is excited to announce that the Dissertation Scholars for the 2022–23 academic year are Sheridan Fuller of Northwestern University and Gonçalo Pessa Costa of the CUNY Graduate Center.
Fuller, a Ph.D. candidate in human development and social policy, is returning to Equitable Growth as a Dissertation Scholar for a second year. His research examines the long-term impact of families’ access to economic resources provided through traditional U.S. income support programs, such as Aid to Families with Dependent Children (now Temporary Assistance for Needy Families, or TANF), as well as racial disparities in access to these resources.
Specifically, Fuller studies how these programs—and in particular, so-called Man in the House, or MITH, rules, which, from 1948–1964, limited aid for parents who were not married and disproportionately affected Black families—can impact children’s well-being and future health, educational, and economic outcomes.
In his first year in the Dissertation Scholars program, Fuller refined his methodology and continued his evaluation of the effects and consequences of MITH rules. His study thus far has largely focused on children’s educational attainment because it “offers preliminary insight into potential changes in other measures of well-being that are often correlated,” he explains. As a second-year Dissertation Scholar, Fuller hopes to extend his primary analysis of the implementation and nullification of MITH rules in income support programs to examine children’s health and economic well-being.
He also plans to continue his professional development, working and learning from Equitable Growth’s network of policy and research experts. “The opportunity to observe, learn, and participate in these research and policy conversations has been invaluable as I prepare the launch the next phase of my career,” Fuller explains. “The conversations have exposed me to interdisciplinary and interindustry crosstalk that is helping me develop exciting new questions and identify questions and topics with which policymakers are currently grappling.”
Costa, who is a Ph.D. student in economics and will begin his stint with Equitable Growth in December, likewise is excited about the various professional development opportunities the Dissertation Scholars program provides. “Knowledge is collectively created, and penicillin and radioactivity were serendipitous discoveries,” he observes. “Thus, being around highly creative researchers can have unpredictable positive effects on my career, the knowledge we commonly produce, and the people whose lives may change with our discoveries.”
Costa’s research examines housing rental markets and policy effects in the United States. He aims to measure landlords’ market power and what drives it, as well as how that power is wielded differently over different tenant demographic groups and in different metropolitan areas to create inequalities along racial, gender, and intersectional lines. Costa’s research develops an innovative model to measure various aspects of competition in rental markets using survey data and a quasi-natural experiment in a New York City housing community. He also evaluates policies that can counteract landlords’ market power, such as rent control and housing subsidies.
Homelessness is an urgent issue, particularly amid the COVID-19 pandemic. Affordable and adequate housing is lacking in many cities and countries worldwide. Costa hopes his research will make a difference in people’s lives and spur equitable economic growth by “fight[ing] inequalities, along with structural and interpersonal discrimination, and promot[ing] individual development, access to education, and macroeconomic stability.”
While much of their time in the program is focused on developing their own research into the relationship between inequality and economic growth, Dissertation Scholars are also required to assist with Equitable Growth’s annual grant review process. Each student will receive a $50,000 stipend and professional support, such as access to Equitable Growth’s network of academics, who may serve as mentors or collaborators on future projects.
“Spending time with Equitable Growth in my last Ph.D. year will allow me to conduct research that is inviable without funding, receive feedback on my work from peers there, engage in the discussion of the Center’s research, and be supported in disseminating my research and making it accessible to scholars and policymakers,” Costa says. “I view Equitable Growth as a center of leading academic debates and cutting-edge research aligned with my academic mission.
”In addition to funding the Dissertation Scholars program, Equitable Growth awards research grants each year to scholars studying the channels through which rising economic inequality affects economic growth and stability in the United States. In August, we announced our 2022 cohort of grantees: 42 faculty and staff, as well as doctoral students, at U.S. universities. In November, we will release our 2023 Request for Proposals. You can learn more about our grants program and click here to review the 2022 Request for Proposals.
In December 2021, the U.S. Bureau of Economic Analysis released a report that studied the feasibility of releasing its distributing personal income product on a quarterly basis. This feasibility study is an important first step toward providing more timely data on the distribution of income growth in the U.S. economy, but the BEA report concluded that existing data sources are insufficient to create quarterly metrics that are valid, informative, and transparent.
Equitable Growth previously argued that the BEA report demonstrated the importance of providing more resources to the agency to meet the needs of policymakers and the public. Current appropriations bills now before the U.S. Congress provide funding specifically to enhance this key prototype data series, which is an important addition to federal statistics.
This Distribution of Personal Income product is unique among all data published by federal statistical agencies in tracking income inequality. This BEA data series provides valuable intelligence for many economic actors, including households, businesses, academic researchers, and economic policymakers, on how economic inequality affects economic growth and stability in the United States. That is precisely why it needs to be published on a quarterly basis.
In this comment, Equitable Growth’s Director of Economic Measurement Policy Austin Clemens argues that the U.S. Bureau of Economic Analysis should investigate whether methods used by other research teams creating distributional national accounts subannually could yield useful early and quarterly estimates of income-based disparities in economic growth.
There is no other data series produced by a federal statistical agency that provides such a comprehensive look at how the U.S. economy is working for all Americans up and down the income ladder. A more timely release schedule will ensure that this valuable resource can be used to inform business decisions, make responsive policy, and plan for the future.
Every month the U.S. Bureau of Labor Statistics releases data on hiring, firing, and other labor market flows from the Job Openings and Labor Turnover Survey, better known as JOLTS. Today, the BLS released the latest data for August 2022. This report doesn’t get as much attention as the monthly Employment Situation Report, but it contains useful information about the state of the U.S. labor market. Below are a few key graphs using data from the report.
The quits rate remained steady at 2.7 percent as 4.2 million workers quit their jobs in August.
The vacancy yield increased to 0.62 in August from 0.56 in July, a notable rise, as the number of reported job openings declined and hires remained relatively constant.
The ratio of unemployed workers to job openings increased in August to almost 0.60 from just under 0.51 in July.
The Beveridge Curve moved sharply downwards in August as reported job openings fell and the unemployment rate ticked up.
The overall number of reported job openings decreased by 1.1 million in August (6.2 percent) to 10.1 million, with openings falling in industries such as education & health services, leisure & hospitality, and manufacturing.