Measuring spending inequality in the United States in real time

The onset of the COVID-19 pandemic and the resulting recession in 2020, followed by a swift U.S. economic recovery, offer lessons today about why real-time data are so crucial to understanding the scale of an economic crisis and determining the appropriate government response. Policymakers would be helped immeasurably by greater access to data that allow them to gauge the efficacy of their policy decisions in real time. Especially crucial are data that show how U.S. households are affected by those decisions.
Yet there is little real-time aggregate consumer spending data or real-time data on spending inequality published by federal statistical agencies, academic economists, or private actors. The main government survey that is used by the U.S. Census Bureau and the U.S. Bureau of Labor Statistics to estimate spending is the Consumer Expenditure Survey, which is released on a significant delay.
Without a real-time measure of spending inequality, academics and policymakers alike are blind to this important measure of economic activity before, during, and after an economic crisis. We created Real-Time Spending Inequality, a new web-based project, to fill this gap, providing timely updates on the status of U.S. consumer spending inequality. Our first data release and report, updated quarterly, covers the first two years of the ongoing pandemic, starting in January 2020 and currently updated through April 2022.
We use data provided by Earnest Research to analyze transaction-level data from credit cards, debit cards, checks, store cards, and bank account transfers from a panel of more than 10 million U.S. households. The ultimate source of the data is an anonymous large personal finance and payments aggregator.
These data include both expenditures and inflows of income into bank accounts. And importantly, the account aggregator data contain information on all accounts, even if the individual U.S. household has accounts at multiple financial institutions. The dataset spans the time period of January 2018 to the present and is updated in near real time.
To study spending inequality, we sort individual U.S. households into quartile cohorts based on their 2019 annual income and then calculate the average amount of spending and spending growth for these different cohorts over time. Our primary measure of spending is year-over-year total spending growth, which compares spending of the cohorts in a week to their spending a year ago in the same week. Looking at year-over-year spending automatically adjusts for seasonality in our data.
In addition to looking at these 1-year-before comparisons, we also chart how consumption has changed compared to the same week in 2019, instead of the year before. These graphs (Figures 3 and 4 in this column) show how spending compares only to 2019, before the pandemic introduced enormous distortions into the economy.
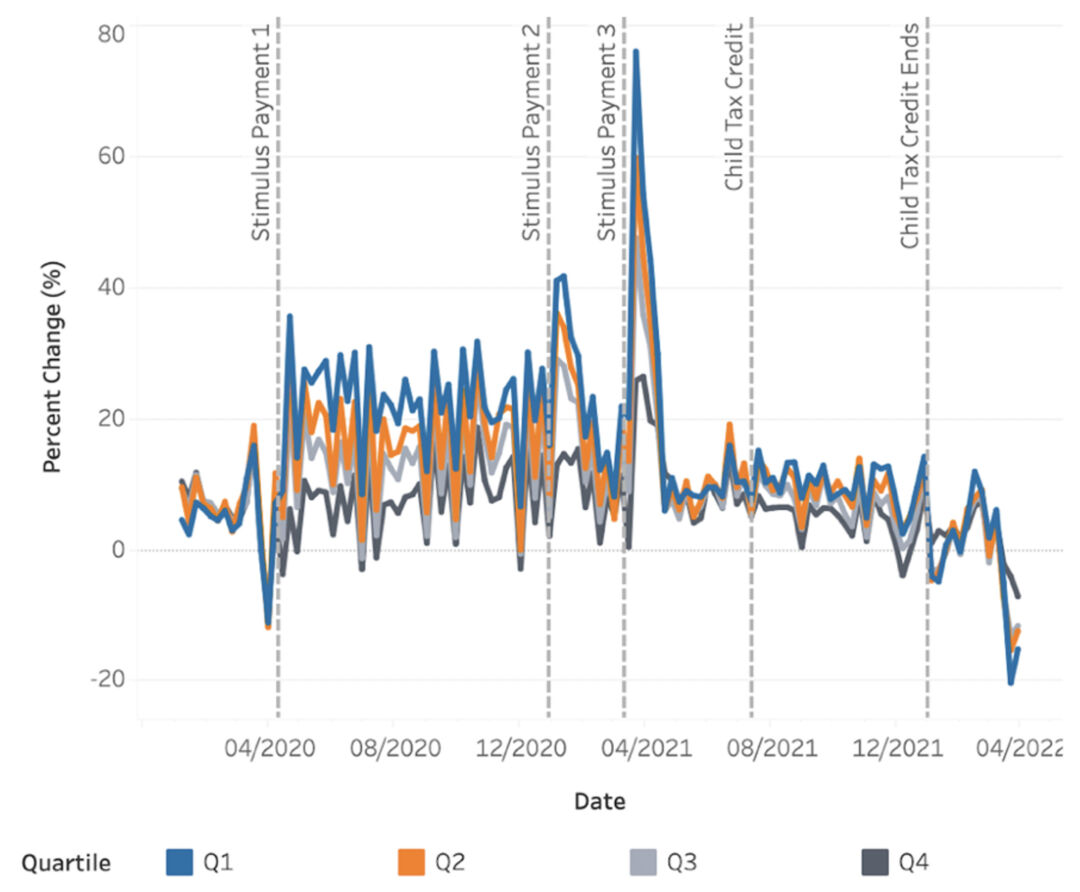
Our first finding is that spending inequality decreased in 2020 and 2021, but is rising in 2022. During calendar year 2020, we find a hierarchy of spending growth: The lowest income quartile, earning between $10,000 and $35,000 annually at the time, shows the highest spending growth, followed by the next three quartiles in succession ($35,000 to $66,000, $66,000 to $115,000, and more than $115,000, respectively).
Average year-on-year spending growth is 16 percent for the bottom 25 percent of income-earning households in 2020, compared to 6.5 percent for the top 25 percent. In 2021, average year-over-2019 spending growth for the bottom quartile was 35.3 percent, compared to 15.3 percent in the top quartile. For 2022, year-over-2019 spending growth was 32.7 percent for the bottom income quartile, compared to 19.7 percent for the top. (See Figure 1 and Figure 3 below.)
Figure 1
Spending by the bottom 25 percent of U.S. households by income increased the most over the course of the COVID-19 pandemic
Growth in spending by U.S. households, by income quartile, compared to the same week in 2019, from January 2020 to March 2022
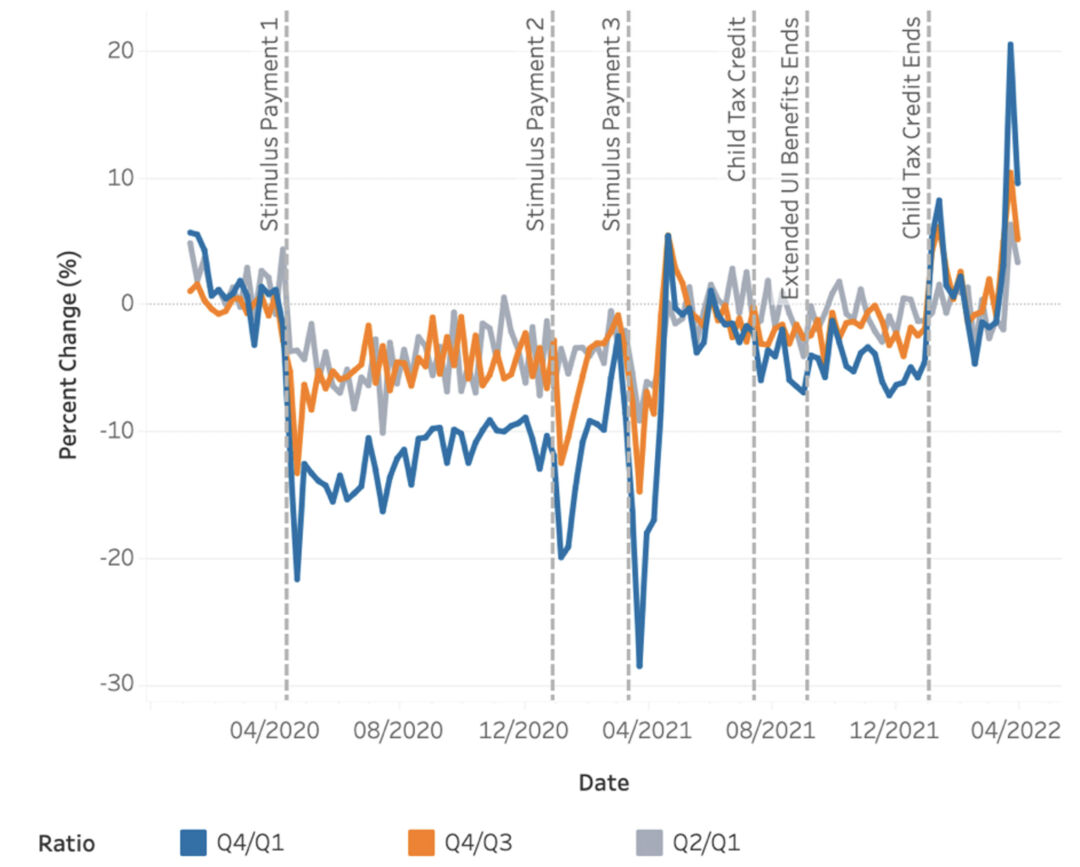
To visualize how the surge in spending by U.S. households in the lowest quartile of income impacted consumption inequality, we also compute the ratios of spending by the high-income cohort to that of the low-income one, and then track the year-on-year growth rate of the ratios. We find there is a marked decrease in total spending inequality during 2020 and 2021, with the ratio of total spending by the highest-income quartile of households to spending by the lowest-income quartile of households declining by as much as 28 percent in 2020.
The year 2021 saw a continued substantial decline in spending inequality, with an average decline in the ratio of spending by the bottom quartile of income-earning households and the top quartile of 14 percent over 2019 levels. Through the first 3 months of 2022, when most of the pandemic-induced government income support programs were ending, there was a moderate rise in spending inequality. The average income-quartile-4-to-income-quartile-1 ratio was 9.2 percent less in 2022 than the same week in 2019, compared with -14 percent in 2021. (See Figure 2 and Figure 4 below.)
Figure 2
The ratio of spending by high-income U.S. households to that of lower-income ones fell significantly amid the COVID-19 pandemic
Ratio of growth in spending by U.S. households, by income quartile, compared to the same week in 2019, from January 2020 to March 2022
Our analysis of this dataset enables us to examine the effectiveness of the stimulus payments that were sent to some U.S. households. We find that the stimulus payments contributed to reducing spending inequality.
Figure 3, which compares spending to the same week in 2019 only, shows that the three government stimulus payments are associated with large spending increases, yet the different groups are not affected equally. There is a hierarchy of spending: The lowest income quartile shows the greatest jumps, followed by the middle income quartiles, and finally the highest income quartile with the smallest increase. For this analysis, we focus on the second and third stimulus payments, in December 2020 and January 2021 and in March 2021, respectively, because the first stimulus payment in April 2020 occurred close to the start of the pandemic. (See Figure 3.)
Figure 3
Federal stimulus payments during the COVID-19 pandemic resulted in a consistent decline in spending inequality, compared to before the pandemic
Growth in spending by U.S. households, by income quartile, compared to the same week in 2019, from January 2020 to March 2022
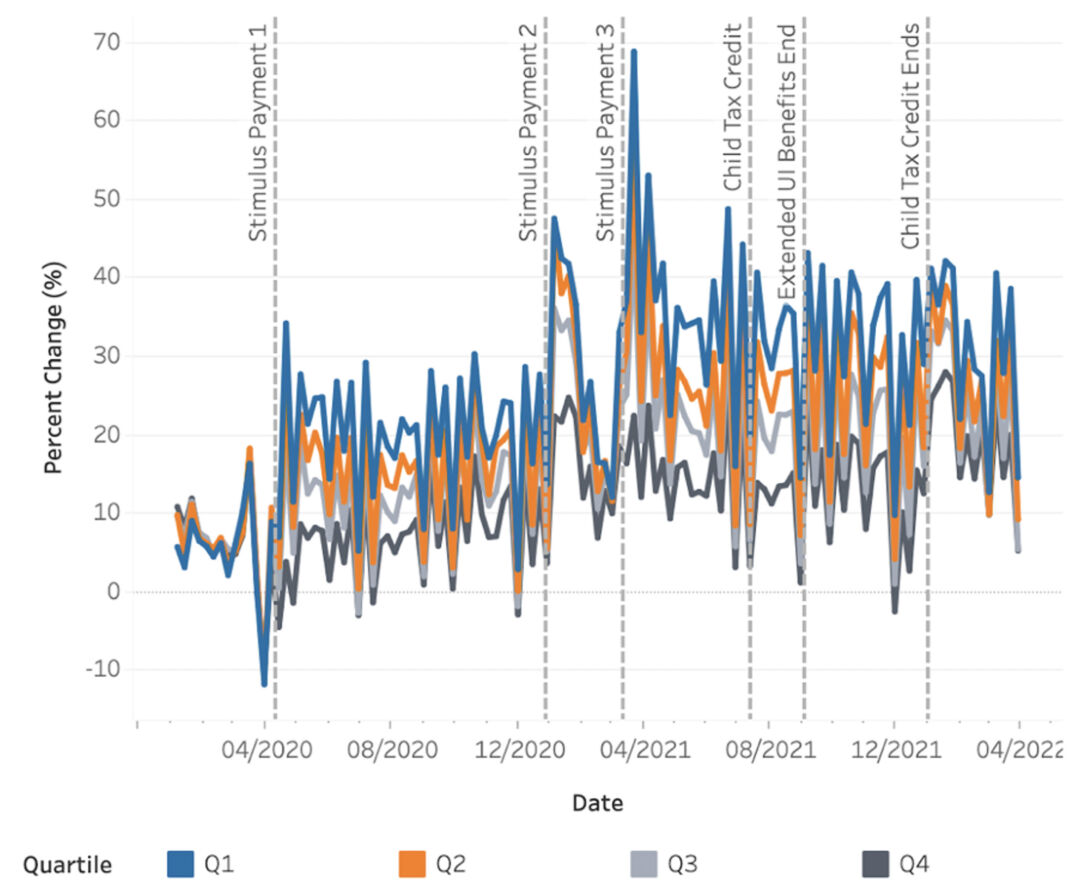
The second stimulus payments were sent out in December 2020 and January 2021, with up to $600 paid out to eligible U.S. households. Around the time of the payment, spending growth by those in the lowest-income quartile increased from 21 percent before the stimulus payments were sent to 42 percent afterward. The highest income quartile experienced more moderate spending growth, from 9.7 percent to 23 percent.
The third stimulus payment of up to $1,400 for eligible U.S. households was sent out in March 2021. Spending growth by the lowest quartile increased by 35.2 percentage points around these payments, compared with 11.7 percentage points by the highest income quartile. (See Figure 4.)
Figure 4
The three federal stimulus payments during the COVID-19 pandemic led to substantial decreases in spending inequality
Ratio of spending growth by high-income households to low-income households, by income quartile, compared to the same week in 2019
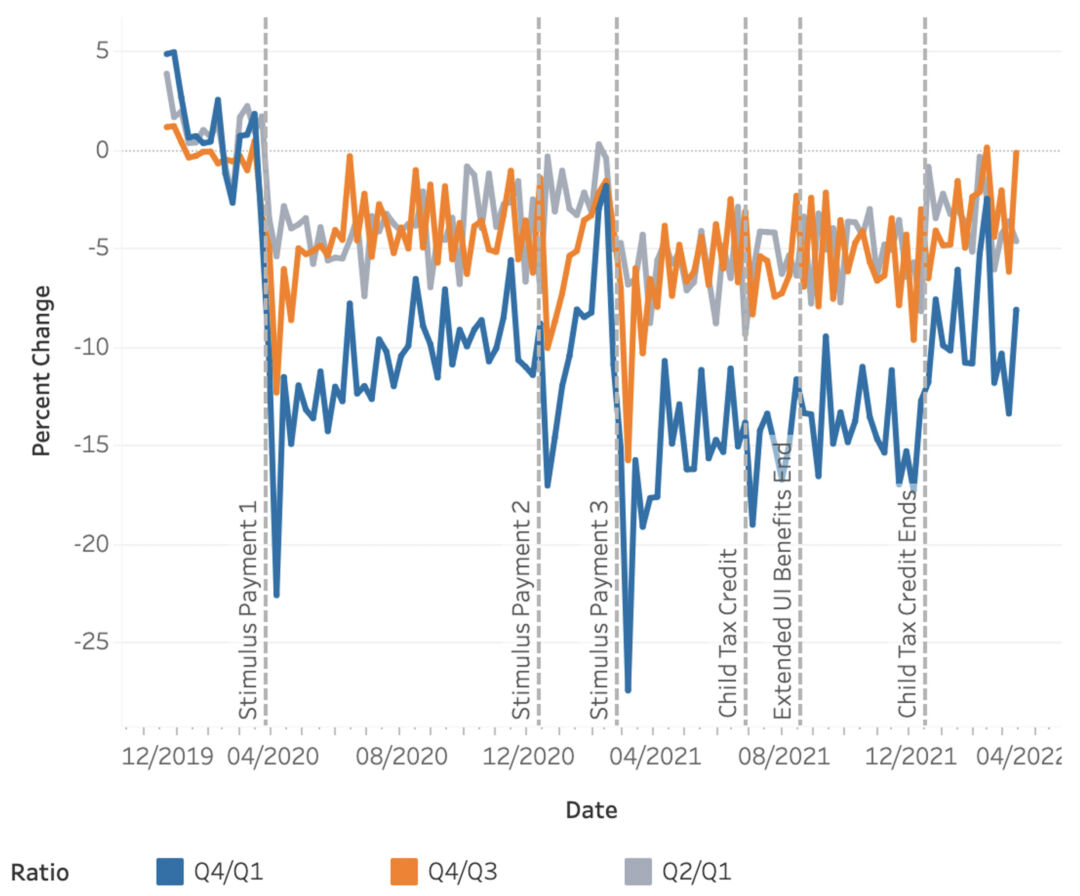
Our analysis of the data in Figure 4 finds that the ratio of spending inequality between the lowest-income quartile of U.S. households and the highest quartile decreased by 4 percent pre- to post-stimulus payment for the second stimulus payment of up to $600. The third stimulus payment of $1,400 was associated with an even more dramatic decline in inequality, with the same ratio decreasing by 25 percent pre- to post-stimulus payment.
Going forward, we will continue to use real-time data at Real-Time Spending Inequality to study how spending inequality evolves as the U.S. economy continues to recover from the pandemic. Our next report will focus on the effects of the federal Child Tax Credit on spending inequality, as well as how inflation is shaping spending patterns across the income distribution.
As the U.S. economy and society enter the third year of the pandemic, fast-moving events continue to point toward the importance of real-time data in understanding the state of the U.S. economy and the impacts of economic policies and critical U.S. social infrastructure. While the federal government has made important steps forward in collecting real-time data, the substantial lags at which consumption inequality data is available should move policymakers to use alternative data sources to study this crucial measure of our well-being.
—Loujaina Abdelwahed is an economist at The Cooper Union. Jacob Robbins is an economist at the University of Illinois-Chicago. Cole Campbell, Shogher Ohannessian, and Todd Czurylo are Ph.D. candidates in economics at UI-Chicago.