The Child Tax Credit has historically provided income support to middle- and high-income taxpayers with children. In 2021, however, the U.S. Congress enacted a temporary enhanced Child Tax Credit with three key changes:
Eligibility was expanded to lower-earning taxpayers because the credit was made fully refundable, and the earnings requirement was dropped.
The maximum amount was raised to $3,000 per child ages 6 to 17 and $3,600 per child younger than 6 years old, from $2,000 per child younger than 17.
Families could receive six monthly payments of between $250 and $300 per child during the second half of 2021, with the remainder paid after filing 2021 taxes in 2022.
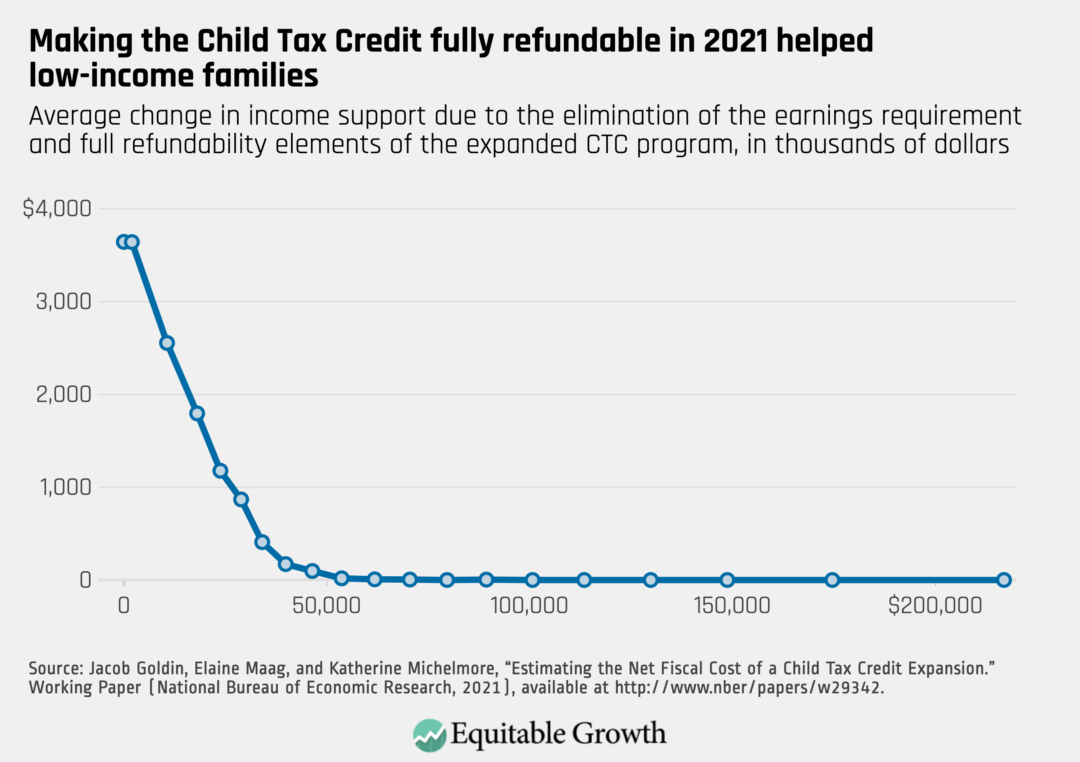
The temporary expansion of the Child Tax Credit increased benefit levels the most for low-income households, as shown below. (See Figure 1.) All of these changes have since expired.
Figure 1
This factsheet summarizes the current research on the effects of the enhanced Child Tax Credit. Early evaluations of its temporary expansion generally find that it increased economic well-being with limited or no detriment to the U.S. labor supply. A well-established body of research suggests that the improved well-being of these children will boost U.S. productivity and growth when they reach adulthood.
Research finds that the 2021 enhanced Child Tax Credit improved the well-being of U.S. children and their families
Recentresearch by economist Zachary Parolin and his co-authors at Columbia University estimates that the CTC expansion reduced child poverty by 40 percent.1
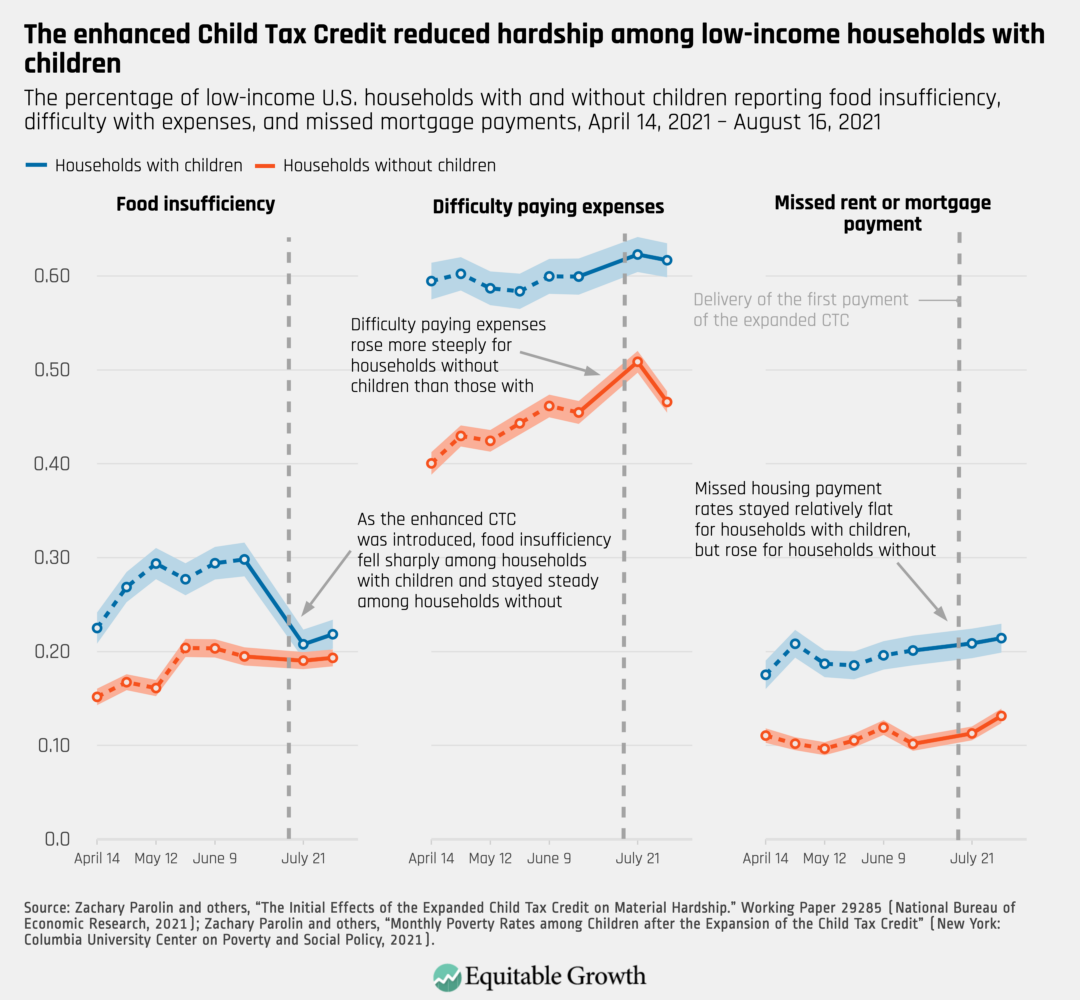
The enhanced Child Tax Credit also supported families with children by reducing food insecurity, lowering reported difficulties affording expenses, and cutting the rate of missing housing payments. (See Figure 2.)
Figure 2
Recent research by Natasha Pilkauskas and her colleagues at the University of Michigan finds that the enhanced Child Tax Credit reduced the number of food hardships by nearly a third for the average low-income family receiving the credit.2
Pilkauskas and her co-authors also find that the expansion significantly reduced the experience of medical hardship among low-income families.3
A large body of literature on financial transfers similar to the Child Tax Credit finds beneficial effects in the areas of health, education, and adulthood earnings.4
Research finds that the 2021 enhanced Child Tax Credit did not affect parental work effort
More research by Parolin and his co-authors compares changes in U.S. labor supply for households with children versus those without, finding no consistent differences in the monthly employment outcomes of these two groups around the time of the CTC expansion.5
More research by Natasha Pilkauskas and her co-authors does not find a statistically significant relationship between employment and the CTC expansion among families in their sample, suggesting that the expansion did not deter work.6
Simulations, which use estimates from existing research to predict the effects of the enhanced Child Tax Credit in the future rather than measuring actual effects from the 2021 expansion, find mixed results that are contingent on their assumptions. Of the three most prominent simulations of a permanent CTC expansion, twosuggest that labor supply effects would be small.7One suggests that they would be substantial.8
The design of the enhanced 2021 Child Tax Credit improved racial and socioeconomic equity in the program
Columbia University researchers find that prior to the temporary expansion, about one-third of children lived in families that earned too little to receive the Child Tax Credit, and that children of color, rural children, and young children are overrepresented in this group.9
The design of the enhanced 2021 Child Tax Credit removed structural barriers, such as earnings requirements, and research suggests that many families with children who had previously been carved out of this income support received it. Specifically:
Early survey evidence reported by Katherine Michelmore and her University of Michigan colleague Pilkauskas suggests that approximately two-thirds of very low-income families received monthly CTC payments.10
Yet research suggests that some barriers remained.
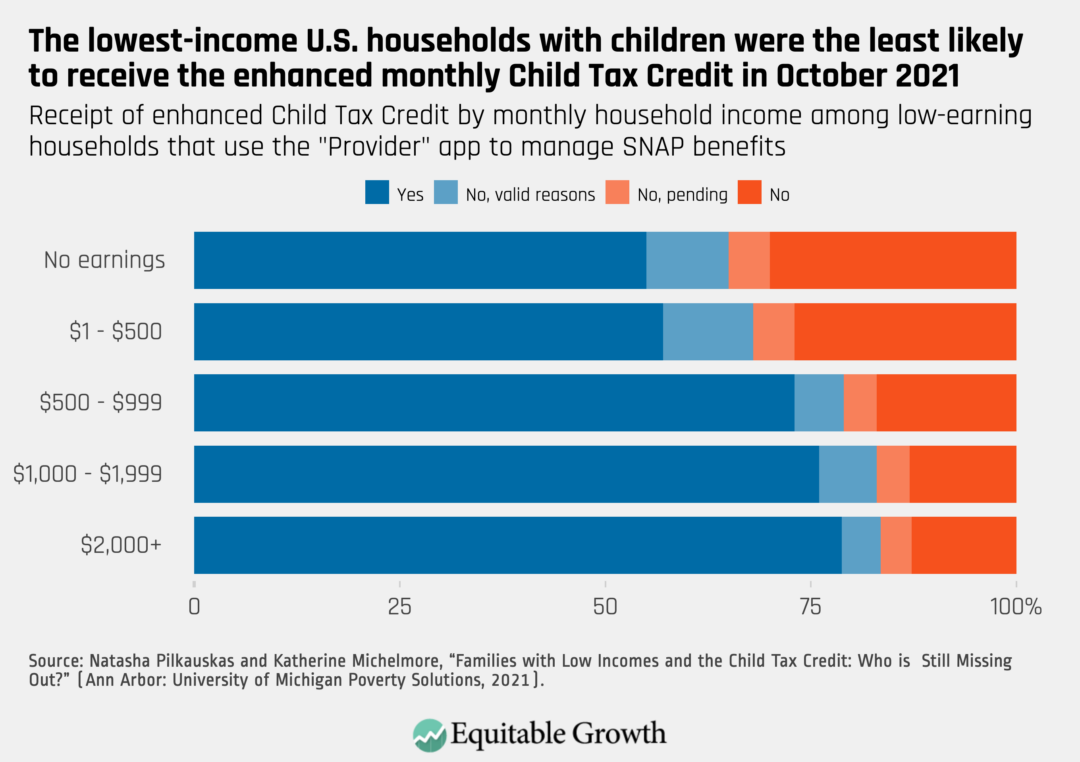
A remaining barrier may be that families who wouldn’t ordinarily file taxes may not have known about their newfound eligibility. Indeed, families with little or no earnings had substantially lower rates of receiving the expanded Child Tax Credit in the first several months of the expansion.13 (See Figure 3.)
Figure 3
Language barriers also may have affected access. Pilkauskas and Michelmore find lower rates of receipt among respondents who took the survey in Spanish, despite high rates of tax filing.14
Policy implications
Research broadly supports a permanent expansion of the Child Tax Credit. There seems to be a consensus that such a policy would improve well-being. The trial expansion of the enhanced Child Tax Credit in 2021 did not seem to cause parents to work less. Most simulations of a permanent expansion of this income support suggest that labor disincentives would be small.
Indeed, the primary argument for not expanding the Child Tax Credit is that it would allow low-income parents to work less, which would work against the program’s goal of reducing child poverty. Yet a large body of evidence on income support for children makes a strong case that these policies tend to improve children’s well-being, as well as their socioeconomic outcomes in adulthood, thus boosting U.S. economic productivity and growth over the long term.
Mounting evidence shows that companies’ decisions in using workplace surveillance and algorithmic decision-making can and do cause immediate and long-term economic and health and safety harms to workers and their families, as well as undermining existing labor and consumer protections and contributing to discriminatory practices and anticompetitive labor markets.
The comment letter discusses key points on the impact of commercial surveillance and algorithmic decision-making on workers and their families, which outline the clear role for the Federal Trade Commission in regulating workplace surveillance and connected practices:
Workplace surveillance is widespread in the United States and among U.S. companies, and the potential use of the data it generates is growing as companies and vendors seek new ways to link data and incorporate algorithmic decision-making in work processes.
Commercial surveillance is all but impossible for most workers to avoid, both due to its ubiquity and because of the erosion of labor protections and the rise of anticompetitive labor practices that reduce workers’ ability to meaningfully consent to surveillance or bargain over these issues.
Evidence also shows that invasive workplace surveillance leads to direct and diffuse harms to workers and undermines other protections or possibilities of fairness. The dangers posed by workplace surveillance fall most heavily on the most vulnerable workers, exacerbating an array of economic inequalities and preventing these workers from challenging invasive practices.
Worker monitoring is part of a cycle of fractured work arrangements through which firms de-skill work and misclassify employees, allowing them to pay workers less, sidestep worker protections, and undermine workers’ bargaining ability, ultimately increasing economic inequality and distorting economic growth.
The known and potential harms to workers from surveillance and related algorithmic management practices are not justified by gains to workers, companies, or the economy, and in fact undermine existing labor protections and contribute to the growing concentration of corporate power in the United States.
In an issue brief earlier this year, Equitable Growth discussed how the Infrastructure Investment and Jobs Act of 2021 rests on sound economic principles and analyzed the ways that its $1.2 trillion in government investments helps address urgent and immediate economic needs. But it’s also crucial to reflect on the ways the law establishes a path for addressing long-term economic and climate needs.
The 1-year anniversary of the Infrastructure Investment and Jobs Act this week is a good time to do so. Why? Because the investments set in motion by the law are beginning to bear fruit. These investments are now setting a path for long-term economic growth while addressing the risks of climate change.
This column examines how the Infrastructure Investment and Jobs Act is helping to build the foundations for addressing persistent trends constricting strong, sustainable, and broadly shared economic growth, while also addressing the consequences of climate change over the long term. Fundamentally, long-term growth cannot exist without addressing the consequences of climate change: Long-term economic growth and runaway climate change are mutually antagonistic.
The Infrastructure Investment and Jobs Act addresses long-term growth
Lagging U.S. economic growth is a problem that has been identified by economists over many decades, though perspectives have varied on the precise causes. One prominent recent explanation, beginning in the 2010s, is “secular stagnation.” This phrase refers to the phenomenon of a chronic excess of savings, relative to investment, in the economy, resulting in downward pressure on real interest rates, low inflation, and weakened demand, leading to slow growth.
There was significant debate about secular stagnation during this time, yet slower growth and weakened aggregate demand, relative to the U.S. economy’s productive capacity, were nevertheless well-documented prior to the start of the COVID-19 pandemic in early 2020 and the resulting recession. There is still an ongoing debate about secular stagnation in light of the strong U.S. economic recovery from the short-but-sharp COVID-19 recession, yet the structural factors contributing to constricted growth have not disappeared.
In short, even if the U.S. economy is not currently facing secular stagnation, the evidence demonstrating that decades-long trends in inequality are a drag on growth is nevertheless well-documented.
There are several ways that economic inequality drags down economic growth. The primary way is through distorting demand and dulling the private sector’s incentives to invest. That is, growing economic inequality destabilizes spending because more consumers either don’t have enough earnings to spend or are taking on too much debt to buy what they need. As a result, businesses are reluctant to invest.
The $1.2 trillion in investments sparked by Infrastructure Investment and Jobs Act address inequality’s effects on growth in two ways. The first, discussed in the issue brief mentioned above, is by prioritizing equitable growth head-on through its emphasis on unionization and racial equity. The second is by addressing diminished public investments head-on—the subject of this column.
Since the 1980s, firms have steadily held onto cash at historically high rates. Some estimates indicate aggregate cash and marketable securities positions of close to $4 trillion for nonfinancial firms, which is almost triple what it was 20 years ago. In what they term the “savings glut of the rich,” economists Atif Mian and Ludwig Straub of Princeton University and Amir Sufi of the University of Chicago Booth School of Business note that the rise in savings by the top 1 percent of the income or wealth distribution since the 1980s has been substantial, but it has not boosted investment.
In fact, Mian, Straub, and Sufi also note the average annual savings by the top 1 percent of the income or wealth distribution have been larger than average annual net domestic investment since 2000. In contrast, savings by the bottom 90 percent of the income or wealth distributions have fallen significantly since the 1980s, driven by an increase in their borrowing and a decline in their accumulation of financial assets.
Indeed, the co-authors find that almost two-thirds of the rise in financial asset accumulation of the top 1 percent of the wealth distribution since the 1980s has been due to a rise in the accumulation of claims on U.S. government and household debt by the most exceedingly wealthy. Investment has been correspondingly lagging.
Direct public investments are also at historical lows. Federal investments today stand at roughly 1.5 percent of Gross Domestic Product, their lowest level since 1947. The decline in investments at the state and local levels has been less dramatic but still significant. Spending by state and local governments on all types of capital dropped from its high of 3 percent of GDP in the late 1960s to less than 2 percent now.
The $1.2 trillion in investments provided by the Infrastructure Investment and Jobs Act enable the kind of large-scale projects necessary to untether constricted economic growth that has resulted from persistent public-sector disinvestment. What’s more, public investments of this significant size can pave the way for private-sector innovation and growth. This is especially the case for the investments enacted by the law for innovation and technology, such as the Public Transportation Innovation program, which includes construction technologies such as 3D modeling and digital project management platforms that can innovate supply chains and reduce environmental waste.
In the past, of course, many of the biggest advances in U.S. economic productivity, innovation, and technological capacity have been the result of government action. Consider, for example, the internet, which was originally a project funded by the U.S. Department of Defense. Likewise, NASA maintains a catalogue of thousands of technologies that became commercial products. The Apollo Space program helped accelerate innovation and create technologies that have widespread use and application today, such as the integrated circuit, which is the basis for computer chips today.
In her book, The Entrepreneurial State: Debunking Public vs. Private Sector Myths, University College London economist Mariana Mazzucato highlights the role of government investment at the heart of major technological breakthroughs, noting that Apple Inc. and other successful private companies owe much of their value to government-supported research and development. Nearly all the technologies in the iPhone, for example—including GPS navigation, voice recognition, and touchscreen capabilities—were developed through government investments, while Alphabet Inc.’s Google search engine algorithm was funded by the National Science Foundation.
There is certainly room for increasing these types of public investments. Funding for the National Institutes of Health and National Science Foundation, for example, is well below previous highs. In a recent working paper, Pierre Azoulay of the Massachusetts Institute of Technology and his co-authors find that increased funding for the National Institutes of Health would spur the development of private-sector patents. Specifically, they find that a $10 million increase in funding for an area would lead to 2.3 additional patents. Put another away, the co-authors estimate one private-sector patent would be generated for every two to three NIH grants.
Infrastructure investments such as the ones made in the Infrastructure Investment and Jobs Act are especially complementary to private-sector economic activity. One recent meta-analysis examined the rate of return on infrastructure investments, finding that each $100 spent on infrastructure boosts private-sector output by a median of $13, and $17 on average in the long run.
Infrastructure investments also have large multiplier effects—that is, a proportionally higher increase in Gross Domestic Product for every dollar increase in investment—especially when compared to other fiscal interventions, such as tax cuts. Research by Sylvain Leduc and Daniel Wilson at the Federal Reserve Bank of San Francisco suggests investments in transportation infrastructure have particularly large multiplier effects and can be as high 3 to 7 times after 6 to 8 years.
Moreover, the latest projections by the Congressional Budget Office suggest that the Infrastructure Investment and Jobs Act will have positive effects on GDP and productivity over the next decade. These CBO projections are telling because of the CBO’s high degree of uncertainty and undue pessimism about the U.S. economy’s capacity in recent years.
The Infrastructure Investment and Jobs Act addresses the consequences of climate change
The Infrastructure Investment and Jobs Act also provides a path for long-term, sustainable growth by making key investments in environmental and energy infrastructure. By doing so, the legislation helps to mitigate climate change over the long term, especially when coupled with the recently enacted Inflation Reduction Act of 2022.
One example of the how these two laws complement each other with climate investments is in the transportation sector, which accounts for 27 percent of greenhouse gas emissions. The Inflation Reduction Act establishes a tax credit of $7,500 for new electric vehicles and $4,000 for used ones, and allows for the tax credits to be transferred to auto dealers at the point of sale. This accelerated deployment of electric vehicles can reduce emissions as much as 280 million metric tons by 2030, or about 28 percent of the total emissions cut by the Inflation Reduction Act during that time period, according to some projections.
The Inflation Reduction Act also provides $2 billion in grants to incentivize domestic manufacturing. Correspondingly, the Infrastructure Investment and Jobs Act provides $7.5 billion to build out EV charging infrastructure, thereby making more accessible the charging of these electric vehicles. Incentives for coordinated technology deployment such as these are doubly effective because they both eliminate wasted investments in incompatible technologies and accelerate adoption of new technologies.
To be sure, the precise impact of these investments is contingent on the ways state and local governments implement them. An analysis by the Georgetown Climate Center estimates the impact of the $600 billion that the Infrastructure Investment and Jobs Act provided for surface transportation investments. The analysis finds that these investments boast the potential to cut emissions by 1.6 percent below their projected baseline emissions within just 5 years, which is about the equivalent of emissions from 4.5 million passenger vehicles. But the analysis also estimates this scenario based on policymakers prioritizing low-carbon strategies, such as the electrification of transit and school buses, within the portfolio of transportation investments.
If policymakers instead prioritize high-carbon strategies, such as highway expansions, then greenhouse emissions may trend upward overtime. And there are already examples of state and local governments implementing low-carbon strategies, such as Colorado incorporating funding into the state’s greenhouse gas emissions reduction plan.
The estimated hundreds of thousands of green jobs created by both the Infrastructure Investment and Jobs Act and the Inflation Reduction Act are crucial for creating more equitable economic growth. In a recent paper, E. Mark Curtis of Wake Forest University and Ioana Marinescu of the University of Pennsylvania develop a measure of green jobs—specifically, occupations in the solar and wind energy fields—and find these jobs benefit workers. Specifically, they find that green jobs tend to be in occupations that are about 21 percent higher paying than the average in other industries—including fossil-fuel extraction—with the pay premium being even greater for green jobs with low educational requirements. They also find that green jobs in general have the same educational requirements as other jobs, with about 40 percent requiring only a high school degree.
Ultimately, long-term economic growth is impossible without addressing the consequences of climate change. One recent study by economists Gregory Casey and Matthew Gibson at Williams College and Stephie Fried at Arizona State University’s W.P. Carey School of Business finds that existing models used in the research that evaluates the economic costs of climate change may be underestimating the damages. Instead, their model suggests climate change disproportionately affects investment goods, or goods used in the production chain, and thus have longer-term ill effects on economic growth and productivity.
The Infrastructure Investment and Jobs Act is helping to set in motion some of the investments necessary to combat climate change over the long term. But more legislative action is needed to complement these investments. This will require comprehensive climate action and reevaluating assumptions about what makes the U.S. economy grow.
The Washington Center for Equitable Growth recently announced our 2023 Request for Proposals to support research investigating the various channels through which economic inequality, in all its forms, may or may not impact economic growth and stability. One particular area of interest is monetary policy. Indeed, in recent years, policymakers and economists alike have been interested in the distributional effects of monetary policy, especially in the aftermath of policies implemented after the 2008 global financial crisis.
More recently, in light of the current state of inflation, the economic recovery from the COVID-19 recession, and the Federal Reserve’s response, there has been renewed interest in how monetary policy—both expansionary and contractionary—can affect economic inequality and growth. New research examines how monetary policy can affect inequality across different types of workers and firms. As part of Equitable Growth’s Working Paper series, Martina Jasova of Barnard College and her co-authors provide novel evidence on the heterogeneous effects of monetary policy on workers’ labor market outcomes and how effects on firms via the credit channel affect their wages.
Using a unique granular administrative dataset that matches linked employee-employer data and firm loan-level credit registry in Portugal, Jasova and her co-authors find that expansionary monetary policy disproportionately improves the labor market outcomes for workers at smaller and younger firms. The first benefit of expansionary monetary policy for workers at smaller and younger firms is wages. The co-authors find that following a 1 percentage point decrease in the monetary policy rate, workers in small firms experience a 1.16 percentage point increase in wages, compared to workers in large firms. In the same monetary policy scenario, workers in young firms experience a 0.4 percentage point increase in wages, compared to old firms.
The co-authors also find a 1 percentage point decrease in the monetary policy rate reduces the wage gap between small and large firms by approximately 5 percent, and between young and old firms by about 4.4 percent. This is probably because expansionary monetary policy relaxes financial constraints that hit growing firms harder and therefore enables firms to increase the wages of their workers whose wages were previously back-loaded—that is, wages that were lower at the beginning stages of a job in exchange for higher wages at a later stage.
The second benefit of expansionary monetary policy is employment. A 1 percentage point decrease in the monetary policy rate is associated with a 1.73 percentage point increase in employment in small firms, compared to large firms, and a 2.16 percentage point larger increase in employment in young firms, compared to old firms. Taken together, the authors conclude that expansionary monetary policy improves labor market outcomes more in small and young firms and hence reduces inequality between firms in the economy.
Yet the distributional effects of monetary policy on labor market outcomes are not consistent for all types of workers. Namely, the co-authors show that high-skilled workers—defined in the working paper as workers with at least a college degree—benefit the most both in terms of wages and hours worked. A 1 percentage point decrease in the monetary policy rate is associated with a 1.14 percentage point increase in wages and 2.7 percentage point increase in hours worked for high-skilled workers, relative to the outcomes of low-skilled workers.
Furthermore, Jasova and her co-authors find that these skills-premium effects are concentrated in smaller, younger firms. As high-skilled and high-wage workers tend to be already employed by large and high-wage firms, expansionary monetary policy is associated with a labor reallocation of the skilled workforce toward smaller firms. The co-authors argue, consistent with the capital-skill complementarity mechanism, that expansionary monetary policy disproportionately enables financially constrained firms to increase both capital investment and employment of skilled workers. These results are consistent with the typical macroeconomic explanation for monetary policy driving faster economic growth, but this research provides novel details that map that macro story onto different firms and workers.
To be sure, expansionary monetary policy is associated with economically and statistically significant wage effects in small and young firms only if they have previous bank-borrowing relationships. In contrast, the effects are null for workers in firms that do not have any bank borrowing in the previous periods. The research therefore illuminates the importance of the credit channel for the distributional effects of monetary policy through the labor market. That is, while smaller and younger firms can benefit the most from the increased access to credit during times of expansionary monetary policy, insofar as it can help alleviate financial constraints, this only matters if the firm has an existing bank-borrowing relationship.
Other economists also have highlighted the ways in which expansionary monetary policies may reduce inequality. For example, a paper by University of Texas at Austin economist Olivier Coibion and his co-authors finds that expansionary monetary policies by the Federal Reserve reduce income and consumption inequality across U.S. households, while contractionary monetary policy shocks increase U.S. income and consumption inequality. The contrasting effects are primarily due to the differences in the composition of incomes and household balance sheets across the U.S. income distribution. Contrary to claims that expansionary policy in the form of low interest rates drove up inequality through asset prices, this work shows the opposite.
In Confronting Inequality: How Societies Can Choose Inclusive Growth, economists Jonathan D. Ostry, Prakash Loungani, and Andrew Berg also find that expansionary periods of monetary policy are associated with reduced income inequality across the globe, with the labor share of income rising and the shares of income going to the top 10 percent, 5 percent, and 1 percent all falling. They conclude that there is evidence that unanticipated, or exogenous, monetary policy easing lowers income inequality.
Monetary policy may have distributional effects on wealth, too, although these effects are less understood. Research by Michele Lenza and Jiri Slacalek at the European Central Bank find that with expansionary monetary policy, high-wealth households tend to benefit from higher stock prices, while middle-wealth households benefit from higher house prices. There are household balance sheet effects, but many low-income households have too little (positive or negative) wealth to be affected through this channel.
Nevertheless, more research is needed to make definite conclusions about the distributional effects of monetary policy, especially during bouts of inflation. We are in the middle of an historic contractionary monetary policy, and research will be needed to understand how today’s policy affected inequality.
There also are other important questions to investigate in order to provide a comprehensive picture of the relationship between monetary policy, inequality, and growth. How do financial market responses to changes in monetary policy affect wealth inequality? How do the costs of inflation vary across household characteristics, such as age, income, or race? How do a household’s asset and debt positions affect its experience of inflation? Equitable Growth seeks to support researchers answering these questions and more.
The recently proposed $24.6 billion takeover of the nation’s fourth-largest supermarket chain, Albertsons Companies Inc., by the second-largest chain, Kroger Co., poses an array of serious and apparent antitrust concerns for federal and state antitrust enforcers. There are myriad reasons why state and federal antitrust enforcers could either block the merger or require the two firms to divest some of their grocery stores. The combined firms could raise prices on consumers in an already-inflationary environment and close overlapping stores, leading to employee layoffs, creating “food deserts,” and putting downward pressures on wages and job standards in local labor markets.
But one more immediate aspect of the proposed acquisition is particularly disconcerting—Albertsons’ proposed $4 billion “pre-closing dividend” to its shareholders—because it may well test the boundaries of competition enforcement laws in the United States, particularly the premerger review process. This pre-closing dividend is a novel way in which the shareholders of Albertsons—particularly private equity firms Cerberus Capital Management L.P. and Apollo Global Management Inc., which collectively, with several other private equity firms, hold a majority stake in Albertsons—are seeking to pull money out of the supermarket chain by borrowing more than $1 billion of that $4 billion and raiding the firm’s cash reserves before presumably converting the remainder of their equity to cash when the proposed merger closes.
The use of dividends to enrich private equity shareholders is not new, but the timing of this dividend and its connection with the merger raises novel competition issues. Had the payout of the pre-closing dividend not been blocked by the courts, it would have already been disbursed, long before competition authorities had a chance to decide whether to allow the merger.
The purpose of premerger review is to allow antitrust authorities to block mergers that threaten competition to preserve the status quo. By paying out a crippling dividend before the antitrust authorities have a chance to weigh in on this merger, Albertsons and Kroger would all but guarantee that the status quo would be irrevocably altered, even if the antitrust authorities block the merger.
The threat is not, as some have suggested, that the dividend would open Albertsons to a so-called failing firm defense, which would force authorities to approve the merger. Indeed, the parties appear to have disclaimed any such defense. The threat instead is that the issuance of a pre-closing dividend, no matter whether the authorities approve the merger, would neutralize Albertsons as a competitor.
The proposed pre-closing dividend is being challenged and has been temporarily blocked by a Washington state court. A federal court in Washington, DC, however, declined to do the same. The merger will be the subject of a hearing of the Senate Judiciary Subcommittee on Competition Policy, Antitrust, and Consumer Rights later this month.
State and federal antitrust enforcers have already signaled they will consider the broader anticompetitive consequences of the takeover for consumers in regional retail supermarket sectors where the two companies’ grocery store chains and brands overlap. But if the Washington state court does not continue its injunction, then the pre-closing dividend itself will likely get paid out to Albertsons’ shareholders before the merger is scrutinized by competition regulators or elected officials.
But first, these investors want that special $4 billion pre-closing dividend. Washington state Attorney General Bob Ferguson went directly at this aspect of the proposed merger in his motion before the state court to block the payout. Ferguson asked the court to stay the pre-closing dividend payout until he and other state attorneys general address the anticompetitive concerns with the larger merger. Kroger and Albertsons “have disputed the interrelation between” the merger agreement and the payment of the dividend, and a federal court in Washington, DC last week found the dividend is independent of the merger, even though Albertsons’ own press release announcing the merger described the dividend as “part of the transaction.”
The Washington state court temporarily blocked the payment of the pre-closing dividend on November 3, and late last week, the court extended that temporary injunction until it holds a hearing on November 17. In so ordering, the court noted that once Albertsons distributes the dividend to shareholders, “Albertsons will be in a weakened competitive position relative to Kroger.” By hobbling Albertsons’ ability to compete before authorities have had a chance to review the merger, Albertsons and Kroger will have made antitrust authorities “unable to carry out [their] statutory duty to protect commerce and consumers.”
Whether Washington Attorney General Ferguson prevails in that hearing presents a challenge for him, for all antitrust enforcers, and for the state and federal courts that will eventually hear the broader case against the proposed merger, should it go forward. The reason: Adjudication of pre-closing dividends in antitrust law is thin. Nevertheless, a recent securities law decision on the significance of dividends sheds some light on how courts should treat the use of dividends to thwart effective review of transactions.
A 2022 case before the Delaware Supreme Court (called “novel” by one law firm because of its decision on pre-closing dividends) involved a merger in which compensation to shareholders of the nonsurviving company was paid primarily through a large ($9 billion) dividend, followed by a nominal (31 cents per share) closing payment. By structuring the payment in this way, the companies hoped to “eviscerate[]” the shareholders’ appraisal rights—the rights of company shareholders to demand a judicial proceeding or independent valuation of a firm’s shares with the goal of determining a fair value of the stock price—by limiting their application to the 31-cent closing payment.
The court, in GPP Inc. Stockholders Litigation, ruled, though, that while the dividend was legal, the amount of the dividend must be considered part of the purchase price and is subject to appraisal rights. Notably, the merging parties in GPP, similar to Albertsons and Kroger, had maintained that the dividend and the merger were entirely separate transactions—although it should also be noted that in GPP, the dividend was conditional on the merger, whereas the Albertson-Kroger dividend is not. Delaware is the corporate home of the bulk of large U.S. companies and its Court of Chancery and Supreme Court rulings on corporate matters carry weight around the nation.
Appraisal rights are not at issue in the Albertsons-Kroger merger—or at least not yet. Nevertheless, the Delaware court’s approach to premerger interest payments suggests that where parties attempt to use dividend payments to avoid scrutiny of their merger, courts will look through the form of those payments to preserve the right to merger review. There is no reason this principle would not apply as much, if not more so, to agency antitrust review as to shareholder valuation review. There also is no reason why this principle should not apply to other aspects of financial and transactional engineering common in private equity transactions.
A signature feature of private-equity-controlled companies is heavy debt loads because private equity firms borrow on the back of corporate assets and cash flow to pay themselves regular dividends. Albertsons is no different and finds itself heavily in debt, yet it’s tapping the leveraged loan market for a portion of the pre-closing dividend. The cash part of the dividend is, in effect, a pre-down payment on Kroger’s merger offer, although under the terms of the pre-closing dividend, the cash portion comes from Albertsons’ cash position.
Private equity funds sapping companies of their ability to compete by loading them with debt and looting their assets is nothing new; indeed, it is unfortunately commonplace. And, while problematic in many ways, such practices are typically not an antitrust violation. What makes this maneuver by Kroger and Albertsons novel, and what makes it an apparent violation of the antitrust laws, is that the decision to hobble Albertsons as a competitor through a massive, debt-funded dividend was the result of an agreement between Albertsons and one of its direct competitors. If this is borne out by the facts, then it would be a novel form of gun-jumping.
Kroger and Albertsons claim the two transactions are independent. In support, they cite that the payment of the dividend is not conditioned on the consummation of the merger. This is true, as far as it goes, but it does not go far enough. The merger and the associated agreement between Kroger and Albertsons could still have enabled the dividend, even without express conditioning. The key to understanding why is the $600 million reverse breakup fee included in the larger merger agreement.
If the merger is approved, the agreement to pay this dividend will not matter much—Kroger will pay for it as part of its purchase price, Albertsons will no longer be a competitor, and the companies will become a legal unity, unable to conspire. If the merger is blocked, however, Albertsons will be on the hook for the dividend and the money it borrowed to pay for it, making it that much harder for Albertsons to compete with Kroger and other supermarkets.
Albertsons’ board surely knew this merger would be closely scrutinized, so why would it agree to this dividend, in which the company might be left holding the bag? Because Kroger will pay for at least part of the dividend either way, thanks to the $600 million reverse breakup fee included in the merger agreement.
In this way, this type of pre-merger dividend can be analogized to a pay-for-delay agreement from the pharmaceutical context, which the U.S. Supreme Court held is illegal in its 2012 ruling in Federal Trade Commission v. Actavis Inc. Instead of a branded pharmaceutical company paying a generic company to delay its entry in the market, as in the Activis case, here, the question is whether Kroger is paying Albertsons—by means of the $600 million reverse breakup fee—to shoot its prospects as a competitor in the metaphorical foot. One way or another, then, Kroger will be buying Albertsons’ competitive silence. And either way, competition and consumers will lose.
Whether the merger agreement and the associated breakup fee were part of the Alberstons’ board’s calculus in approving the dividend is a factual question, but it is one that cannot be answered just by looking at whether the pre-closing dividend is expressly conditioned on consummation of the merger. Instead, what matters is whether the board members considered the interplay between the two transactions and whether they would have made the dividend payment even if Kroger were not footing some or all of the bill. The two transactions were voted on in the same board meeting, and hopefully, this week’s evidentiary hearing in Washington state will help illuminate what went on behind those closed doors.
Regardless of the outcome in this transaction, both the courts and Congress should weigh in on pre-closing dividends before this practice becomes another way for private equity firms and their wealthy investors to use this new twist on financial engineering to undermine merger reviews and harm U.S. consumers, workers, and their families, and overall U.S. economic competitiveness in other industries in which private equity firms are major corporate players.
Research shows that accessible and affordable child care is both a lifeline for working families and a driver of growth across the entire U.S. economy. A functioning child care market has the potential to grow the economy through several distinct channels: assisting parents who choose to pursue work, helping children grow and develop their human capital, and providing high-quality jobs for caretakers.
These mechanisms of growth have been discussed by scholars for decades, but further research would help policymakers establish and fine-tune a functioning child care system in the United States that maximizes the potential for economic growth. With that in mind, Equitable Growth recently convened more than 30 economists, social scientists, policymakers, and advocates to discuss research questions and needs that could further shed light on the important role that child care plays in propping up the overall economy, as well as policy strategies that could help shore up the U.S. child care industry.
This meeting was part of Equitable Growth’s Child Care Research Accelerator initiative, which furthers our commitment to advancing research and evidence that supports broad-based and sustainable economic growth. In addition to serving as an important discussion forum, the convening uncovered new opportunities for research, which has helped to inform the funding strategy for Equitable Growth’s 2023 Request for Proposals.
This column summarizes some of the research questions and themes discussed at this convening, and then outlines Equitable Growth’s research priorities around child care and early education going into our 2023 grantmaking cycle.
The gaps in research on child care and U.S. economic growth
Researchers at Equitable Growth’s recent child care convening raised several different areas where further research on child care and early education would be valuable. These research questions focus on the foundational relationship between early care and education and the economy, sectors of the child care market that have been underinvestigated in prior research, and new research opportunities offered by policy change. Below, we look at these topics in more detail.
Updating estimates of the labor market impacts of child care price changes
One underling theme of recent research on the potential impact of increasing public investments in child care on economic activity are estimates of parents’ elasticity to employment to child care prices. In other words, how much more or less will parents work if child care prices increase or decrease?
In her review of the literature, Taryn Morrissey of American University reports that a 10 percent reduction in child care prices increases parental employment approximately 0.5 percent to 2.5 percent, indicating an elasticity of 0.05–0.25. Importantly, Morrissey notes, these estimates are smaller when using more recent data and data from international sources, suggesting that parents’ elasticity to employment is neither static nor homogenous.
A theme that emerged at the convening was that precise and current elasticity estimates are crucial to ensuring that policymakers have an accurate understanding of the economic impact of various early care and early education proposals. Economic models that rely on inaccurate or outdated elastic estimates have the potential to dramatically underestimate or overestimate changes in labor force participation resulting from child care investments.
Updating these price elasticity estimates should be a priority among researchers studying child care and early education in the U.S. economy. In addition, as parents tend to make employment decisions based on their preferences for child care type, quality, and geographic location, among other factors, as well as pure prices, future research also should aim to shed light on how these other factors impact employment decisions in relation to price elasticity.
Exploring the practices and experiences of home-based, underground, or less-identifiable care arrangements
A functioning child care market is one that offers a diverse range of care options to best meet the range of needs that arises in a given community. Research on families’ child care decisions reinforces the importance of care received outside of traditional child care centers. Yet researchers and policymakers alike have directed more of their focus toward these larger centers, while less is known about the size and economic impact of the home- and family-care markets.
Convening participants suggested this is largely an issue of identifiability and data access, rather than a failure to recognize the importance of noncenter providers. Many home- and family-based providers exist outside of the formal child care market, and public data on these provider types are limited. Future child care research should work to fill some of these gaps in the data on nontraditional child care options.
Several participants also advocated for research on U.S. military child care options. The U.S. military operates and funds a large and dispersed child care market for military families. While these facilities have generally been considered high quality, long waitlists have prompted recent efforts to expand the military’s child care infrastructure and community-based options. This unique child care market may be ripe for future research on government-provided child care.
Evaluating how the U.S. child care market responds to economic and policy change
Similar to nearly all sectors of the U.S. economy, child care does not exist in a vacuum immune from economic and policy change. Indeed, prior research from Chris M. Herbst at Arizona State University and Jessica H. Brown at the University of South Carolina describes child care’s asymmetrical exposure to macroeconomic trends. In other words, they find that in economic downturns, employment in the child care sector declines slightly faster than employment across the broader U.S. labor force, while child care job growth is significantly slower than other sectors in periods of recovery.
Further research from Brown also explores the possibility of unintended consequences in the child care market from early care and education policy changes. Due to necessary staff-student ratios, caring for infants and toddlers is more costly to providers than caring for preschool-age children, so older children’s care—bringing in tuition dollars while costing providers less—is often a vital source of profits keeping providers’ doors open. Brown finds that pre-Kindergarten expansion without accompanying public investment in infant and toddler care can negatively impact the child care market’s fragile economic stability by transferring this source of profit away from child care and toward early education.
Research has helped shed light on child care’s relationship with macroeconomic and policy trends, but further examination is needed to help policymakers understand how the child care market may respond to shifting economic conditions and investment options. Some potential research questions include:
How is child care responding to interest rate increases and tightening or loosening labor market conditions?
Do minimum wage increases meaningfully impact child care labor supply and the price of care?
How will changes in the size of child care subsidies and access to child care spill over to nonsubsidized populations?
To what degree does public investment stabilize the child care market from macroeconomic shocks?
New funding models and program types stemming from the American Rescue Plan may offer researchers important state-level policy variation for studying these and other policy-relevant questions.
Investigating child care’s role in children’s human capital development relative to early education
A growing body of literature suggests early education programs, such as Head Start and universal pre-K, have the potential to meaningfully support young children’s human capital development, leading to short-term academic advantages and long-term socioeconomic benefits. Convening participants were largely confident this research shows early education’s effects on human capital, even if the literature has yet to firmly define the “secret ingredients” that lead to these outcomes.
The plausible mechanisms for early education’s boon for long-term human capital development—including the formation of self-regulation and attention skills and the opportunities to develop and test social skills—may also be present in some child care settings. Practitioners and advocates have suggested that the distinction between child care and early education may not be as rigid as early childhood policy often suggests.
Researchers should further investigate the potential mechanisms for long-term human capital development in child care settings and if or how they differ based on provider type and care practices. Such research may assist practitioners and policymakers in supporting a holistic early care and education system that maximizes positive socioeconomic outcomes in the long term.
Equitable Growth’s 2023 child care and early education funding priorities
Equitable Growth uses conversations such as those had at our recent child care convening and at our 2020 research roundtable of child care scholars to identify new research questions and priorities for our 2023 grantmaking cycle. This year, Equitable Growth is prioritizing research questions and projects that probe child care’s symbiotic relationship with the broader economy in which we all work and live.
Examples of research topics that are in line with this year’s funding priorities are:
Updating estimates on parents’ elasticity to employment to child care prices, as well as evidence on the mediating effects of child care quality, accessibility, and program type on employment
Building evidence on child care and early education’s role as a barrier or facilitator to macroeconomic growth and stability, including how access to early care and education accelerates or moderates the ebbs and flows of the business cycle
Investigating child care and early education’s impact on firm-related outcomes, including workers’ productivity, absenteeism, presenteeism, and employer-employee matching
Determining child care’s role, relative to early education programs, in children’s human capital development and the long-term productivity impact of that development, and redefining short term indicators for human capital development to extend beyond test scores and education-related outcomes alone
Clarifying the effects of local economic conditions, including the housing and labor markets and minimum wage laws, on the child care labor force and the accessibility and cost of care
Examining the use of policy variation stemming from the American Rescue Plan or state-level policy changes, such as subsidy expansions, workforce development initiatives, or other programs, to shed light on the questions above
This list is illustrative rather than comprehensive—Equitable Growth will consider all research projects that build evidence on child care’s role in the U.S. economy, including those not listed. (Note, however, that in prior years, Equitable Growth has invested in mixed-methods projects that study the experiences and practices of home-based providers, and as a result, we are not prioritizing similar projects or research questions in 2023.)
Equitable Growth’s recent convening of scholars and policy experts fostered a range of discussions on important research questions, ideas, and opportunities on child care’s role in establishing broad-based and sustainable economic growth. This convening, in turn, shaped what the Washington Center Equitable Growth seeks to fund through our 2023 grantmaking cycle—in particular, academic research projects that can answer these and other policy-relevant questions that will inform early care and education policy.
Child care researchers interested in applying for funding support—or learning more about Equitable Growth’s other funding priorities—are encouraged to review the 2023 Request for Proposals for more information. Scholars can also contact grants@equitablegrowth.org to learn more.
The recently enacted Inflation Reduction Act boasts the potential for more noncitizen immigrant workers and entrepreneurs to pay into the U.S. tax system, improving the federal government’s tax collection. What’s more, the way the IRS can go about bringing these workers and entrepreneurs into the U.S. tax system would facilitate the better delivery of targeted, anti-poverty benefits to already-eligible households to boost U.S. economic growth and productivity.
But there’s a catch. Some of the $80 billion in new funding for the IRS in the new law, which is expected to improve tax collection by auditing high-income earners, needs to be deployed toward enabling noncitizen workers and entrepreneurs to fulfill their lawful taxpayer obligations. Specifically, the U.S. Congress’ allocations can serve immigrants if the IRS prioritizes the administration of Individual Tax Identification Numbers, or ITINs—a nine-digit number that allows certain noncitizens to comply with their taxpaying obligations.
These ITINs not only allow entrepreneurs and workers to contribute billions of dollars to public coffers but also will facilitate targeted tax credits to economically vulnerable households and children, thus advancing more immigrant-inclusive policies through U.S. tax system, including for the citizen children of immigrants. But this will require the IRS to use some of its expanded funding from the Inflation Reduction Act to help noncitizen workers and entrepreneurs file their lawful federal taxes.
In short, by decreasing the barriers to the use of ITINs in tax filings, the IRS can advance economic prosperity for and by immigrants and in the U.S. economy more broadly.
In this column, I briefly examine how the budget reconciliation process that led to the enactment of the Inflation Reduction Act initially included proposed new pathways to lawful permanent residency and citizenship for undocumented immigrant workers that were ultimately considered inappropriate to be included in the budget reconciliation process. I then explore in detail the recent history of ITINs and noncitizen immigrant taxpayers to show how some of the $80 billion in new funding for the IRS can boost federal tax revenue substantially. I then examine how ITINs can improve long-term U.S. economic growth and productivity by channeling key tax credits, particularly to families with citizen children—boosting the human capital of the nation’s future generations of workers.
For this to happen, the IRS should provide new funding to make ITINs more accessible to noncitizen immigrants.
The Inflation Reduction Act’s initial immigration proposals
During the congressional debate over provisions to be included in the Inflation Reduction Act, immigration advocates tried and failed to use the reconciliation process to improve access to immigrant visas, green cards, and permanent residency, as well as provide temporary protection from deportation for long-time residents with work authorizations. These provisions could have contributed to strong, stable, and broadly shared economic growth by bringing more noncitizen immigrant workers and entrepreneurs into the federal tax system in the United States.
These provisions ultimately didn’t pass because they were deemed inappropriate for the budget reconciliation process, which typically only includes provisions that will affect the federal government’s bottom line. Yet the Inflation Reduction Act still offers an exciting opportunity for the IRS to use its resources to efficiently provide immigrants with ITINs.
But first, a brief primer on the history of ITINs.
The history of ITINs and immigrants
U.S. citizens accustomed to filing their own taxes with Social Security Numbers may be unaware of their noncitizen peers’ taxpaying experiences. Federal income tax obligations stem from residency, based on one’s length of stay, regardless of immigration status. As such, the IRS created the ITIN in 1996 so that noncitizens who may be ineligible for Social Security Numbers can comply with their tax obligations.
According to IRS estimates, millions of returns are filed by primary taxpayers with ITINs, reflecting billions of dollars of revenue added to federal coffers, even after accounting for the tax credits that many immigrant families use to reduce their federal tax liabilities. Unlike Social Security Numbers, ITINs may expire due to nonuse—if a migrant leaves the United States for a number of years, during which they have nonresident status and no legal obligation to file, they must apply for a new ITIN. In recent years, the IRS has received millions of applications for new ITINs.
The delays and difficulties faced by ITIN applicants have, for decades, attracted the scrutiny of the U.S. Department of the Treasury’s Office of the Taxpayer Advocate, located within the IRS and led by the National Taxpayer Advocate. In 2003, for example, the National Taxpayer Advocate’s annual report to Congress highlighted the increasing demand for ITINs among immigrants in the United States, including for the purposes of demonstrating good moral character. Indeed, tax compliance, which may require an ITIN for those without Social Security Numbers, helps immigrants seeking pathways to lawful permanent residency and U.S. citizenship.
Yet despite attempts by migrants to comply with tax laws, securing and using ITINs raises challenges on many fronts. These include requiring ITIN applicants to file tax returns along with the ITIN application, as well as the IRS lacking sufficient staff to expeditiously process these ITIN applications and tax returns. Accordingly, the National Taxpayer Advocate wrote in its 2003 report that the “difficulty in obtaining assistance and the processing delays involved in receiving ITINs place a significant burden on individuals who are attempting to participate in the tax system and comply with the law.”
Two decades later, the onslaught of COVID-19 pandemic further exacerbated the problems for immigrants seeking ITINs, with the National Taxpayer Advocate raising alarms anew and recommending reforms. These paper-processing delays already affected a broad universe of paper filers, but new ITIN applicants found pandemic-induced delays uniquely unavoidable. That’s because noncitizens are unable to e-file when seeking an ITIN number assignment and instead must attach their ITIN application to a paper tax return. Accordingly, the National Taxpayer Advocate encouraged the IRS to be more accommodating of ITIN applicants.
Better access to ITINs facilitates easier voluntary tax compliance, contributing to the billions of dollars of ITIN-filer tax collections. More specifically, the revenue benefits come not only from noncitizen taxpayers employed by U.S. firms but also from noncitizens who may be employers themselves. Despite prohibitions on employing undocumented immigrants, undocumented employers can and do hire documented workers. The use of ITINs can boost fiscal contributions from undocumented immigrant entrepreneurs and their workers.
The U.S. Congress in 1996 also barred ITIN-holding immigrants from receiving certain public benefits by requiring Social Security Numbers to access those benefits. More recently, because of Congress’ definition of a “valid identification number,” the initial rounds of direct pandemic relief payments in 2020 from the IRS penalized even Social Security Number-carrying people because they either were married to noncitizens or were the children of noncitizen parents—even when those same adults had ITINs and perfect tax compliance. Aggrieved U.S. citizens filed lawsuits claiming that their ineligibility for the IRS payments based on their personal relationships violated their constitutional rights, and in subsequent rounds of relief, Congress narrowed some, but not all, exclusions.
This brings us to the taxpayer benefits and refundable tax credits facilitated by ITINs, including the refundable federal Child Tax Credit, as well as potential state benefits. The U.S. Congress has long allowed ITIN-holding noncitizen parents to claim the Child Tax Credit for children who are U.S. citizens. And even as ITIN-holders are excluded from the federal Earned Income Tax Credit, many states may allow ITIN holders to claim parallel state-level Earned Income Tax Credits, including in my home state of California.
As such, an ITIN is not only in itself a taxpayer service, but also a conduit for other social infrastructure services and benefits. By facilitating targeted tax credits back to vulnerable households and children, ITINs expand the reach of these economic relief programs, thereby advancing the goals of federal and state legislators to create more equitable and stronger economic growth in the future.
How the Inflation Reduction Act can broaden access to ITINs
While the more-explicit immigration provisions in the Inflation Reduction Act may have failed, prioritizing immigrant access to ITINs is something for which the IRS has both the power and financial resources. The IRS, for example, could work toward allowing for the electronic processing of ITIN applications, even without a completed tax return. And a group of organizations working with immigrant taxpayers recently recommended that the IRS improve its Certified Acceptance Agents network, which provides in-person verification of identity documents.
Beyond expanding the number of CAAs, the IRS should also consider how to locate them in places that are accessible for immigrant taxpayers. (To that end, the IRS currently has a moratorium on new CAA applications until 2023 as it pursues modernization and efficiency updates.) If the electronic processing of ITINs is enabled, it will allow immigrants’ economic contributions to enrich the public fisc because of currently uncollected tax revenue flowing into the IRS and improve the lives of the vulnerable households and children that inspired legislators to design various anti-poverty tax credits in the first place.
In sum, the IRS’s new funding can strengthen ITIN administration. The IRS can and should use its resources to efficiently provide immigrants with ITINs, which would provide greater federal tax revenue and facilitate targeted, anti-poverty benefits to already-eligible households. In expanding ITIN access, the IRS would support U.S. economic growth and productivity now and in the future, including for the U.S. citizen children of noncitizen immigrant taxpayers who would benefit today from greater investments in their future human capital.
Earlier this year, the U.S. Congress passed and President Joe Biden signed into law one of the most consequential climate bills in U.S. history. The Inflation Reduction Act allocates $369 billion to clean energy and electric vehicle tax breaks, domestic manufacturing of batteries and solar panels, and pollution-reduction efforts.
In addition to mitigating the effects of climate change and driving consumption of renewable energy, these investments will add jobs in the clean energy sector—some estimates say as many as 912,000 per year over the next decade. As employment in the fossil fuel industry dwindles amid changes in U.S. energy markets, new research suggests that the growth in renewable energy benefits U.S. workers and is particularly good for workers who live in areas with high rates of employment in fossil-fuel extraction industries.
The paper, co-authored by E. Mark Curtis of Wake Forest University and Ioana Marinescu of the University of Pennsylvania, develops a measure of green jobs—specifically, occupations in the solar and wind energy fields. Using data from Burning Glass Technologies, a labor market analytics firm, on job postings in the United States, the authors find that green jobs saw incredibly strong growth in recent years—a trend that they find is, overall, quite beneficial for workers.
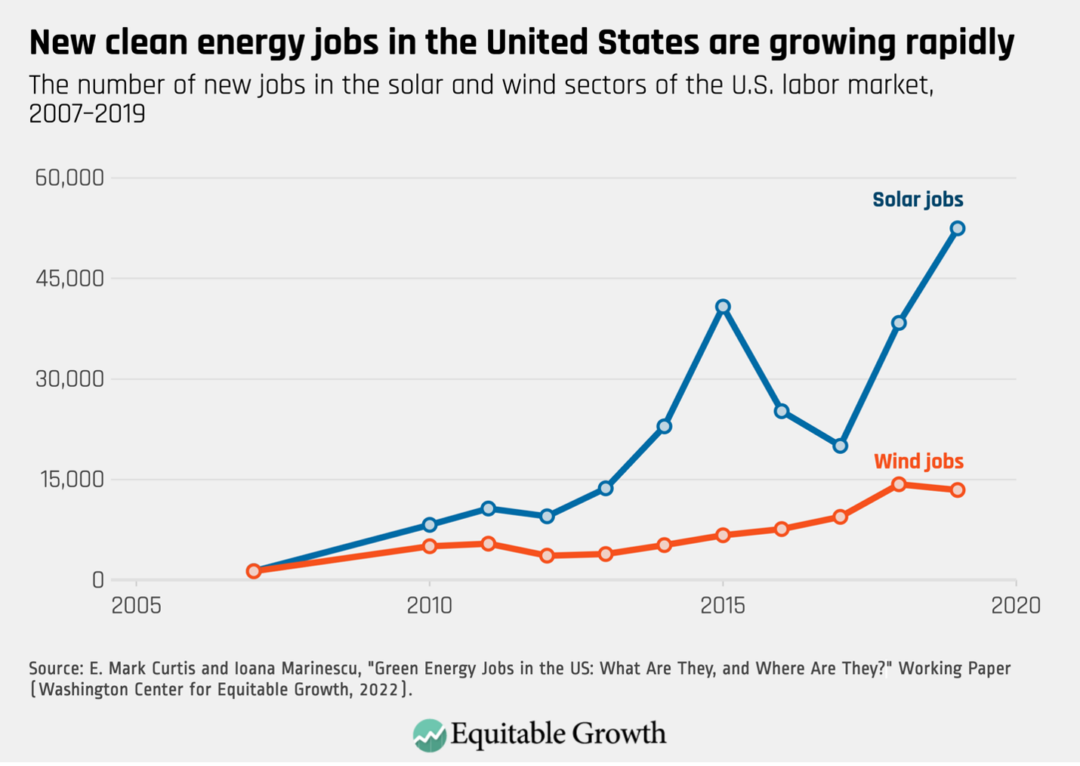
Indeed, jobs in the solar energy industry increased approximately five-fold since 2013, with more than 52,000 postings in 2019 alone. That same year, there were about 13,500 wind job openings—triple the number before 2013. By way of comparison, the number of new fossil-fuel jobs in 2019 was around 44,000. (See Figure 1.)
Figure 1
To be sure, these findings are based on job postings for open positions and do not necessarily reflect filled positions or work actually being done. Nevertheless, this trajectory closely follows the growth in solar and wind electricity production in the United States in the same time period, thougH interestingly wind electricity makes up a larger share of energy production than solar—despite there being more solar jobs than wind jobs. The authors posit that this discrepancy may be a result of different technologies in the two sectors, including the larger number of workers needed in the solar industry than the wind industry to produce the same amount of electricity.
Curtis and Marinescu also find that green jobs tend to be in occupations that are about 21 percent higher-paying than the average in other industries—including fossil-fuel extraction—with the pay premium being even greater for green jobs with low educational requirements. They also find that green jobs in general have the same educational requirements as other jobs, with about 40 percent requiring only a high school degree.
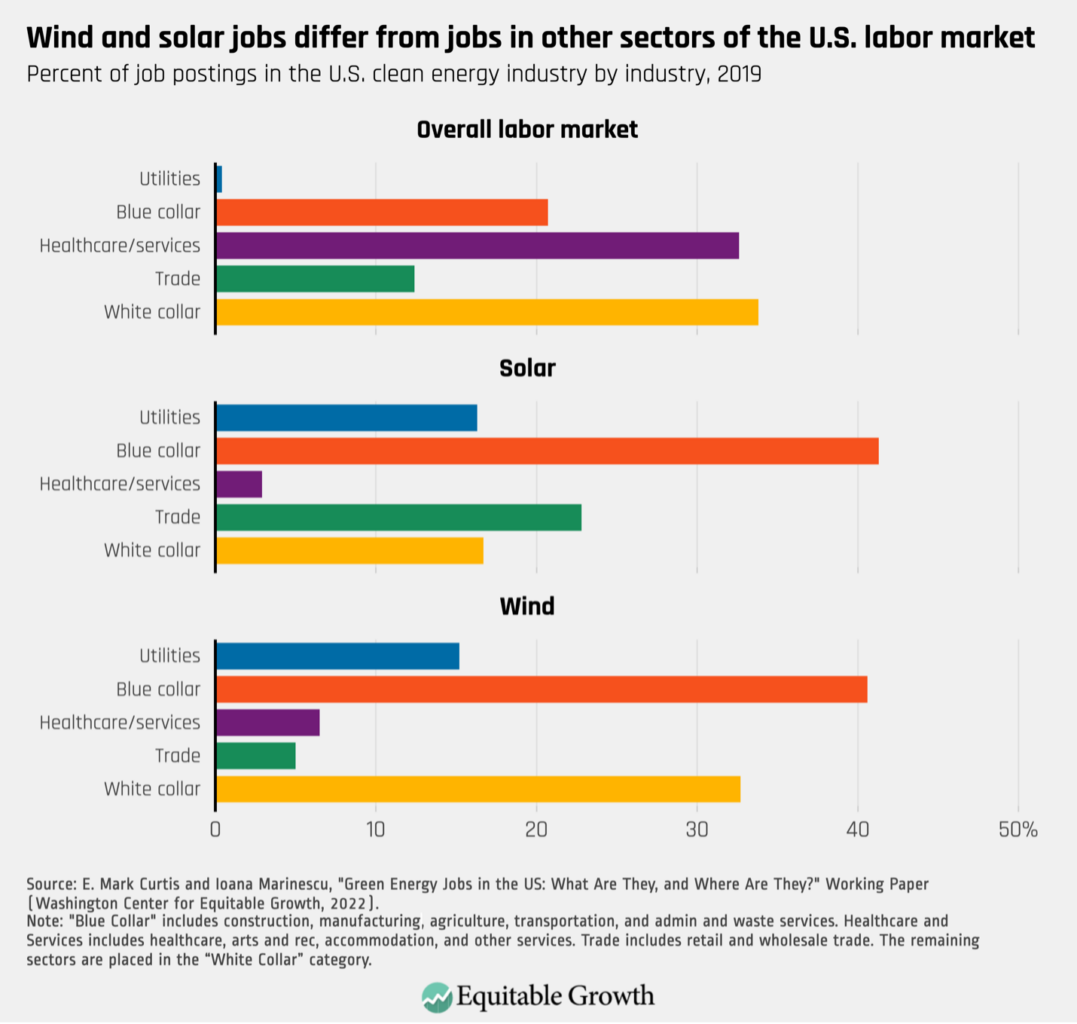
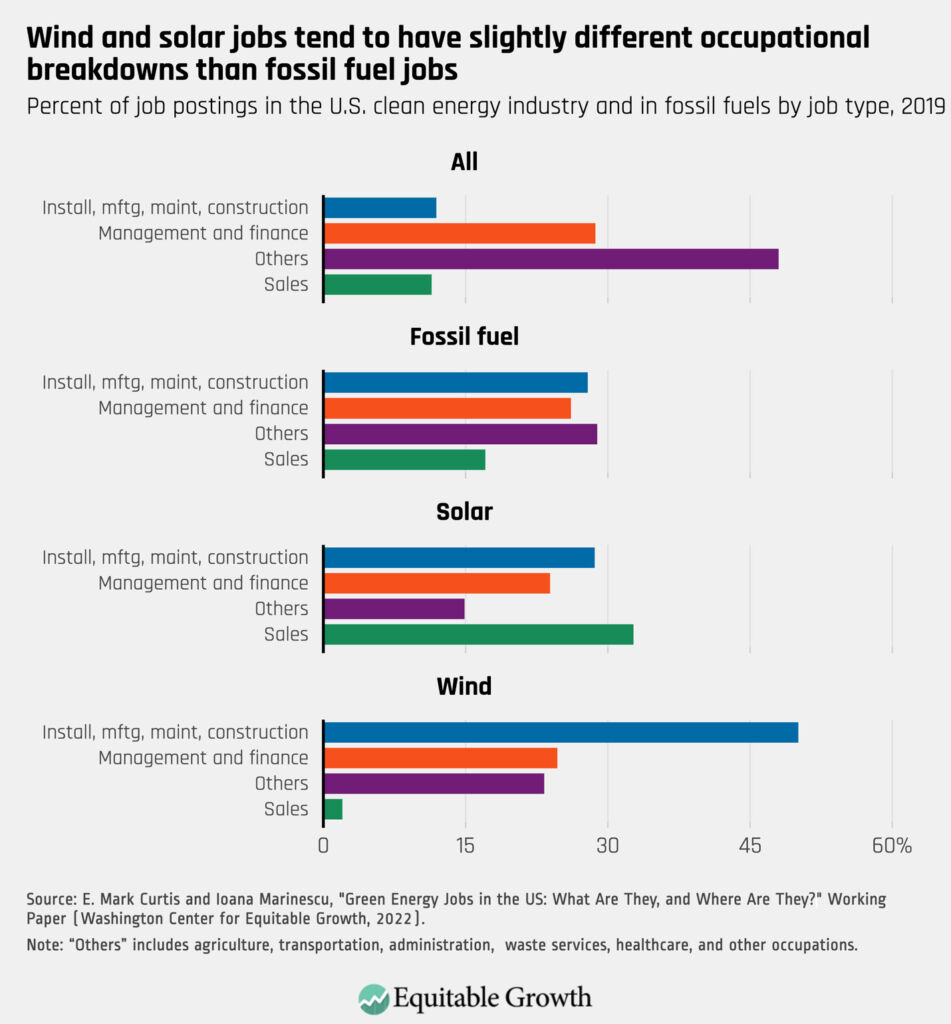
About one-third of solar jobs are in sales occupations, while about 37 percent of wind jobs entail installation, manufacturing, maintenance, and construction. Around a quarter of all jobs in both wind and solar are in management and finance occupations, while close to 30 percent of fossil fuel jobs are listed as “other,” which includes anything from agriculture, waste services, transportation, administration, and other services. (See Figures 2 and 3.)
Figure 2
Figure 3
In general, in terms of occupational classification, green jobs are more similar to fossil-fuel jobs than to all other jobs in the U.S. labor market—yet, as the authors find, green jobs tend to be specifically in occupations that pay more. This suggests that the coming renewable energy boom will create high-paying job opportunities for many U.S. workers, and especially for low-skilled workers.
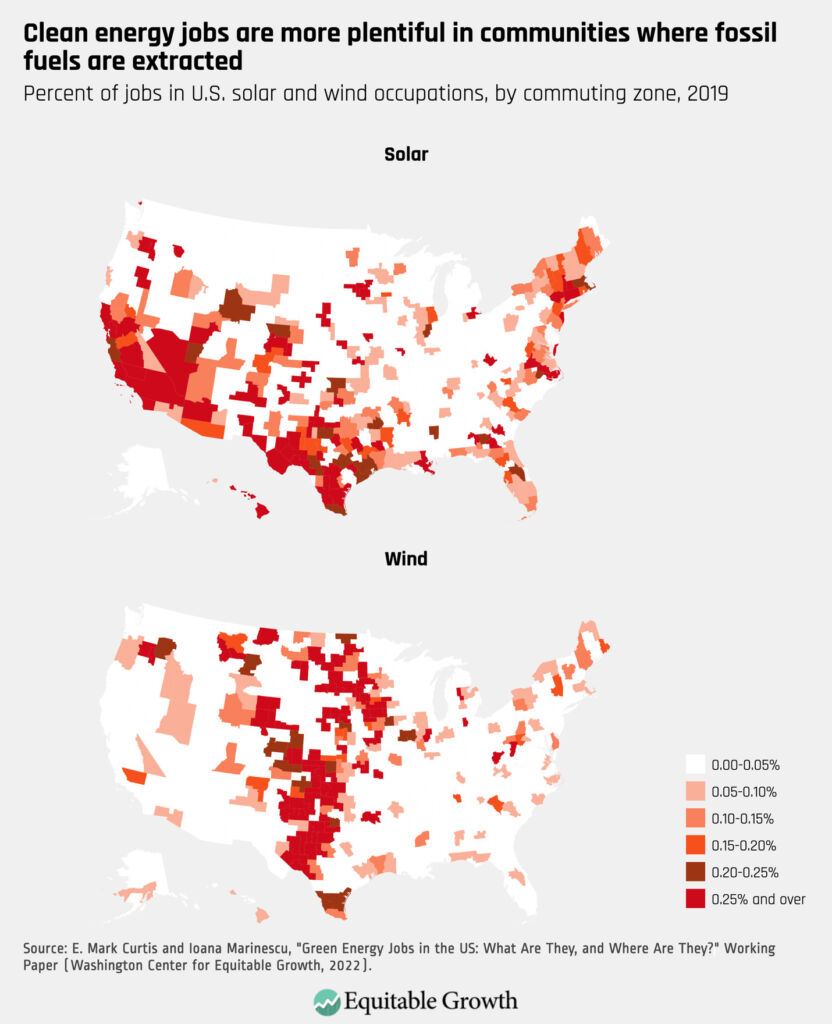
Curtis and Marinescu also find that green jobs, while unevenly distributed across the country, tend to be located in communities with a high share of employment in the oil and gas industry, such as Texas and across the Midwest. They propose that this correlation could be due to geographic conditions that favor both renewables and fossil fuels—for instance, they write, more wind in the mountains where coal is extracted. (See Figure 4.)
Figure 4
The co-authors also find that solar jobs tend to be located in commuting zones with higher non-White populations, while the opposite is true for wind jobs. They hypothesize this could have to do with where solar and wind jobs are mostly located and the demographic makeups of these areas. In other words, as Figure 4 displays, many solar jobs are in the southern half of the United States, from California through Florida, where there is a bigger non-White population, whereas wind jobs are largely in the Midwest, where fewer non-White people tend to live.
The fact that green jobs and fossil-fuel jobs tend to be located in the same areas, along with the occupational similarities and job requirements in the two industries, suggest that many job losses in oil and gas that result from a renewable energy boom may be offset by an influx of clean energy jobs. The transition from a carbon-intensive economy to a green economy therefore may be smoother than previously predicted.
Indeed, this study presents a new angle to the debate over the move to a low-carbon economy. While most previous work has focused on jobs and wages lost from moving away from fossil fuels, Curtis and Marinescu instead highlight the benefits of this new, cleaner economy. It is likely that these results, as well as those from similar research on green jobs, will be helpful in guiding policymakers as they work to allocate funding from the Inflation Reduction Act and spur a renewable energy labor boom.
In most cities and states across the United States, servers and other so-called front-of-house staff in the restaurant industry earn a subminimum wage for tipped workers. Whether and how this long-established and historically racist and gender discriminatory two-tiered compensation system harms these restaurant workers to the benefit of restaurant firms is the subject of increased debate across the country. The reason: there are ballot initiatives this month to enact fixed minimum wages for tipped workers in Washington, DC and Portland, Maine, and the idea is highly debated in other cities and states across the nation.
So, what do the economic data tell policymakers—and the general public weighing the merits of these ballot initiatives—about the impact of the subminimum tipped wage on servers in the restaurant industry and about the efficacy of enacting a standard minimum wage for these workers? There are a number of research papers that examine the practice of tipping in worker outcomes, as well as the broader impact of a subminimum wage for tipped workers on the U.S. labor market. As cities and states across the country navigate debates on subminimum wages and whether to abolish their existence in favor of one fair wage, this column elevates the scholarly research to help inform this debate.
But first, it’s important to provide some context and some history about the tipped subminimum wage. The subminimum wage for tipped workers at the federal level stands at $2.13 per hour—far below the federal minimal wage of $7.25 per hour—but varies by state and city across the country. In some locations, the subminimum wage is higher than the federal level of $2.13 but still below the federal minimum of $7.25. In West Virginia, for example, the subminimum wage is $2.63, 50 cents more than the federal subminimum. And in seven states, as well as the territory of Guam, there is no subminimum wage for tipped workers, meaning all workers in these states earn the statutory minimum even in industries where tipping is common, including in the large state economy of California.
While there was movement in the early 1900s to end the practice of tipping, business opposition to banning tipping in favor of a fixed wage resulted in tipped occupations being excluded from the introduction of the federal statutory minimum wage in the Fair Labor Standards Act of 1938. Even though federal law today stipulates that workers need to be paid the difference between the subminimum and the minimum wage if a worker’s tips are insufficient to match the difference, workers in many states and cities rarely receive this additional payment from their employers. As a result, de facto wage theft is rampant in the restaurant industry to this day.
So, what does the economic research tell us today about the consequences of the subminimum tipped wage for servers in the restaurant industry? Do reforms to the tipped minimum wage increase the wages of these workers overall? Or do reforms actually lead to decreased earnings for servers, as is believed by many in the restaurant industry? And does raising the tipped minimum wage have any discernible impact on employment outcomes for servers overall in the restaurant industry?
The economics research on the impact of the subminimum wage on these workers is somewhat ambiguous, finding some or no improvement in wages and unclear impacts for employment levels. But against the backdrop of low earnings for many workers in food and beverage serving occupations, efforts to stabilize wages by abolishing the subminimum wage for tipped workers may reduce the likelihood of wage theft and ensure that marginalized groups are not further disadvantaged. Additionally, abolishing the subminimum wage can reduce earnings volatility, which can have subsequent impacts on workers and their families.
Let’s now briefly examine some of this research.
Economists Sylvia Allegretto and Carl Nadler at the University of California, Berkeley find in their 2015 report, “Tipped Wage Effects on Earnings and Employment in Full-Service Restaurants,” that a 10 percent increase in wages for tipped workers in full-service restaurants increases earnings by 0.4 percent, with no discernible impact on employment levels. In contrast, economists William E. Evan at Miami University in Ohio and David A. MacPherson at Trinity University find in their 2013 paper, “The Effect of the Tipped Minimum Wage on Employees in the U.S. Restaurant Industry,” that earnings do go up, but employment goes down.
The ambiguity of these findings between marginally higher earnings but possible downside effects on employment levels could be troublesome for policymakers, but the earnings stability for these workers found by both pairs of researchers is certainly a worthwhile economic policy objective. What’s more, those restaurant workers most in need of earnings stability—young, low-income workers with families to care for—are particularly vulnerable to the clear downsides of subminimum tipped wages. Sociologists Michelle Maroto at the University of Alberta and David Pettinicchio at the University of Toronto find in their 2022 paper, “Worth Less? Exploring the Effects of the Subminimum Wage on Poverty Among U.S. Hourly Workers,” that subminimum wages were associated with increases in family poverty by 1.4 percentage points.
Maroto and Pettinicchio, however, do find that in some instances, having youth and students working for a subminimum tipped wage was associated with a decrease in family poverty, but also that subminimum wage work “compounded already high poverty rates for hourly workers with disabilities.” Further research that disaggregates the data in the subminimum tipped wage by age, gender, race, and household income would certainly be welcome, not least because the restaurant industry often showcases a carefully selected group of tipped employees who are garnering high levels of tips, as if the size of these tips is uniform across the industry when aggregated together. Advocates for tipped minimum wages find that is not the case.
Other research examining how restaurant servers in particular benefit in terms of total wages in states and cities with a fixed minimum wage, compared to those with subminimum tipped wages still in place, finds that minimum wage policy reforms are not worthwhile. Economists John E. Anderson at the University of Nebraska at Lincoln and Őrn B. Bodvarsson Westminister College in Salt Lake City find in a 2005 paper, “Do higher tipped minimum wages boost server pay?” that “1999 data on waitpersons and bartenders” show little evidence that there is a wage premium for these workers “in states with more generous minimum wages.”
It is important to emphasize, however, that similar outcomes across states refute outsized claims that getting rid of the subminimum wage will be disastrous for workers who would be subject to fair wage laws and the industries in which they work. Research in 2016 by economist T. William Lester at San José State University, for example, captures some important other factors related to higher labor standards in full-service restaurants in San Francisco, where fair wage standards were enacted several years ago, compared to the Research Triangle Park in North Carolina, where subminimum tipped wages remain the standard. He finds a number of important effects from the introduction of fair wage laws in the former market and the continuation of monopsonistic labor practices in the latter. Yet Lester also finds that neither the servers nor the restaurants in either place registered demonstrably terrible results from reform on the one hand and no reform on the other.
And then, there’s the broader question of family well-being—specifically, the quality of the future human capital of the children of restaurant workers in the United States. Epidemiologists Sarah Andrea at the University of Washington School of Public Health and her four co-authors at the Oregon Health and Science University’s School of Public Health conducted a nationwide investigation of the impact of the tipped worker subminimum wages on the gestational period of infants born to restaurant workers. They find that infants born to mothers working for subminimum wages have lower birth weights—one key negative factor in the subsequent physical and mental development of those infants. The five researchers conclude that “increasing the subminimum wage may be one strategy to promote healthier birthweight in infants,” which, in turn, would improve the future economic well-being of those children.
Clearly, economic debates about whether a subminimum wage for tipped workers increases wages on the margin or reduces employment on the margin is not the whole story when it comes to restaurant workers and their families. Earnings stability and the consequences for family economic well-being need to be considered in the mix, too.