JOLTS Day Graphs: August 2022 Edition

Every month the U.S. Bureau of Labor Statistics releases data on hiring, firing, and other labor market flows from the Job Openings and Labor Turnover Survey, better known as JOLTS. Today, the BLS released the latest data for August 2022. This report doesn’t get as much attention as the monthly Employment Situation Report, but it contains useful information about the state of the U.S. labor market. Below are a few key graphs using data from the report.

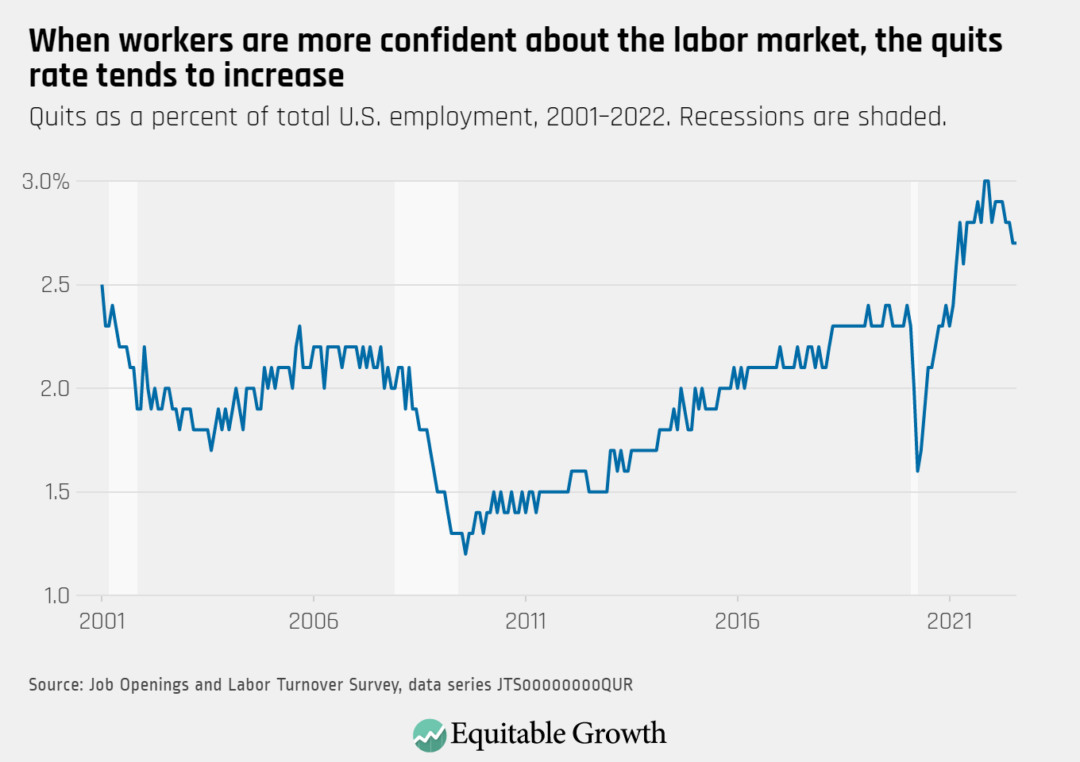
The quits rate remained steady at 2.7 percent as 4.2 million workers quit their jobs in August.

Quits as a percent of total U.S. employment, 2001–2022. Recessions are shaded.

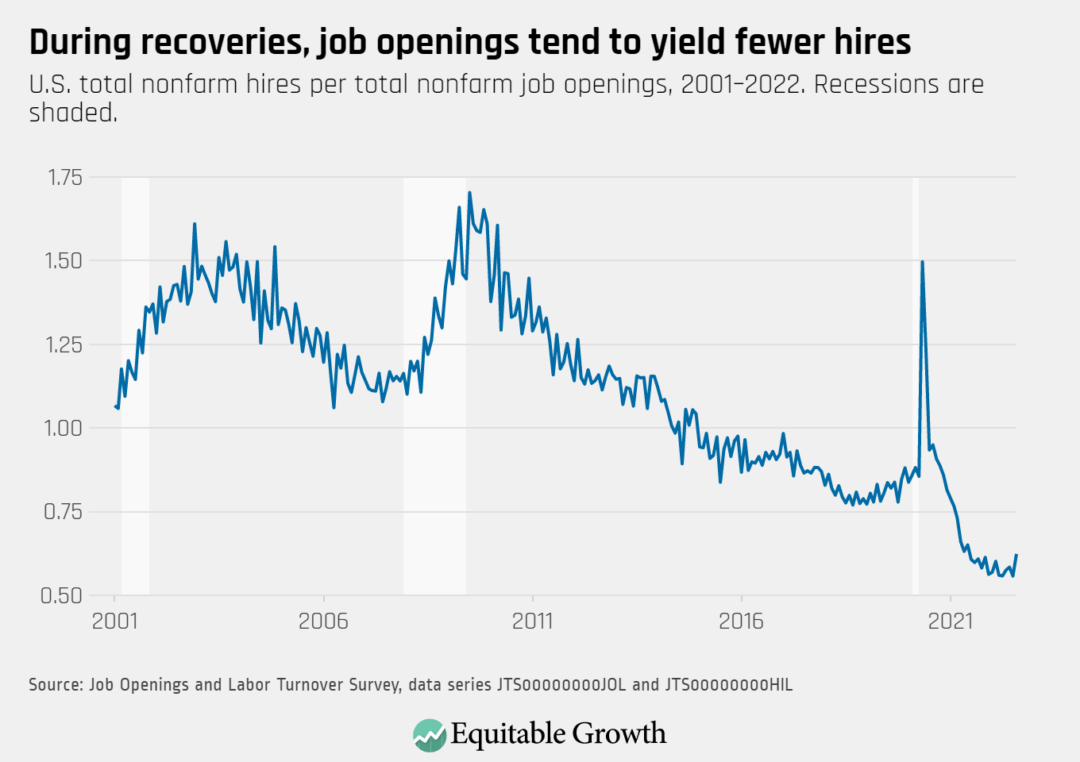
The vacancy yield increased to 0.62 in August from 0.56 in July, a notable rise, as the number of reported job openings declined and hires remained relatively constant.

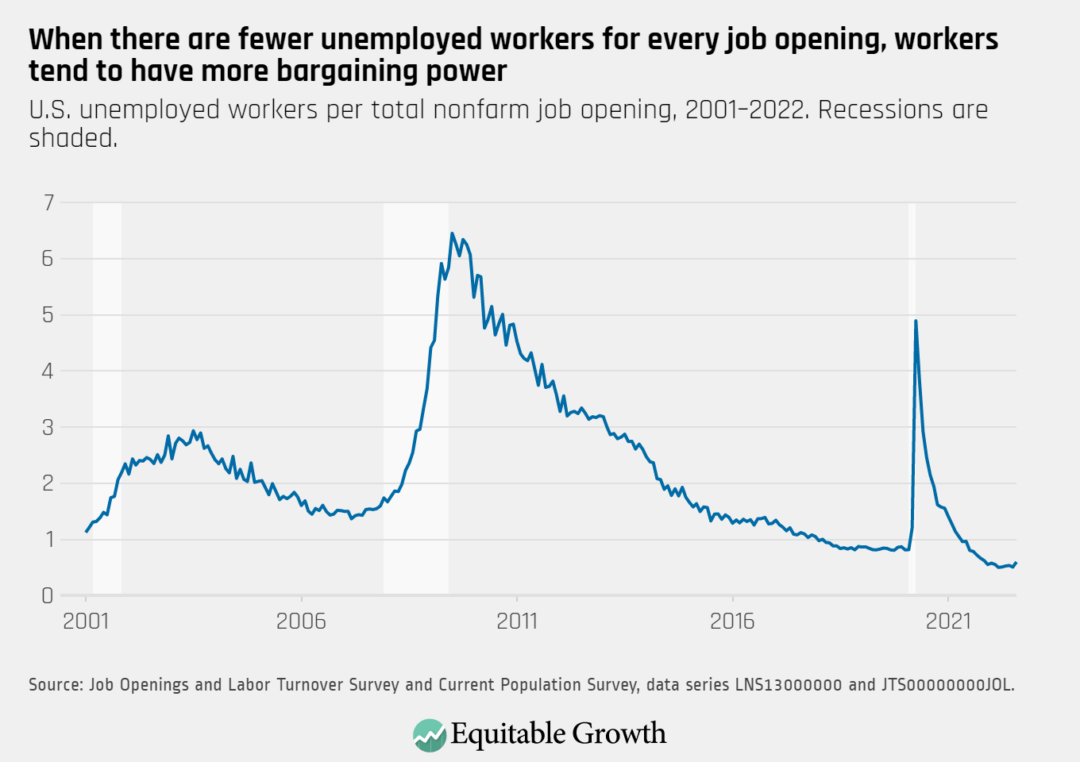
The ratio of unemployed workers to job openings increased in August to almost 0.60 from just under 0.51 in July.

U.S. unemployed workers per total nonfarm job opening, 2001–2022. Recessions are shaded.

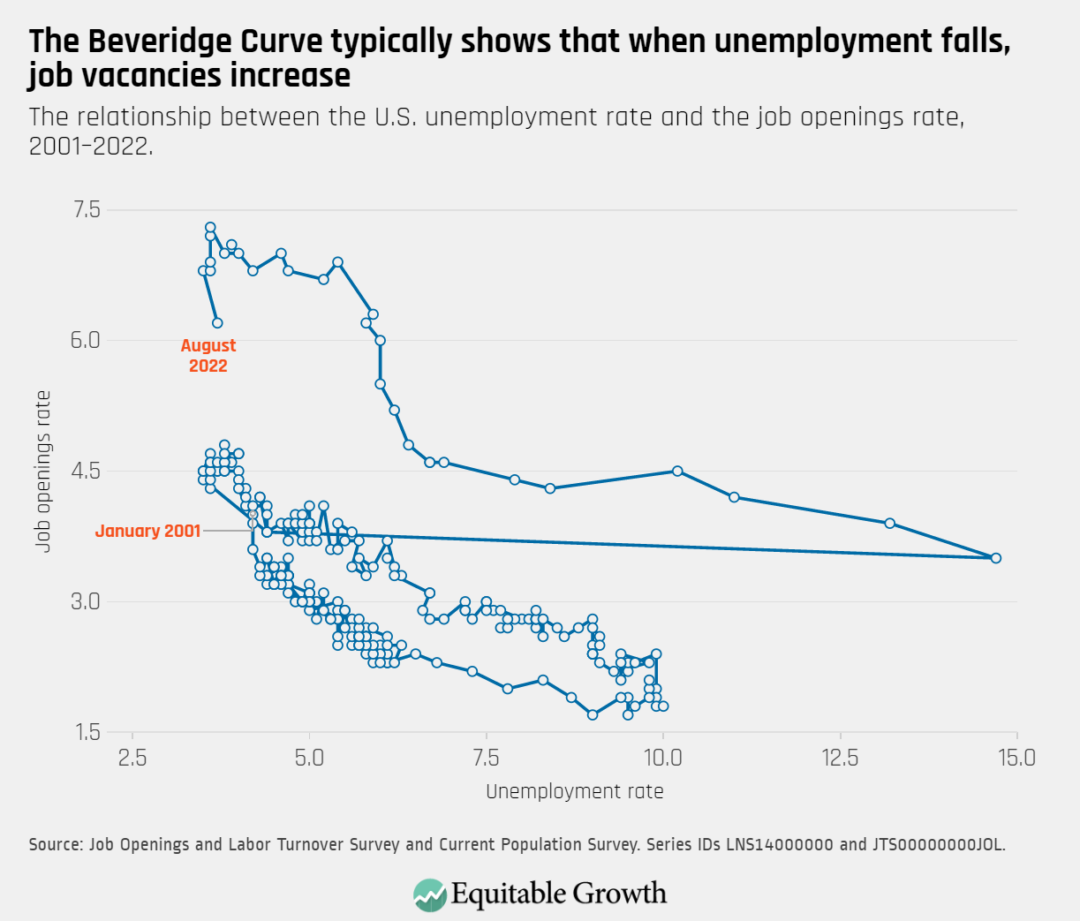
The Beveridge Curve moved sharply downwards in August as reported job openings fell and the unemployment rate ticked up.

The relationship between the U.S. unemployment rate and the job openings rate, 2001–2022.

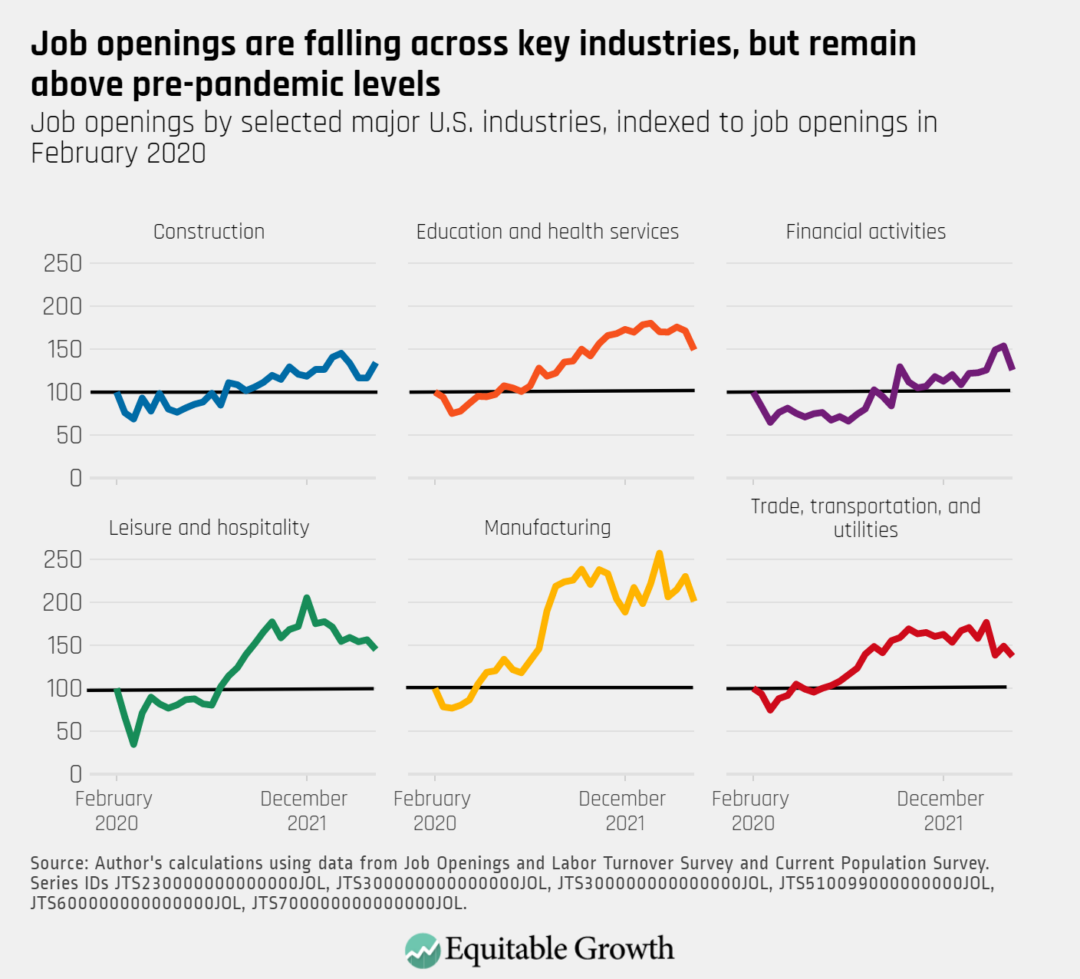
The overall number of reported job openings decreased by 1.1 million in August (6.2 percent) to 10.1 million, with openings falling in industries such as education & health services, leisure & hospitality, and manufacturing.

Job openings by selected major U.S. industries, indexed to job openings in February 2020
Connect with us!

Explore the Equitable Growth network of experts around the country and get answers to today's most pressing questions!

Get in Touch