The Washington Center for Equitable Growth this week delivered a comment letter responding to the U.S. Department of Labor’s Wage and Hour Division’s proposed rulemaking on how to determine who is an employee and who is an independent contractor under the Fair Labor Standards Act. The department’s proposal would reduce the risk that employees are incorrectly classified as independent contractors, thereby preventing their exclusion from key U.S. labor rights, boosting fair competition among employers, and promoting broadly shared economic growth.
The U.S. Department of Labor’s proposed rule would replace and correct prior guidance, reducing the risk of misclassification and adopting an “economic reality test” that better captures whether a worker is truly leading an independent activity or working for someone else. For instance, the test considers whether a worker can truly negotiate the pay they get for providing a service, the extent to which they can accept or reject offers, the degree to which they are supervised or surveilled by an employer, and whether an employer has a say over their schedule.
The comment letter discusses key points on the impact of worker misclassification and how revised guidance on how to determine who is an independent contractor and who is an employee would improve outcomes for misclassified workers and the overall economy, including:
Several audit and industry-specific studies find evidence that misclassification affects a substantial number of U.S. workers and is especially prevalent in low-wage sectors, such as janitorial services. The department’s proposed rule to reduce the risk of misclassification would therefore allow many already-vulnerable workers to access the labor protections to which they are entitled.
The department’s proposed rule is likely to boost pay for many workers since there is evidence that some currently classified as independent contractors, such as ride-hail drivers, receive pay so low that they fall below both the federal and their jurisdiction’s minimum wage floor.
In addition to not being protected by the Fair Labor Standards Act, misclassified workers are not covered by anti-discrimination law, are not eligible for Unemployment Insurance benefits or Workers’ Compensation, and cannot join a union or bargain collectively. While the proposed rule only affects coverage under the Act, allowing currently misclassified workers to access minimum wage protections and overtime regulations is even more essential, given that they are excluded from other key labor laws.
Read the full letter submitted to the U.S. Department of Labor.
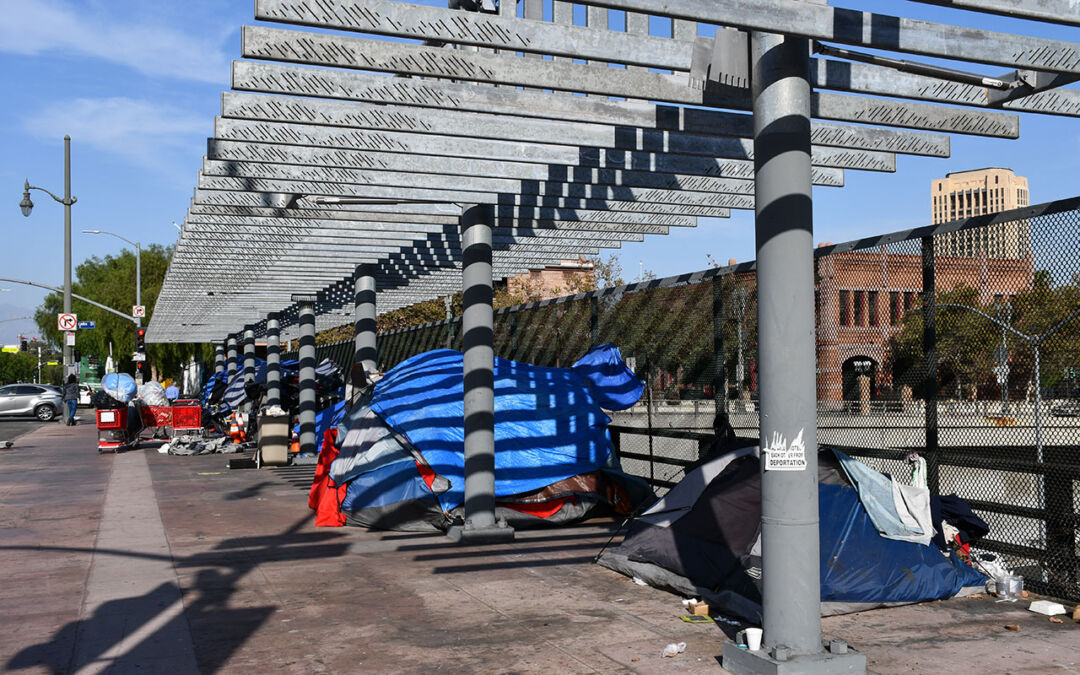
A homeless encampment in downtown Los Angeles, October 2019.
This column is the first in a series by guest authors examining systemic racial, ethnic, and gender inequities in the U.S. economy and in access to government social infrastructure and income support programs—inequities that hinder the full growth potential of our economy and the well-being of our society.
Homelessness in the United States is the most visible and jarring expression of housing insecurity, yet millions of people across the nation live in unstable housing conditions. These financially insecure people and families must often double or triple up with other people in housing designed for single families or single people. Many are living in their cars, outside encampments, or in temporary shelters. And many more are just one paycheck or one emergency away from losing their apartment or home.
These programs provided critical support for those struggling with housing insecurity during the COVID-19 recession and the legacy of years of low wages and precarious work, without worker protections, such as paid leave or healthcare—all of which contributed to widespread financial fragility. Indeed, before the pandemic, there were 140 million poor and low-income people in the United States.
Investments in our nation’s social infrastructure via pandemic assistance programs brought these numbers down significantly, albeit temporarily, offering a glimpse of what a more equitable economy and society might look like—in which all workers and their families were treated as essential rather than expendable, where they could remain in their homes and living spaces, and where child well-being was a national priority.
The eviction moratorium was the longest-running of these programs, enacted first under the Coronavirus Aid, Relief, and Economic Security, or CARES, Act in March 2020 and then extended by the U.S. Centers for Disease Control and Prevention multiple times. The moratorium was lifted in August 2021, when the U.S. Supreme Court ruled that the CDC had exceeded its authority.
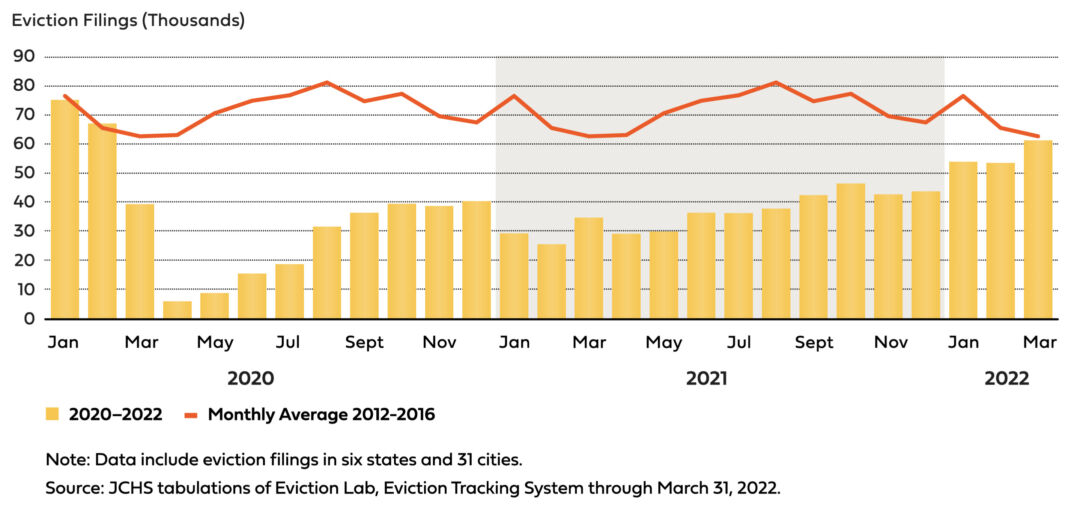
Although the decision was premature, and the court itself acknowledged that between 6 million and 17 million tenants would be at risk of eviction, it nonetheless went forward, imposing this unnecessary trauma on millions of U.S. households. Evictions are now on the rise and may even surpass pre-pandemic levels. (See Figure 1.)
Figure 1
Home evictions on the rise again in the United States
According to a new study from the Joint Center for Housing Studies at Harvard University, rent increases for apartments reached record levels in 2022, with more than 75 percent of large metropolitan rental markets experiencing double-digit percentage growth in rental prices. These rising rental costs weigh heavily on poor and low-income households, especially historically marginalized households that do not have generational wealth upon which they can either fall back on or use to provide the financial resources to become homeowners.
The same study also documents that in 2022, lower-income households, renters, and homeowners of color were more likely to be behind on their mortgage and rental payments than other households. More recent Household Pulse data (from October 5–17, 2022) show that approximately 5.3 million households are behind on their home mortgage payments. More than 40 percent of these households (2.29 million) have an annual household income of less than $50,000. Nearly 19 percent of these financially stressed people (994,000) are Hispanic, 14 percent (770,000) are Black, 14 percent (785,000) are Asian American, and 46 percent (2.48 million) are White.
The same Household Pulse data show that among renters, the numbers are worse, with roughly 13 percent of the nation’s renters—more than 7.7 million people—behind on their rent. These renters are disproportionately Black (22 percent, or 1.7 million) and Hispanic (28 percent, or 2.2 million), although White renters account for 37 percent (2.8 million) of this population. More than two-thirds, or 5.2 million, are poor or low-income renters.
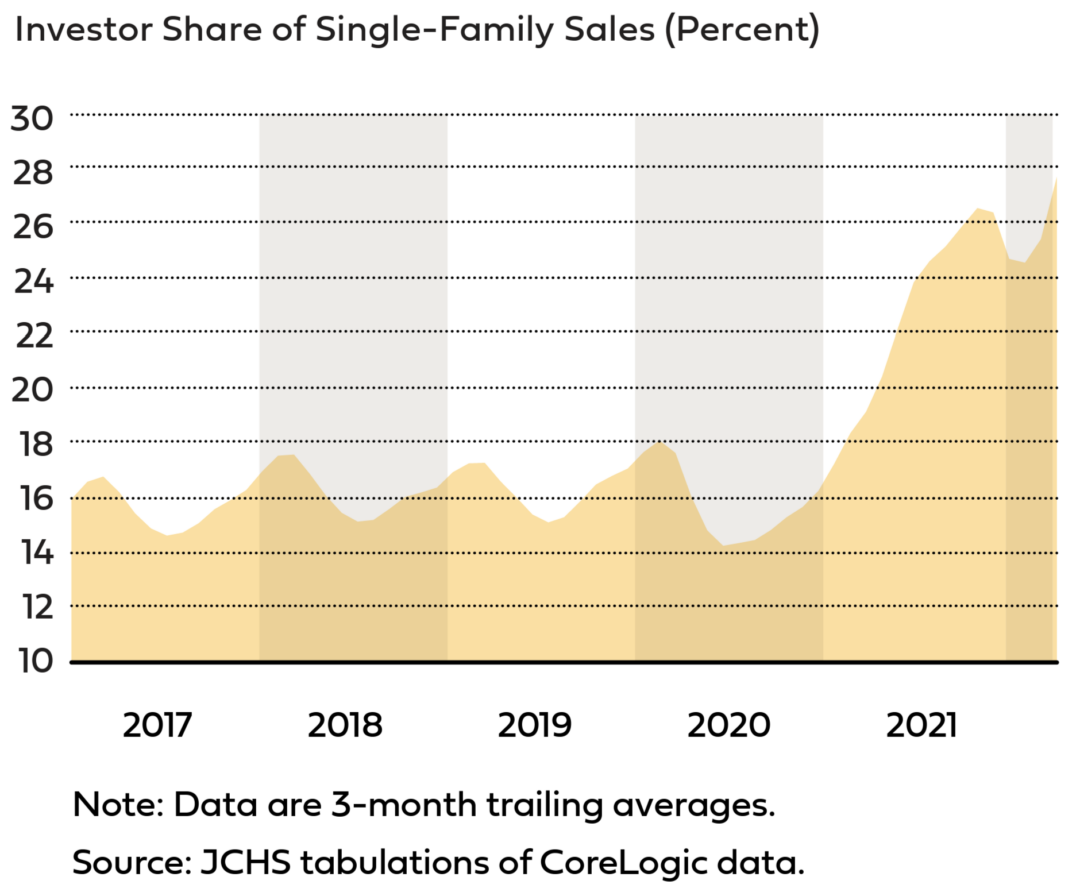
Part of this home mortgage and rental housing crisis is driven by the entry of Wall Street investors, particularly speculative private-equity firms and hedge funds. Home purchases by these financial investors, which have been on the rise since 2008, spiked in 2021, contributing to these unaffordable rents and home prices. (See Figure 2.)
Figure 2
Investors are buying up a record share of single-family homes
What’s more, the U.S. Bureau of Labor Statistics just last month reported that shelter prices are the dominant factor in the monthly increase in inflation. According to the BLS report, “over the past year, the shelter index has gone up 6.9 percent accounting for 40 percent of the total increase in all items, less food and energy.”
In short, housing insecurity is having an economywide impact.
Housing (in)security is a policy choice
Amid the continuing COVID-19 pandemic, there are policies that can relieve the pressures and trauma of housing insecurity. The answer to homelessness is housing. The answer to unaffordable housing is to make housing affordable through rent control, debt relief, and living wages. In 2022, a true housing wage for a two-bedroom apartment would be $25.82 an hour, or about 3.5 times the federal hourly minimum wage of $7.25.
These are some of the demands that have been made by the National Union of the Homeless and others to push back against street sweeps, rental evictions, and mortgage foreclosures. Today, alongside a growing network of homeless-led organizing, tenant organizing is gaining momentum, with creative tactics such as disrupting and blocking eviction hearings. Ballot initiatives for affordable housing, rent control and support for unhoused people are being passed in dozens of cities.
The Poor People’s Campaign has incorporated these experiences in its “moral policy” agenda, a broad-reaching document that articulates a concrete platform to establish a more equitable and just society. On housing, it calls for:
The immediate cessation of all evictions and foreclosures, sweeps (of cars and encampments), and the criminalization of unhoused people
An end to housing speculation, rent increases, and late fees on mortgage and housing payments
An expansion of affordable, equitable, and safe public housing (not government encampments or congregate shelters) for all in need—regardless of gender, citizenship documentation, or carceral status, funded in part by profits unduly gained by the finance, insurance, and real estate sectors of the U.S. economy
Relief for housing and rental debts
Many of these policies have an historic or contemporary basis to build from. Over the past 2 years, there have been temporary or partial implementations of a number of these policies. They were proven to be effective then. They also ended too soon.
This is not unique to housing policy. The Child Tax Credit was indisputably effective in reducing child poverty, food insecurity, and housing insecurity in the United States, especially among the poorest children and households (who are disproportionately Black and Latino). Yet this program also was ended prematurely. Within weeks, nearly all of its gains were swiftly undone.
Rather than resource scarcity, these programs were cut due to a scarcity of political will. That needed political will is now being mustered by organizations that are willing to build power among those most impacted by ongoing injustice.
The power for poor people
When Rev. Dr. Martin Luther King Jr. was working toward the launch of the 1968 Poor People’s Campaign, he recognized that building the political will for anti-poverty programs required organizing poor and dispossessed people—across race, issue, geography, and other lines of division—to take action together. In Where Do We Go From Here, he wrote:
When people are mired in oppression, they realize deliverance when they have accumulated the power to enforce change. When they have amassed such strength, the writing of a program becomes almost an administrative detail. It is immaterial who presents the program; what is material is the presence of an ability to make events happen … our nettlesome task is to discover how to organize our strength into compelling power so that government cannot elude our demands.
At a meeting of poor people’s organizations in January 1968, King described that power in more detail: “Power for poor people will really mean having the ability, the togetherness, the assertiveness, and the aggressiveness to make the power structure of this nation say yes when it may be desirous of saying no.”
The Kairos Center for Religions, Rights and Social Justice, which co-anchors the Poor People’s Campaign with Repairers of the Breach, has deep roots in poor-led organizing. From the National Welfare Rights Organization and the National Union of the Homeless (see sidebar) to front-line organizing around housing, healthcare, water, public education, low-wage work, immigration, and more, the Kairos Center has emerged out of more than two decades of groundbreaking struggle, dynamic liberation theology, and engaged research and scholarship.
This winter, the Kairos Center is collaborating with the reconstituted National Union of the Homeless for a “Winter Offensive” against poverty in the midst of plenty. From Thanksgiving to Martin Luther King Day, the Kairos Center and the National Union of the Homeless will expose the injustice of homelessness. Armed with testimonies, facts, art, music, and theology, the 8-week organizing drive will reclaim the true spirit of this season, insisting that a more equitable society is not only necessary, but possible.
—Shailly Gupta Barnes is the policy director for the Kairos Center for Religions, Rights and Social Justice and the national policy director for the Poor People’s Campaign: A National Call for Moral Revival. She has a background in law, economics, and human rights, and has been working with and for poor and dispossessed people for nearly 20 years.
The Washington Center for Equitable Growth this week delivered a comment letter responding to the National Labor Relations Board Advanced Notice of Proposed Rulemaking on Joint-Employer Standard. The comment letter responds to the NLRB’s planned rescinding and replacing of the previous joint-employer rule that took effect on April 27, 2020, which limited legal liability of joint employers by modifying the definition of a joint employer for certain employees.
Mounting evidence shows that the fissuring of the workplace—a phenomenon where lead companies delink previous direct employment relationships within production and service provision among a network of outsourced subcontractors, independent contractors, and other business-to-business relationships such as franchising—fosters rising labor market inequality and distorts who shares in the gains of economic growth.
Lead companies often exert significant control over workplace practices, but with the previous limited joint-employer standard, they have limited legal liability under the National Labor Relations Act to uphold workplace protections, and they are not under obligation to bargain with the workers who are directly employed by subcontractors or franchisees. This, in turn, exacerbates trends of rising income inequality and declining job quality that distort the U.S. labor market and subvert U.S. workers from sharing in the gains of growth.
The comment letter discusses key points on the impact of workplace fissuring and how a stronger joint-employer standard is beneficial for the economy. Specifically:
Norms of fairness and pay equity within workplaces have fractured as firms outsource parts of their businesses, exerting downward wage pressures on contracting firms. As such, income inequality between firms has grown more than within firms, partially explaining overall trends in rising U.S. income inequality.
Nearly 20 percent of the U.S. workforce is in industries where fissured arrangements are standard practice, making this a wide-scale issue. Establishing an adequate joint-employer standard will help this significant minority of U.S. workers be able to bargain to share in the value they create.
Research on franchising finds that franchisors exert control over workplace practices in establishments owned and operated by franchisees, demonstrating the need for a joint-employer standard that holds them responsible for working conditions.
Boosting the effectiveness of collective bargaining through the proposed joint-employer rule is likely to increase job quality, with research showing that union establishments are more likely to enforce labor regulations, such as the Occupational Safety and Health Act.
Black and Latino workers are overrepresented in nonstandard work arrangements, such as temporary agency jobs—positions that tend to pay lower wages and be more dangerous than comparable jobs embedded in traditional employment relationships—highlighting the need to make it easier for these workers to negotiate with the firms that have control over their working conditions and revise the standard for establishing which employers are liable as joint employers.
Read the full letter submitted to the National Labor Relations Board.
Since its founding in 2013, the Washington Center for Equitable Growth has supported scholars across disciplines and along the career ladder who are studying the effects of inequality on economic growth. We do this not only through our annual grantmaking cycle, but also by offering mentorship, press and media support, policymaker and researcher connections, and more throughout the year.
One important aspect of our academic engagement is networking and fostering opportunities to present research at academic conferences. Case in point: Equitable Growth staff organized, chaired, participated in, and attended several different panel sessions at this year’s Association for Public Policy Analysis and Management fall research conference and the Southern Economic Association 92nd annual meeting. In doing so, we were able to highlight a number of our current research priorities and policy areas of interest, as well as our role as a grantmaking institution.
At APPAM, which took place in Washington from November 17–19, many of the more than 30 sessions that featured Equitable Growth and our network of scholars centered on child care and early childhood education, as well as on the future of work. These two areas are major aspects of our 2023 Request for Proposals, and our engagement in the following sessions allowed us to spread the word about how we can support research in these areas in the coming year.
Equitable Growth’s Research Advisor Jonathan Fisher organized a panel on the many impacts of the 2021 Child Tax Credit expansion. Grantee Bradley Hardy of Georgetown University served as the panel chair, alongside discussants Heather D. Hill of the University of Washington and Lucie Schmidt of Smith College. Rutgers University’s Jacob Bastian presented his research on how the CTC expansion affected poverty and employment rates; the University of Washington’s Nicole Kovski presented co-authored research on how the CTC expansion impacted mental health and well-being among low-income parents; and Equitable Growth’s Director of Family Economic Security Policy Alix Gould-Werth presented co-authored research on how families actually spent (or saved) the CTC funds.
Equitable Growth’s Labor Market Senior Policy Analyst Kathryn Zickuhr organized and chaired a panel on racial and ethnic disparities in the tech industry. Discussants Cathy Liu of Georgia State University and Elsie Harper-Anderson of Virginia Commonwealth University responded to paper presentations from the St. John’s University’s Rachel M.B. Atkins, who discussed her co-authored research on measuring racial and ethnic representation in the tech sector; from University of Texas at Austin’s Rowena Crabbe, who presented her co-authored paper on the state of Black entrepreneurship and a research agenda for examining its future; from University of Illinois, Chicago’s Sigrid Luhr, who delved into her research findings on diversity in the San Francisco Bay Area tech industry; and from the University of California, Los Angeles’ Alicia Sheares, who presented her findings on the various and varying hurdles that Black workers in tech face across different geographic regions.
Equitable Growth’s Family Economic Security Senior Policy Analyst Sam Abbott served as a discussant for a panel on new research on paid leave policies, alongside grantee Yulya Truskinovsky of Wayne State University. Several papers were presented, including Equitable Growth-funded research from Columbia University’s Meredith Slopen on how paid sick leave guarantees affect women’s self-reported health and well-being.
Other APPAM sessions that featured funded research from our academic network included another panel on the 2021 CTC expansion, in which University of Michigan’s Natasha Pilkauskas presented her co-authored research on the Child Tax Credit’s impacts on the economic well-being of low-income families, and a panel on intergenerational upward mobility, in which Equitable Growth Dissertation Scholar Sheridan Fuller of Northwestern University presented his research on the long-term effects of, and racial disparities in access to, income support programs such as Aid to Families with Dependent Children.
In addition to presenting their research, many Equitable Growth staff, grantees, and network members participated in APPAM’s fall conference as moderators, panel chairs, and discussants. Session topics varied across disciplines and topics, from schedule stability to government’s role in supporting workers, and much more. For instance, the roundtable examining the role of the Committee on National Statistics featured an informative discussion, moderated by Equitable Growth Research Advisory Board member David Johnson of the National Academies of Sciences, Engineering, and Medicine, of how federal statistics can inform policymaking across a wide range of areas, including measuring poverty, food security, and access to healthcare.
Immediately following APPAM, the Southern Economic Association annual meeting took place from November 19–21 in Fort Lauderdale, Florida. Equitable Growth was excited to co-host an SEA panel with the Russell Sage Foundation on how to prepare and submit a successful grant proposal for economic research. Panelists included Equitable Growth grantee Mark Curtis of Wake Forest University, Melinda Miller of Virginia Polytechnic Institute and State University, the Russel Sage Foundation’s Stephen Glauser, and Equitable Growth’s Academic Programs Associate Sanjay Supan.
As SEA is focused on economics research, other sessions here that featured Equitable Growth voices and perspectives largely focused on competition and industrial organization and climate change’s impact on inequality and the economy—two main research priorities for Equitable Growth in the coming year.
Some panels of particular interest included:
A session organized by Equitable Growth grantee Martha Bailey of the University of California, Los Angeles focused on using microdata to study intergenerational outcomes for U.S. families. Grantee Paul Mohnen of the University of Pennsylvania presented his funded research on the long-term, intergenerational effects of Social Security.
Equitable Growth grantees Wake Forest University’s Curtis, Eric Ohrn of Grinnell College, and Juan Carlos Suárez Serrato at Duke University presented their funded research (co-authored with Kevin Roberts at Duke) on how capital investment in the form of bonus depreciation affects labor and inequality.
In a session focused on competition and industrial organization, grantee Matthew Weinberg of The Ohio State University presented his co-authored funded research on buyer power in the meatpacking industry, how it has changed over the past 20 years, and what effects it has on prices.
Overall, these two academic conferences were excellent opportunities to showcase the breadth of our existing network of scholars, highlight our research priorities for 2023, and raise awareness about who we are and what we fund among a broad and diverse group of researchers studying inequality and economic growth.
Equitable Growth is now accepting applications for its 2023 Request for Proposals. To learn more about funding and research priorities, who is eligible, and how and by when to apply, click here.
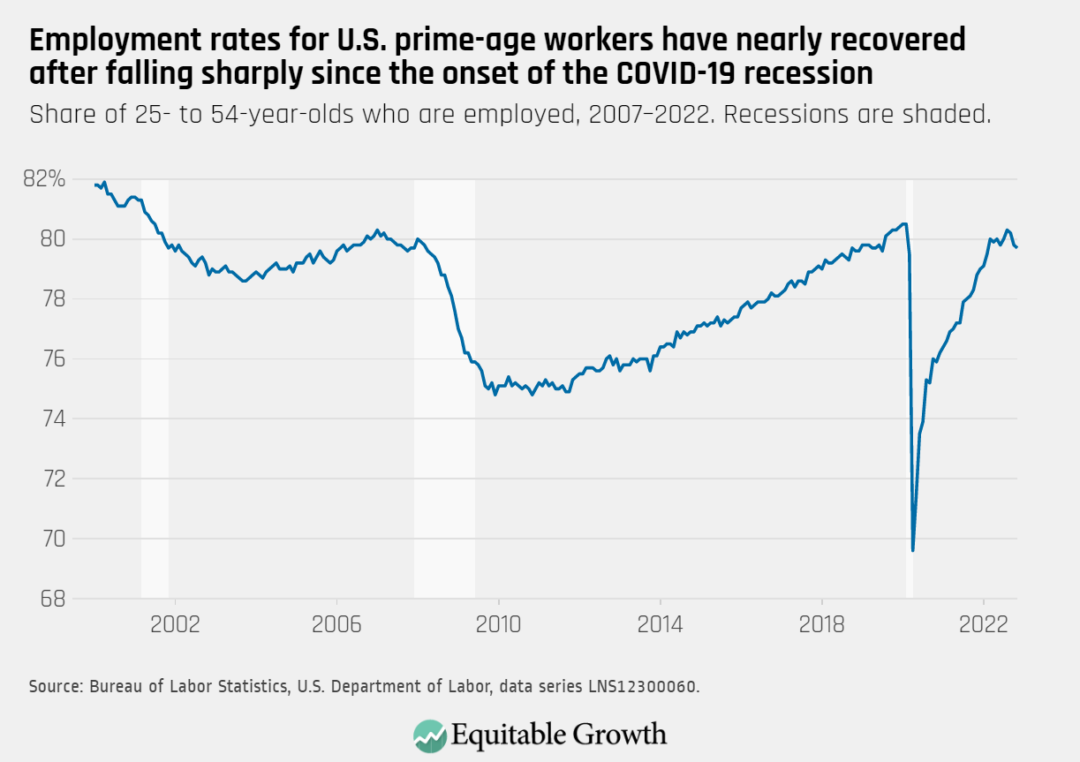
On December 2 the U.S. Bureau of Labor Statistics released new data on the U.S. labor market during the month of November. Below are five graphs compiled by Equitable Growth staff highlighting important trends in the data.
The employment rate for prime-age workers decreased slightly from 79.8 percent in October to 79.7 percent in November 2022 as total nonfarm employment rose by 263,000.
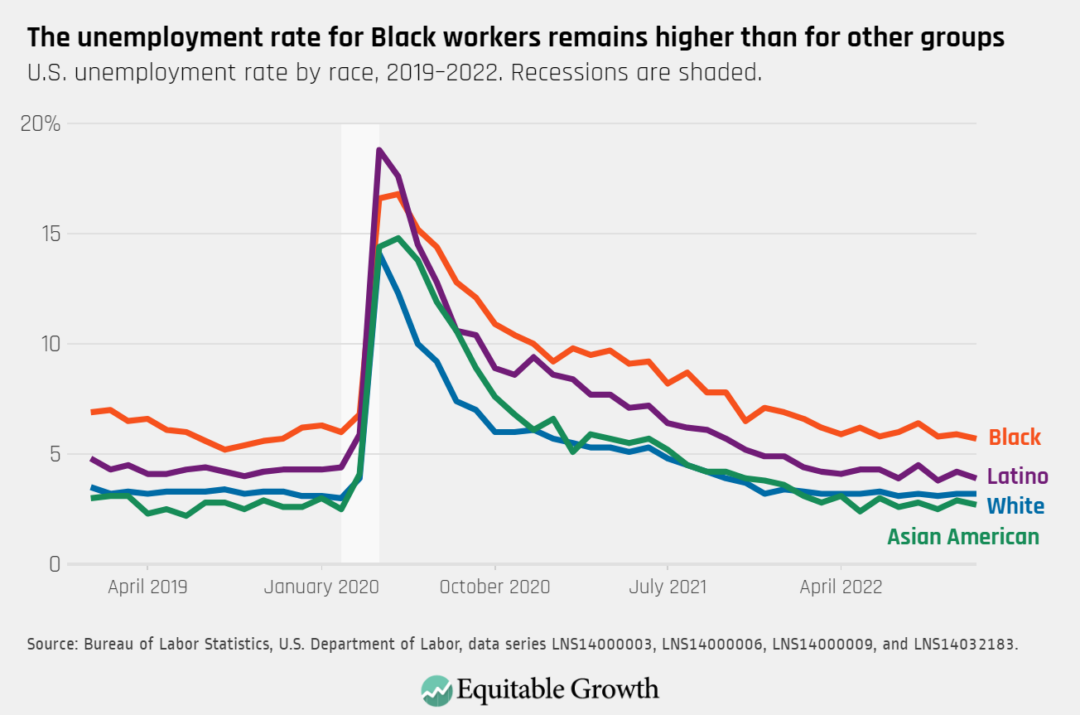
The unemployment rate stayed at 3.7 percent in November and remains high for Black workers (5.7 percent), compared to other groups. The unemployment rate is 3.9 percent for Latino workers, 3.2 percent for White workers, and 2.7 percent for Asian American workers.
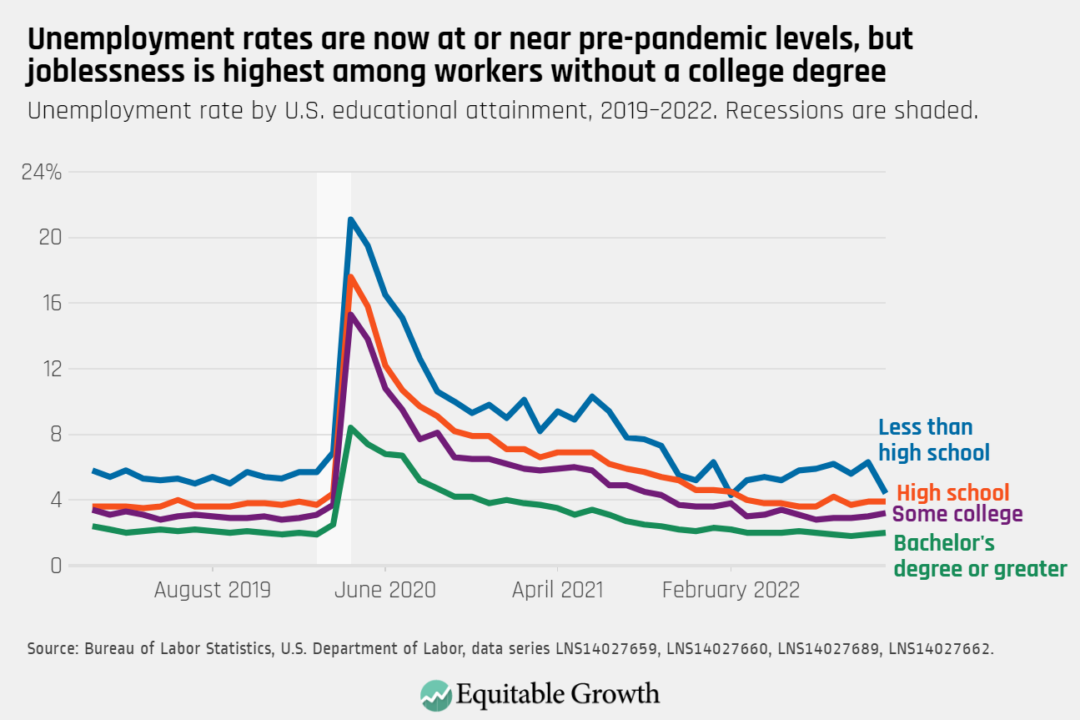
The unemployment rate fell to 4.4 percent for workers with less than a high school degree and remained near 3.9 percent for high school graduates. Rates increased slightly to 3.2 percent for workers with some college and 2 percent for college graduates.
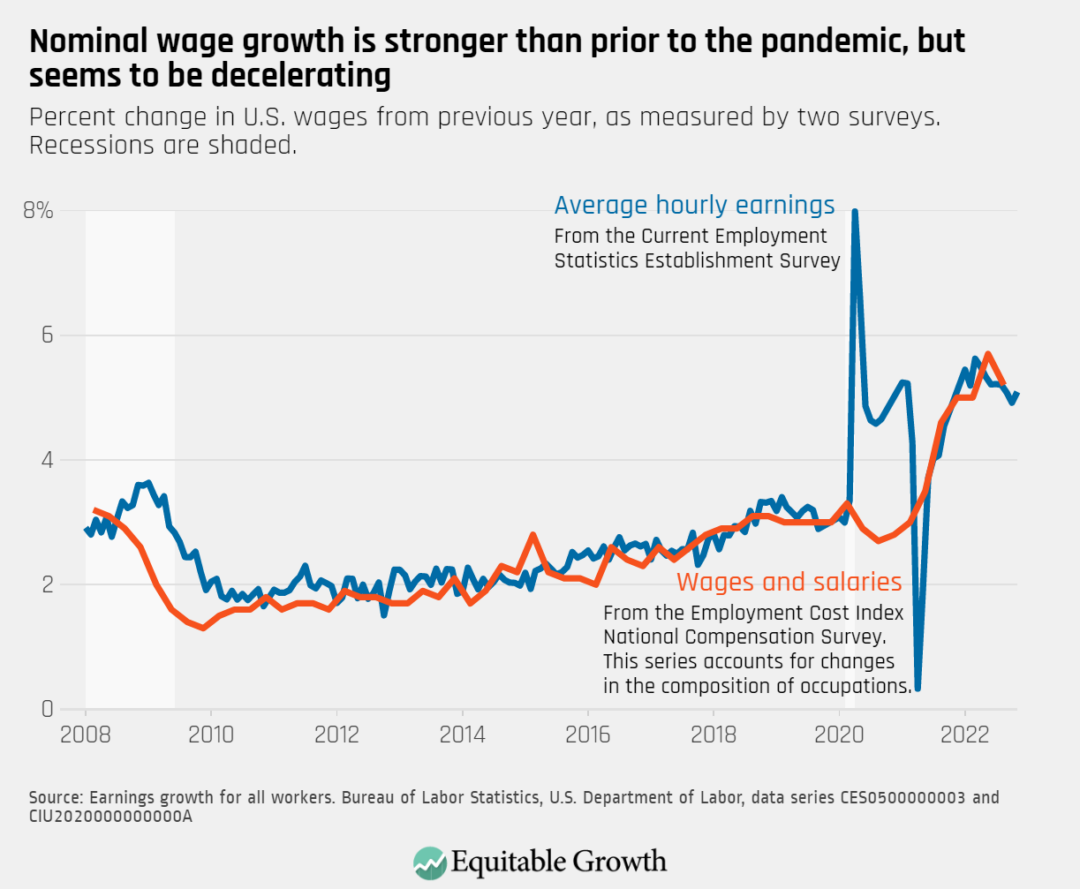
Nominal wage growth (not accounting for inflation) increased slightly in November, with average hourly earnings growth at 5.1 percent over the past 12 months.
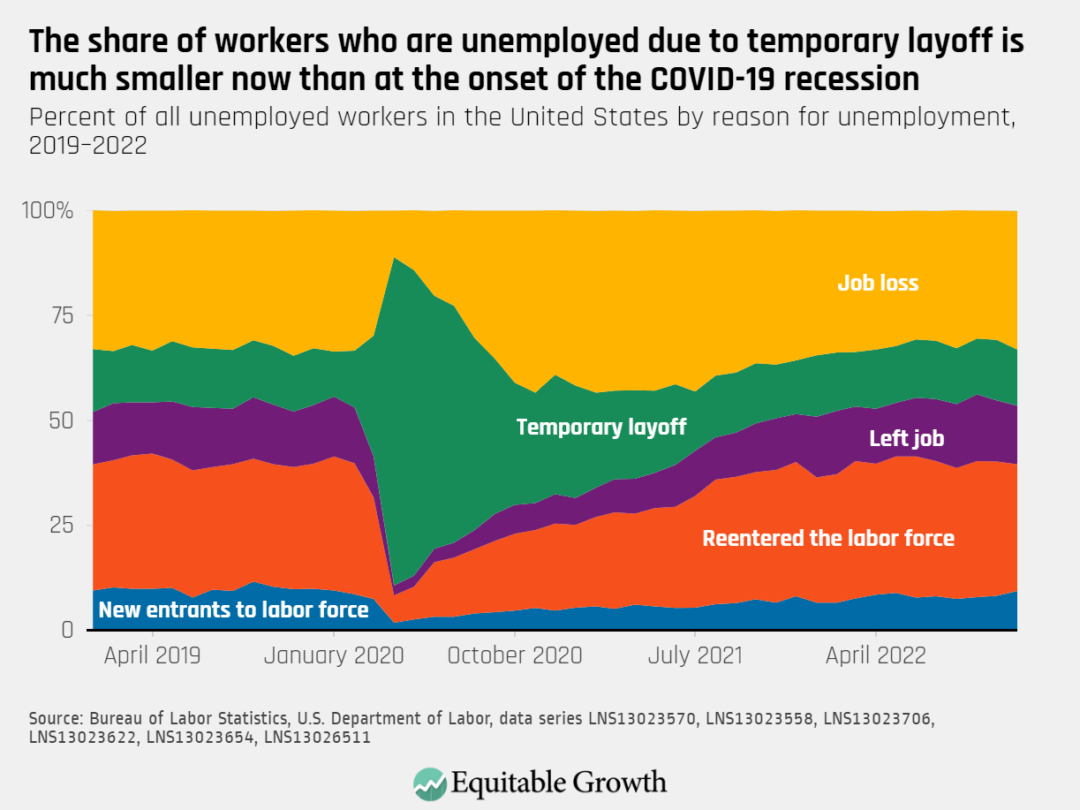
The share of unemployed workers who are unemployed due to job loss rose to 33 percent, and 13.4 percent are on temporary layoff; the share who left their job (13.9 percent) or are reentering the labor force (30.2 percent) declined, while new entrants rose (9.4 percent).
Sometimes people in the United States experience health conditions that affect their ability to work, whether it’s a cold, flu, or cancer. This may lead to questions about whether they can take time off from work to address their health, without sacrificing pay. Below, we address and answer frequently asked questions about what paid sick time is, and how it affects the U.S. economy.
Question: What is paid sick time for?
Answer: Workers often need paid time away from their jobs, whether they are experiencing a short-term illness, undergoing a surgery and recovery that will last a few days, or simply visiting the doctor for a wellness exam. In the United States, paid sick time allows workers to address such short-term needs. It also allows workers to spend time caring for their loved ones when they fall ill or suffer an injury.
Q: How can U.S. workers access paid sick time?
A: Some employers voluntarily offer paid sick time to their workers, and currently 36 states and localities require that employers provide paid sick time, though workers have no federal right to paid sick time, meaning some workers do not have access to paid sick time.
Q: Who does and doesn’t have access to paid sick time?
A: Seventy-eight percent of U.S. workers can access paid sick time through their employers. But paid sick time is out of reach for typical low-income workers. Only 4 in 10 workers in the lowest-paid jobs, who are disproportionately workers of color, have access to paid sick time.
Q: Is paid sick time an economic policy?
A: The primary purpose of paid sick time is to allow workers to address short-term medical needs without suffering economic hardship. But paid sick time also benefits employers and the overall U.S. economy. In supporting personal health, public health, and productivity, paid sick time helps stabilize and grow the U.S. economy.
Q: What does paid sick time do for U.S. businesses?
A: One study estimates the cost of providing paid sick leave was just 2.7 cents per worker per hour, and other research shows that when businesses implement paid sick-time policies, they do not cut other employer-provided benefits, indicating that employers are likely to be able to absorb the average cost of providing paid sick time.
Q: What does paid sick time do to help the broader U.S. economy?
A: Controlling communicable disease is essential to ensuring that workers are able to produce goods and services and that consumers will purchase those goods and services—in other words, to ensuring that large parts of the economy can function normally. Local paid sick-time laws reduce influenza-like infections by 30 percent to 40 percent. Similarly, when the federal government enacted a temporary, coronavirus-specific paid sick time policy in 2020 through the Families First Coronavirus Response Act, states where workers gained new access to the emergency paid sick leave program saw COVID-19 cases drop by 56 percent.
Q: Are there efforts to extend paid sick time to all U.S. workers?
A: Federal policies are needed to ensure that all workers can access leave to address health issues they or their loved ones face, thus encouraging long-run economic growth and benefitting the overall U.S. economy. One bill that proposes a federal paid sick time policy is the Healthy Families Act.
The U.S. Congress this week is considering legislation imposing a new contract on U.S. railroad workers to avert a potential strike following a breakdown in negotiations between several of the nation’s railroad unions and U.S. railroad companies. At the heart of these negotiations is workers’ access to paid sick time.
U.S. railway companies currently provide workers with zero days of paid sick time while union negotiators have been requesting 15 days. Previous negotiations, which several unions voted to reject, offered just one additional personal day. Congress is considering adding 7 days of paid sick time to the package, with the U.S. House of Representatives voting in favor of 7 days (alongside a companion bill with zero days). The House legislation is now before the U.S. Senate.
The request for paid sick time makes sense. Paid sick time not only supports the health and economic well-being of workers but also the economic situation of their employers and the broader economy.
Paid sick time is typically used when a worker experiences an illness or injury that lasts a short time or when a worker needs to address a short-term care need of a loved one. Unlike all economically comparable nations, there is no national guarantee to paid sick time in the United States, but it is a relatively common benefit for U.S. workers. In 2021, 77 percent of all private industry workers had access to paid sick time, including 87 percent of unionized workers and 73 percent of workers employed at transportation and material moving firms.
Rather than asking for an overly generous concession, U.S. railroad workers lacking any paid sick days are actually an outlier among their peers.
For U.S. workers and their families, paid sick time is about a basic right to rest or recovery from an injury or illness without sacrificing critical paychecks. Research shows that workers with paid sick time are better able to manage their own health needs, reducing costly hospital visits and, ultimately, mortality across a range of health issues. And by making it easier to stay home when sick, paid sick time reduces the instances of workers showing up to work while sick and spreading contagious viruses, such as influenza or COVID-19.
The primary purpose of paid sick time is to allow workers to address short-term medical needs without suffering economic hardship, including losing their job for taking off too much time, but the broad economic and public health benefits cannot be overlooked. Local paid sick-time laws, for example, reduce influenza-like infections by 30 percent to 40 percent. And amid the ongoing COVID-19 pandemic, sick leave is an essential tool for controlling communicable diseases and ensuring that workers are able to produce and transport goods and services and that consumers can purchase those goods and services—in other words, to ensuring that large parts of the U.S. economy can function normally.
The benefits of better health and economic security for workers are clear, but a happier and more productive workforce also benefits firms, too, making paid sick time a win-win policy for all involved. Paid sick leave is frequentlyfound to reduce costly presenteeism, when workers show up to work while sick, and resulting in productivity losses. And, rather than increasing rates of absenteeism—when employees call out of their regularly scheduled shifts—paid sick time can slow the spread of illness in a workplace an ultimately reduce infection-related absences, potentially saving U.S. employers billions of dollars.
U.S. workers with paid sick leave also experience fewer occupational injuries. This means workers can avoid potentially disastrous impacts on their well-being and economic security, which in turn can expose their employers to expensive liabilities.
The costs associated with a sick and dissatisfied workforce are high. In addition to absences and productivity losses, low job quality due to erratic work schedules and limited benefits that are currently experienced by U.S. railroad workers, can translate to expensive turnover, particularly in a tight labor market. And these costs pale in comparison to that of a drawn-out workers’ strike on a critical component of the nation’s supply chain.
The good news is that railroad companies can avoid this disaster with low-cost, high-reward paid sick time benefits. For the workers that kept the nation’s supply chain functioning during the uncertainty COVID-19 pandemic, such an investment makes good economic sense for all involved.
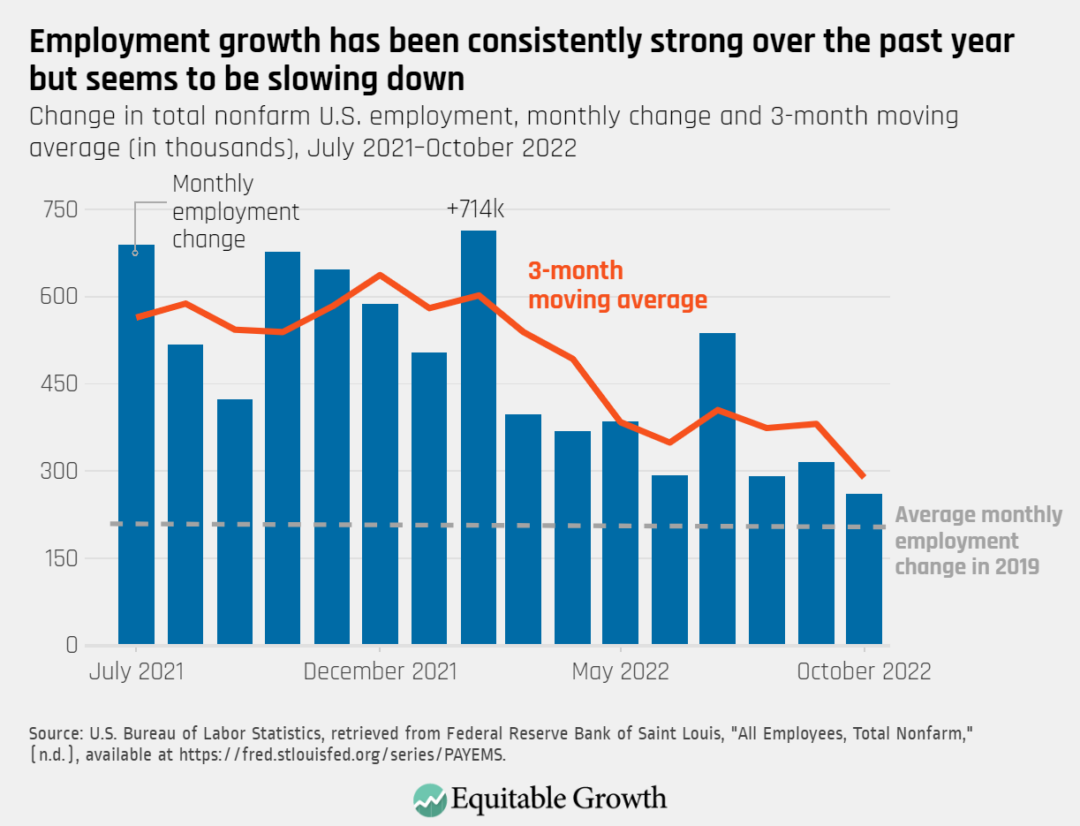
Ahead of the release of November’s Employment Situation Summary on December 2, an examination of the past few months of U.S. Bureau of Labor Statistics employment data shows some signs that the U.S. labor market is cooling down. After nonfarm payrolls recovered to pre-pandemic levels late in the summer—and as the U.S. Federal Reserve Bank continues increasing interest rates to cool the economy in an effort to manage inflation—employment growth, hires, and job openings are all now below their 2022 peaks and trending down, BLS data show.
One example of these dynamics at play is net monthly job gains. While employment growth remained strong as the U.S. economy added an average of 289,000 jobs in the 3 months of August, September, and October, these gains represent a substantial deceleration, compared to the previous 3-month moving average of 381,000 jobs added. (See Figure 1.)
Figure 1
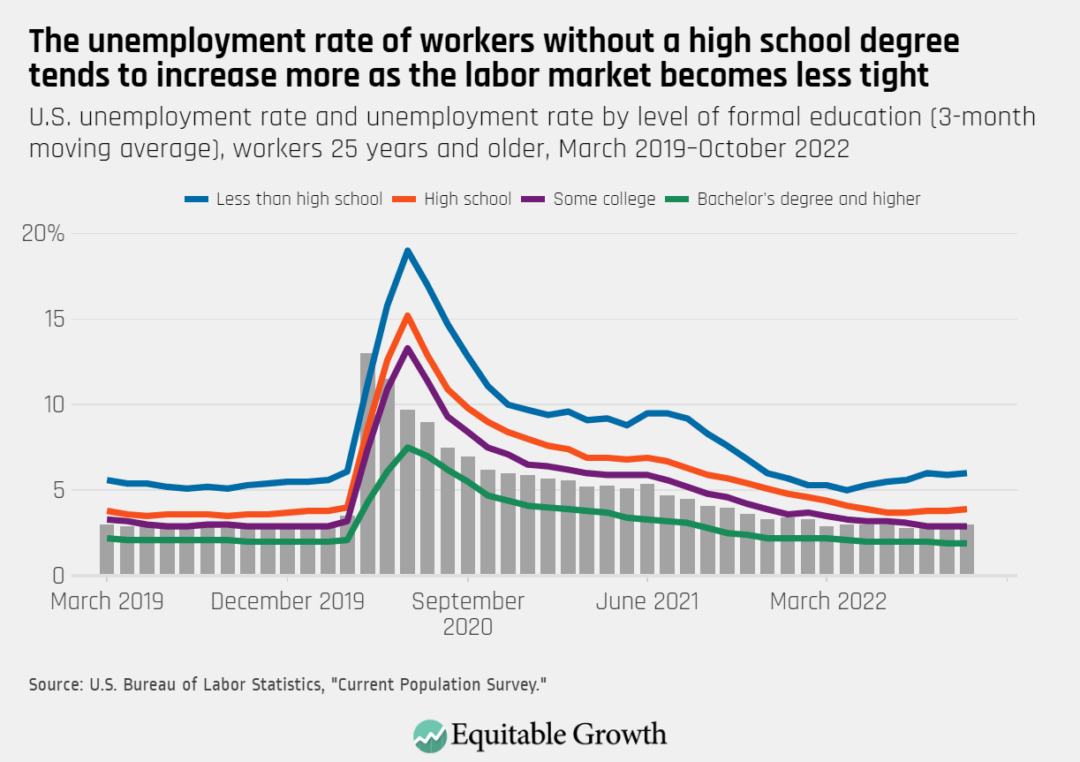
As the U.S. labor market loses steam, disparities faced by some vulnerable groups of workers remain—and may be reverting to previous unequal trends prior to the recent downturn. For instance, the employment-to-population ratio of workers between the ages of 20 and 24 who are not in school has dropped substantially since the beginning of the year. Workers with a high school degree or more are still experiencing historically low unemployment rates, but the joblessness rate of those without a high school diploma has been trending up since early 2022. That joblessness rate went from a series low of 4.3 percent in February 2022 to 6.3 percent in October—a rate that is about three times higher than the unemployment rate for workers with a bachelor’s degree or more. (See Figure 2.)
Figure 2
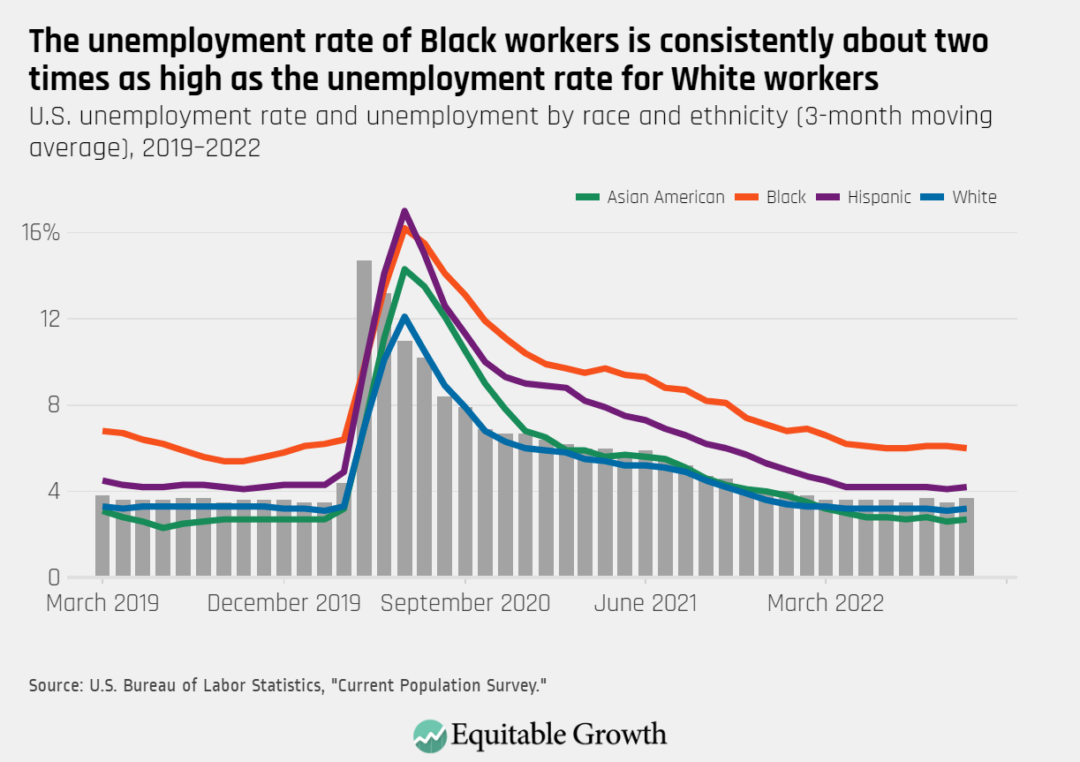
If these trends continue, a weaker U.S. labor market is also likely to be felt most by workers of color in general, and Black workers in particular—many of whom are especially exposed to joblessness because of the interplay of occupational segregation and discrimination in employment. The effects of discrimination and Black workers’ vulnerability across business cycles can also be seen in what researchers call the “first fired” phenomenon, in which Black workers are more likely to be laid off than their White counterparts—a finding that holds even when comparing workers of the same age, with the same level of formal education, and working in the same job and industry.
Data from the current economic recovery show the persistence of these structurally racist barriers, providing further evidence that market dynamics, such as business cycles, cannot fully account for or resolve the longstanding employment divides between Black and White workers. Not even the robust U.S. labor market of late 2021 and early 2022—a labor market some analysts called “red hot”—was enough to substantially narrow racial divides in economic outcomes. Throughout 2021 and 2020, for instance, the unemployment rate of Black workers consistently doubled the unemployment rate of their White counterparts. (See Figure 3.)
Figure 3
New data shed light on the experiences of Indigenous Americans and Native Hawaiians and Pacific Islanders during the COVID-19 recession and current recovery
In addition to releasing monthly data on the U.S. labor market outcomes of Asian American, Black, Latino, and White workers, earlier this year, the Bureau of Labor Statistics began publishing monthly data for two groups of workers: American Indians and Alaska Natives and Native Hawaiians and Pacific Islanders. These newly available data series are not seasonally adjusted, meaning that BLS has not performed statistical procedures to account for seasonal variations in the labor market, such as retailers’ hiring of temporary workers ahead of the December holiday season.
That these data are not seasonally adjusted and are composed of small sample sizes—American Indian and Alaska Native workers make up slightly less than 2 percent of the U.S. workforce, while about 0.5 percent of U.S. workers are Native Hawaiian or Pacific Islander workers—make month-to-month comparisons difficult, since the series are volatile and generally not statistically significant. Yet they still offer a timely snapshot of the experiences of these workers in the labor market, contributing to our understanding of how race and ethnicity shape the economic outcomes of U.S. workers.
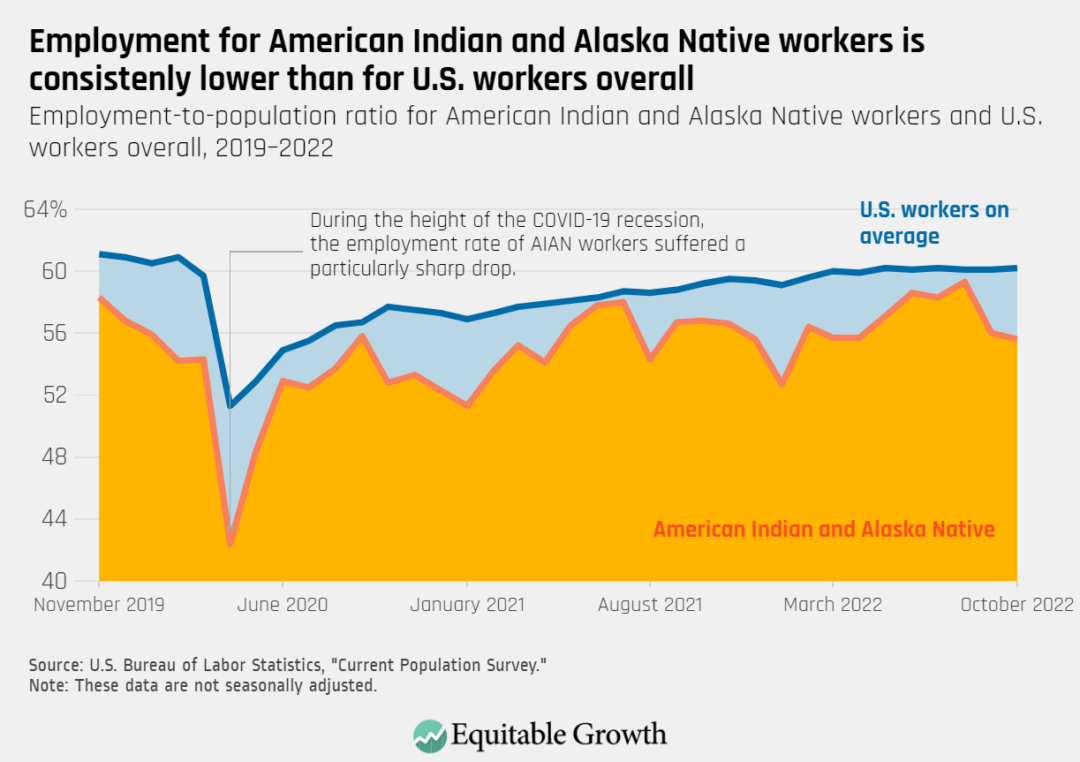
American Indian and Alaska Native workers
In the case of American Indian and Alaska Native workers, the data series show that this group faced particularly sharp economic pain due to the COVID-19 recession, suffering a massive increase in unemployment and a commensurate drop in employment as the pandemic hit service-providing industries especially hard.
In April 2020—the height of the recession—the American Indian and Alaska Native employment-to-population ratio dropped to 42.4 percent, an almost 15 percentage point fall compared to April of the previous year. While the aggregate U.S. employment rate also fell, the decline was much more moderate for the country’s overall workforce. (See Figure 4.)
Figure 4
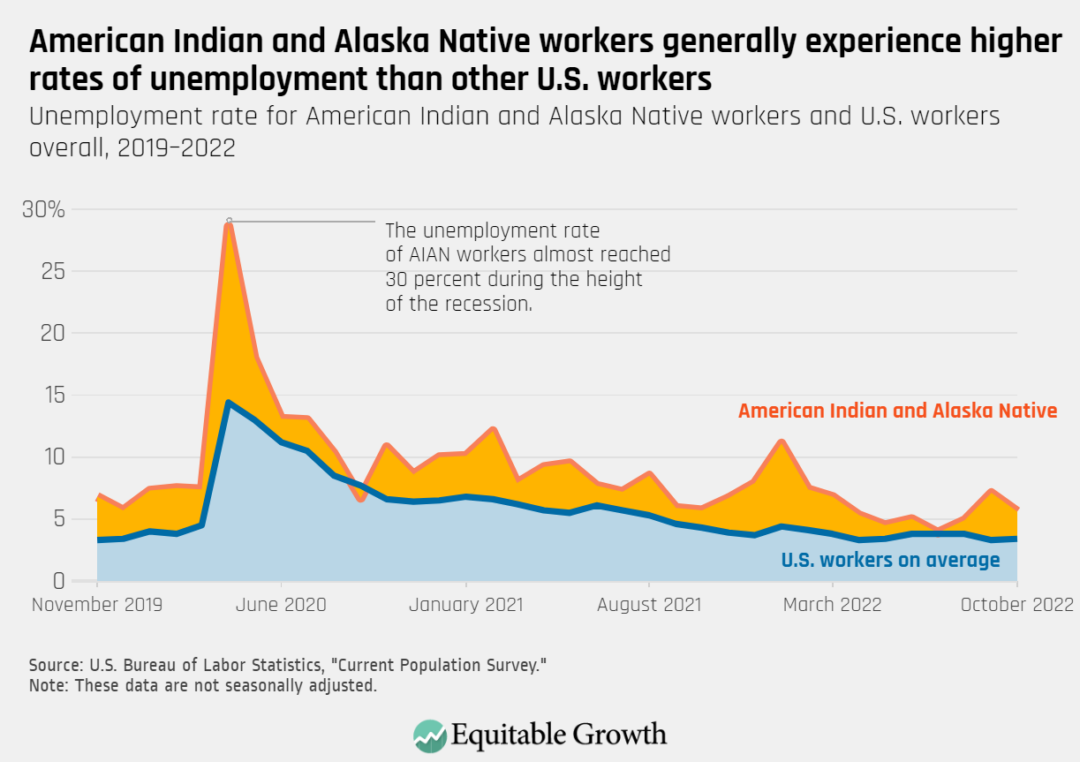
At the same time, the unemployment rate of AIAN workers reached a recession high of more than 28 percent, a rate that was more than double the national unemployment rate at the height of the recession. (See Figure 5.)
Figure 5
But American Indian and Alaska Native workers faced barriers in the U.S. labor market long before the onset of the pandemic. Research by Equitable Growth grantee Blythe George (now an assistant professor at the University of California, Merced) finds that the decline of industries that have been important sources of employment for certain tribal communities led to weak labor force attachment for male workers there. Research on Native American women in the labor market is limited and more data are needed, but existing empirical findings demonstrates that the intersection of gender for this marginalized group creates further barriers and has resulted in stagnant wage growth, compared to those facing fewer intersecting barriers.
Structural barriers also shape the experiences of Indigenous American workers amid the ongoing pandemic and economic recovery. A recent analysis by Matthew Gregg, senior economist at the Federal Reserve Bank of Minneapolis, and Robert Maxim, senior research associate at The Brookings Institution, explains that while the unemployment rate for Native American workers has improved, these workers still have lower access to remote work. This is probably due to occupational differences, infrastructure issues in housing and broadband access, discrimination, and other factors.
The Bureau of Labor Statistics began separately reporting monthly data on American Indian and Alaska Native unemployment earlier this year, but more comprehensive and granular data are needed to fully understand the current employment situation for these workers to inform future policy. In addition to improving data collection, Randall Akee, a senior economist at the Council of Economic Advisers (on leave from the University of California, Los Angeles) and an Equitable Growth grantee, has written about the importance of supporting tribal sovereignty and industry innovation, as well as reducing barriers to economic development, in order to improve economic and labor conditions of American Indian workers and their families.
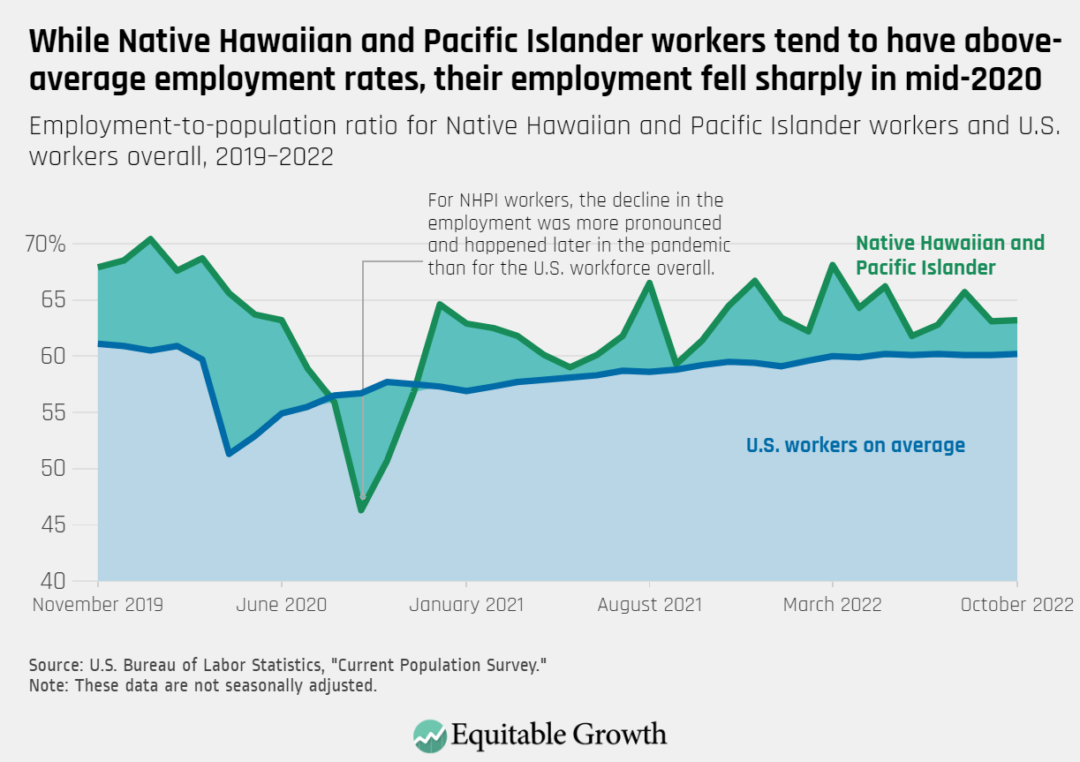
Native Hawaiian and Pacific Islander workers
Native Hawaiian and Pacific Islander workers, BLS data show, generally experience higher employment rates and similar unemployment rates as U.S. workers on average. Part of the reason is that this group of workers is more likely to be between the ages of 25 and 54, the range that economists consider to be the “prime-age” working population. In mid-2020, however, Native Hawaiian and Pacific Islander workers experienced a deeper—and later—decline in employment than U.S. workers overall. (See Figure 6.)
Figure 6
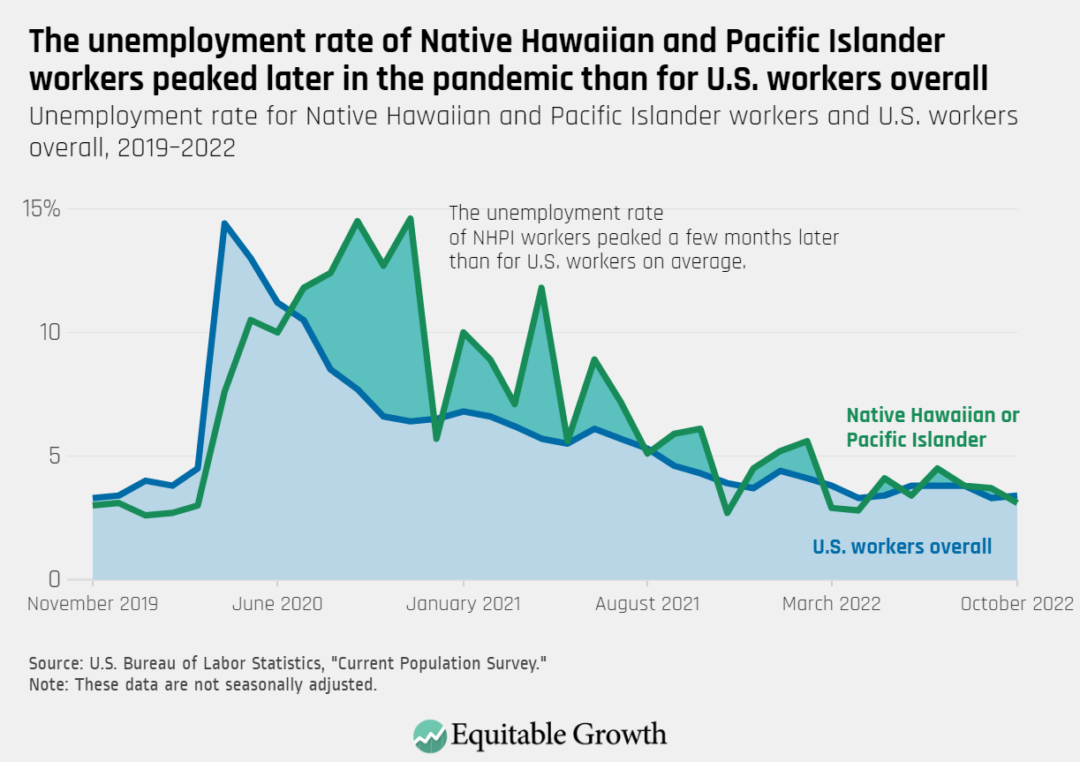
The NHPI unemployment rate saw a similar increase as the national unemployment rate. Like the decline in employment, however, these workers experienced the highest joblessness rate in the fall of 2020, rather than in the spring of that year. (See Figure 7.)
Figure 7
What explains this lag? Research by Julie Cai at the Center for Economic Policy Research finds that in 2021 and early 2022, Asian American workers and NHPI workers were less likely than other groups of workers to find a job if they became unemployed. This lower probability of reemployment held, Cai finds, even when accounting for levels of formal education, state of residence, and age, and was especially true for Asian American and NHPI women.
There is not much empirical evidence yet on what drove these lower unemployment-to-employment transition rates, but recent data do show that the pandemic affected service-providing occupations in which NHPI workers are overrepresented, which likely played a role. In addition, there is evidence that the surge in discrimination against Asian American communities and NHPI communities hurt the economic outcomes of these workers and business owners.
Determining fiscal and monetary policies in a ‘tight’ labor market that is now also cooling
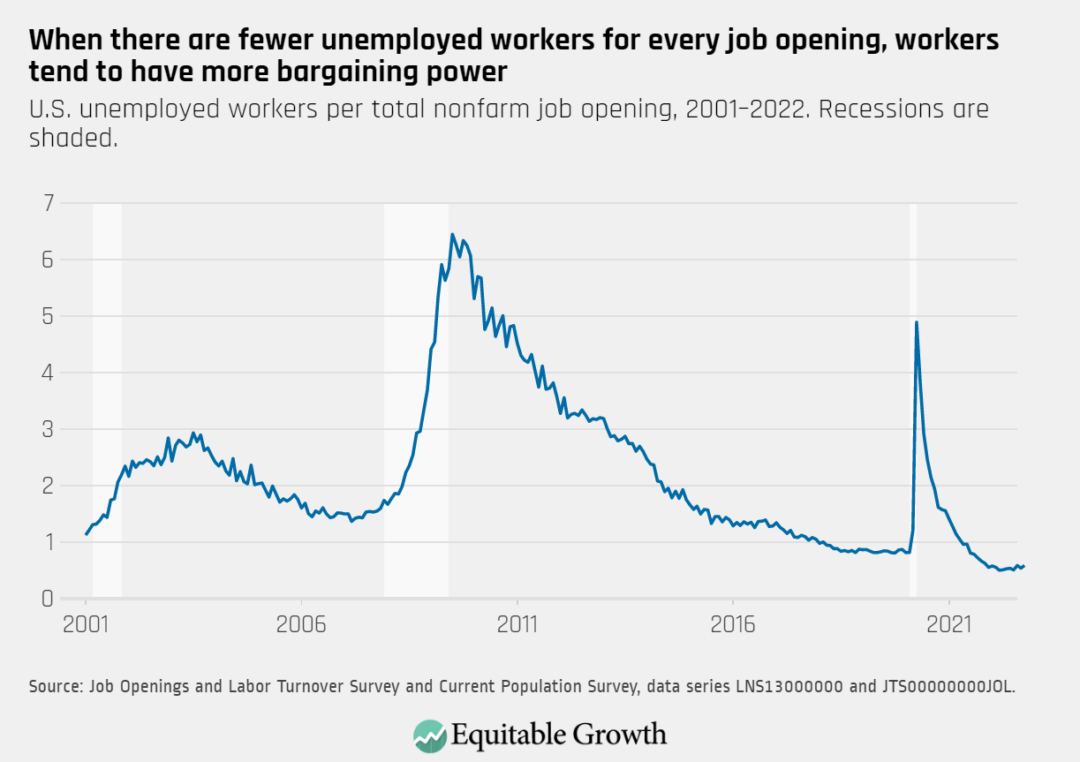
Broadly, a tight labor market is one in which demand for workers is strong, most people who can and want to work are able to find a job, and workers are in a good position to bargain for better wages. One important metric that economists use to determine the degree of “tightness” or “slack” in the labor market is the ratio of unemployed workers per job opening. In a hot or tight labor market, there will be few unemployed workers for every job vacancy. Conversely, when there is a lot of slack or the labor market is loose, there are many unemployed workers for every job opening.
By this metric, the labor market is currently extremely tight. During the height of the recession, there were about five unemployed workers for every job opening. In the past year or so, however, there have been about two job openings for every unemployed worker. (See Figure 8.)
Figure 8
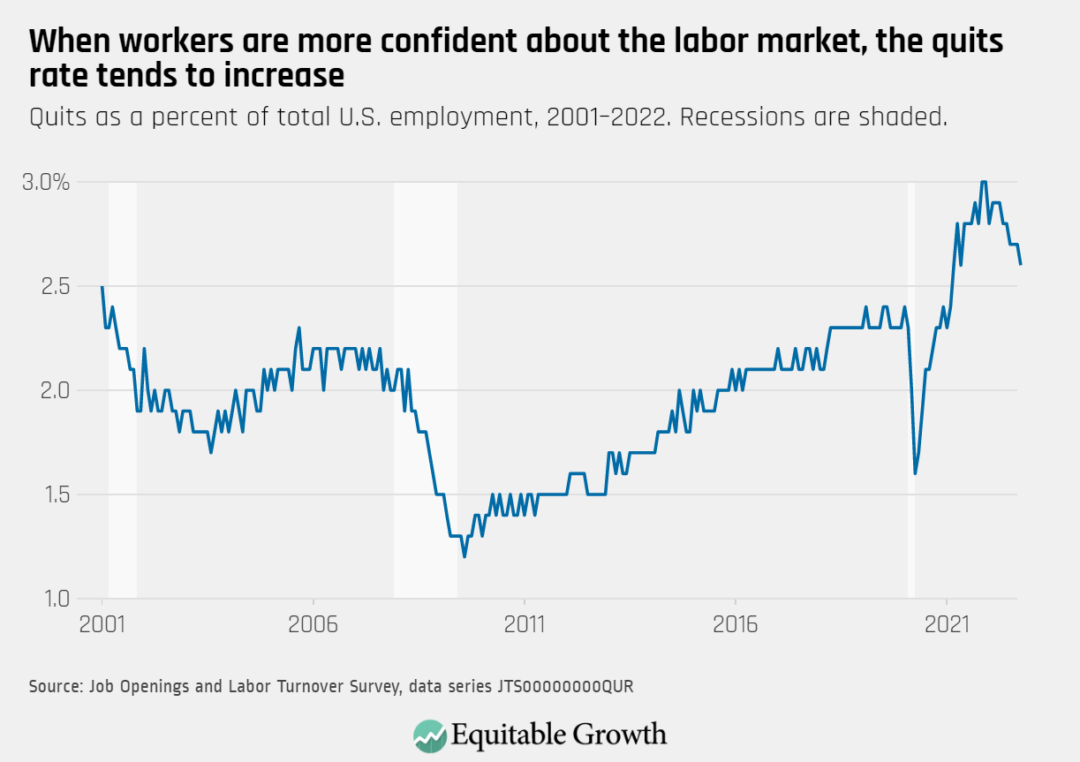
But there are other ways to measure labor market tightness. The unemployment rate, wage growth, and the share of workers who quit their jobs in a given month also capture information on the degree to which employers are looking and competing for workers.
In addition, research by Katherine Abraham, John Haltiwanger, and Lea Rendell at the University of Maryland, College Park proposes that the standard measures of labor market tightness can fail to accurately capture how difficult it is for workers to get a job and for employers to hire workers. This is because economists and policymakers alike do not normally account for job switchers, for workers who are not actively participating in the labor force, and for the effort employers are making to hire workers.
Abraham, Haltiwanger, and Rendell propose that during economic downturns, the intensity with which firms hire workers declines since there is a larger pool of both employed and unemployed workers competing for job opportunities. During booms, firms have to ramp up their efforts to hire by paying higher wages, offering more or better benefits, lowering the amount of experience or educational attainment required of candidates, or investing in their recruitment processes.
Currently, there is some evidence that U.S. employers’ hiring intensity is declining. Not only is wage and employment growth tempering, but less traditional indicators suggest that businesses are having an easier time filling their job openings, too. LinkedIn data show, for instance, that firms’ willingness to offer remote positions is lower now than it was early in 2022, when about 20 percent of job listings offered remote work. As such, even though 50 percent of all job applications went to remote positions, as of October of this year, only 15 percent of all job postings offered remote work.
An analysis by Burning Glass Institute, a think tank that advances research on the future of workers, is equally telling. It shows that while the share of job postings that require a bachelor’s degree declined substantially in 2020—evidence that employers are willing to ask for fewer credentials in order to fill their open positions—in 2022, this number started to increase again.
A cooling labor market means policymakers should consider how that affects different groups of workers and boost institutional support for worker power for a robust recovery
It is important for policymakers to understand the causes and consequences of persistent disparities by race, ethnicity, and gender within the context of relative labor market tightness. As the Federal Reserve Board of Governor’s Federal Open Market Committee continues to address elevated inflation with monetary policy and other policymakers reinforce these efforts through fiscal policy, the data discussed above demonstrate that an economic expansion is not sufficient to ensure convergence in labor market outcomes across groups of U.S. workers.
Furthermore, there is limited evidence that wage gains are a significant cause of current inflation. Designing economic policy for the current moment without attention to these details risks further entrenching disparities that limit U.S. economic growth by holding back the potential and economic security of groups with lower levels of educational attainment and those that have been historically marginalized and excluded from economic opportunities due to structural racism and sexism.
Though wages have been rising for workers at the bottom of the wage distribution, and many gaps narrowed during the rapid labor market recovery, the policies and institutions that fostered the rapid rise in economic inequality over the past four decades remain without a sufficient countervailing force. Inequality continues to be a drag on U.S. economic growth.
As monthly gains in the U.S. labor market naturally temper over the coming months, fundamental policies to improve worker outcomes are still lacking, including a sufficient minimum wage, the ability to unionize workplaces, and protection against discrimination. Workers of color remain vulnerable to outsized impacts from future downturns—perhaps even more so now, after the stresses of the pandemic, including family health shocks and caregiving needs, and a higher likelihood of job displacement and unemployment scarring.
The upshot? A focus on topline labor market indicators by policymakers from the Monthly Jobs Report as part of the effort to mitigate inflation will ultimately reduce the effectiveness of economic policy tools that foster robust and inclusive U.S. economic growth. Understanding the disaggregated nuances of the U.S. labor market is key to effective monetary and fiscal policymaking.
Every month the U.S. Bureau of Labor Statistics releases data on hiring, firing, and other labor market flows from the Job Openings and Labor Turnover Survey, better known as JOLTS. Today, the BLS released the latest data for October 2022. This report doesn’t get as much attention as the monthly Employment Situation Report, but it contains useful information about the state of the U.S. labor market. Below are a few key graphs using data from the report.
Around 4 million workers quit their jobs in October, similar to the previous month, and the quits rate declined to 2.6 percent for the first time since May 2021.
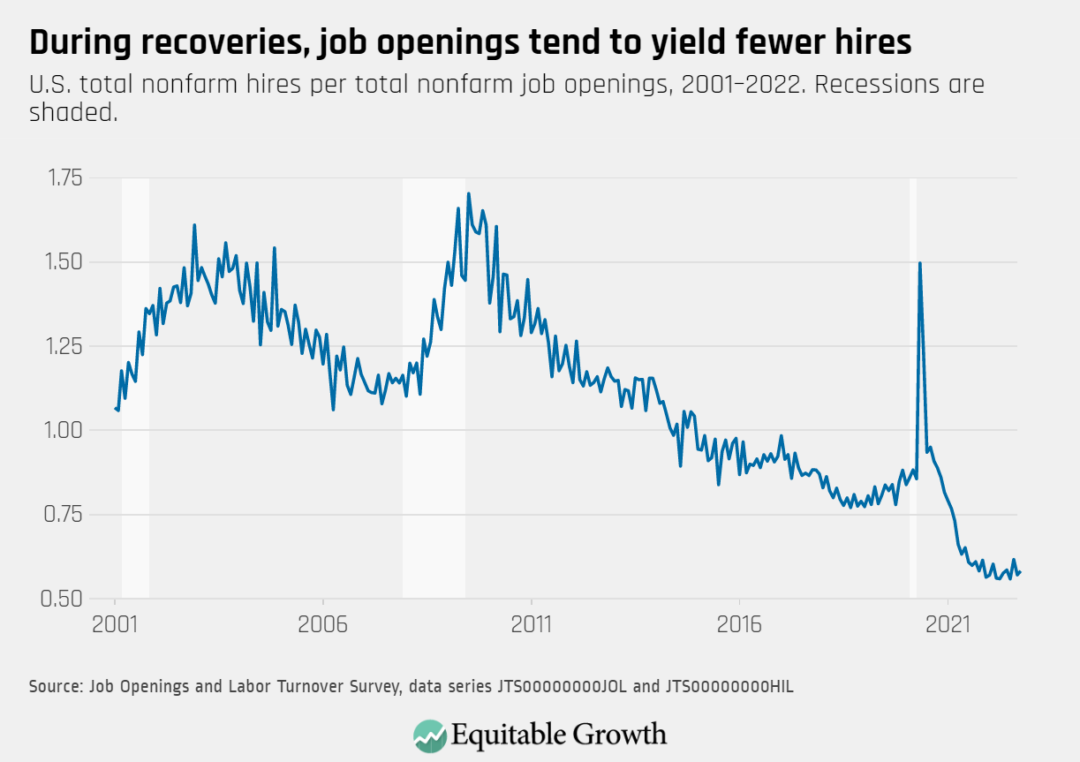
The vacancy yield increased to 0.58 in October from 0.57 in September as the number of reported job openings declined to 10.3 million while hires remained relatively constant at 6.0 million.
The ratio of unemployed workers to job openings increased to almost 0.59 in October from just under 0.54 in September.
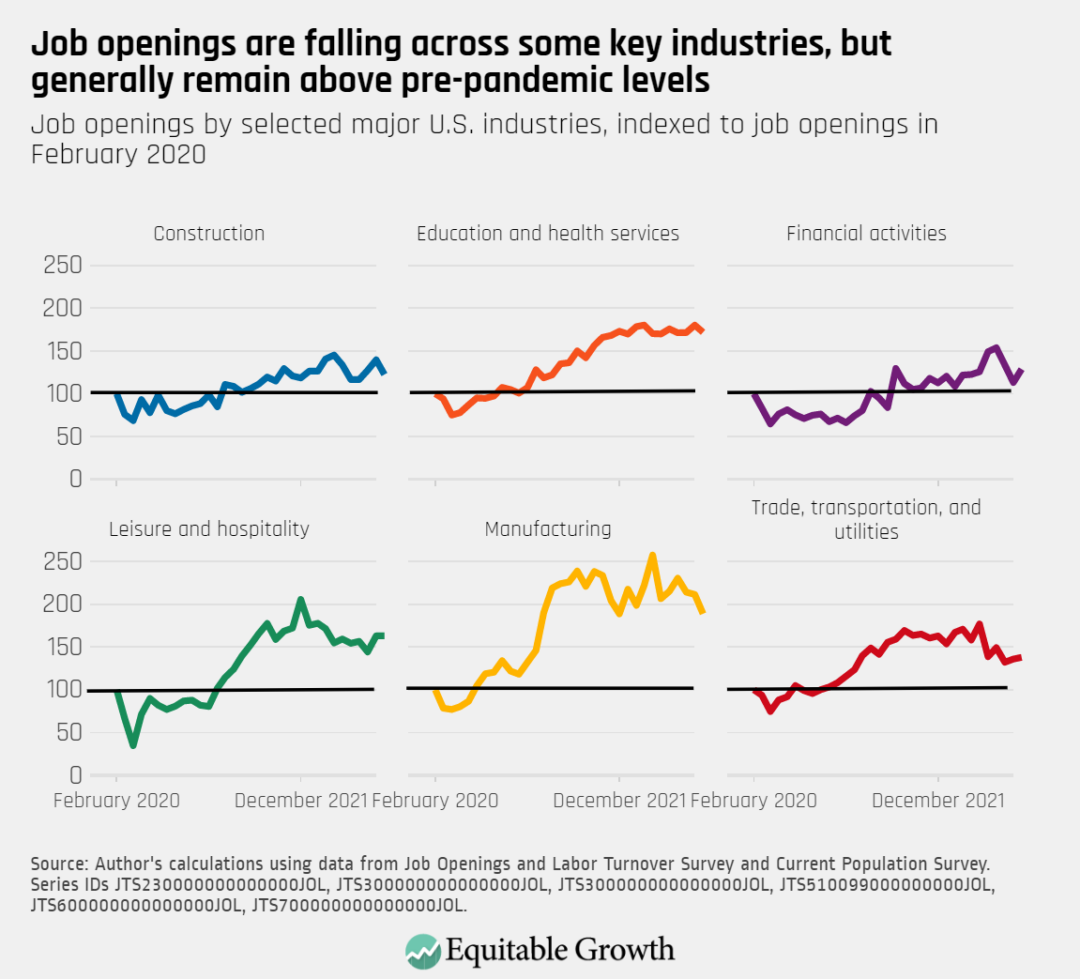
Job openings ticked down but remain elevated in industries such as education and health services and in manufacturing, and remained steady in leisure and hospitality.
Equitable Growth is committed to building a community of scholars working to understand howinequality affects broadly shared growth and stability. To that end, we have created the series “Expert Focus.” This series highlights scholars in the Equitable Growth network and beyond who are at the frontier of social science research. We encourage you to learn more about both the researchers featured below and our broader network of experts.
Since the onset of the COVID-19 pandemic, millions of workers have transitioned to remote work or telework, vastly increasing their use of certain technologies and software as a result. Digital technologies, while enabling this switch to home offices, are a double-edged sword, often coming with increased employer monitoring of workers and their activities.
Yet workplace surveillance is nothing new and was becoming more rampant across sectors of the U.S. economy before the COVID-19 crisis. This increasing use of technology to monitor and control workers has widespread implications for worker power, protections, and well-being.
This month’s Expert Focus highlights leaders in the field of the future of work who are examining technology’s impact on workers and the U.S. economy. These researchers are seeking to clarify how workers are affected by various forms of monitoring and algorithmic management, how technology shapes new forms of work such as the gig economy, the impacts of Big Tech companies and their innovations on the workplace, and how to protect workers and ensure worker power in the age of digital technologies.
Much is still unknown about how employers use technology and its effects on workers, and how employers’ use of technology for monitoring and management will continue to affect the U.S. workforce in the future. That’s why Equitable Growth’s 2023 Request for Proposals seeks to fund projects looking into technology and the workplace, including studies examining how employers’ use of technology affects work and workers in areas of hiring, work conditions, scheduling, and more; how employer decisions around automation, algorithms, and other technologies will impact workers, wages, and labor markets; the role of policy and labor market institutions in shaping these outcomes; and whether there are disparate effects on different demographic groups of workers and protected classes.
Annette Bernhardt is the director of the Technology and Work Program in the University of California, Berkeley’s Labor Center and a senior researcher at Berkeley’s Institute for Research on Labor and Employment. She is a leading labor market scholar in the areas of low-wage work and the future of work and workers, with a focus on the impact of new technologies, the minimum wage and other labor standards, the gig economy, and enforcement of employment and labor laws. One of her recent reports, co-authored by colleagues Lisa Kresge and Reem Suleiman, looks at how employers are increasing their use of data and algorithms in ways that impact workers, wages, working conditions, and racial and gender equity, and then proposes policies that ensure worker technology rights. As an expert in these areas, Bernhardt also helped to develop and analyze innovative policy responses to the changing nature of work in the United States.
Peter Cappelli
University of Pennsylvania
Peter Cappelli is the George W. Taylor Professor of Management at the University of Pennsylvania’s Wharton School of Business and the director of Wharton’s Center for Human Resources. His research focuses on human resource practices, public policy related to employment, and talent and performance management. His research on contract-based workers and the future of work looks at employer-employee relationships and workplace structures. He also examines the impact of the COVID-19 pandemic and remote work—including the technology that enables it—on professional outcomes and opportunities. Cappelli’s 2021 book, The Future of the Office: Work from Home, Remote Work, and the Hard Choices We All Face, looks at these issues in more detail and puts them in the context of broader labor market trends and changes.
Timnit Gebru
Distributed Artificial Intelligence Research Institute
Timnit Gebru is the founder of the Distributed Artificial Intelligence Research Institute. She has spent much of her career working in technology and artificial intelligence and is widely recognized as an expert in AI research and ethics. Gebru is an strong advocate for diversity in tech and is the co-founder of Black in AI, a nonprofit that aims to increase the presence and foster the inclusion of Black people in artificial intelligence. In 2018, her co-authored study on racial and gender biases in facial recognition software led Microsoft Corp., her employer at the time, and IBM Corp. to diversify the datasets that inform their facial recognition algorithms. A recent co-authored paper lays out a “doctrine of universal human rights” to serve as a guiding framework for responsible artificial intelligence, centering humans and the risks to their rights—from the right to freedom from discrimination to the right to share in scientific advancement—in the research around AI and ethics.
Karen Levy
Cornell University
Karen Levy is an associate professor in the Department of Information Science at Cornell University. Her research centers on how law and technology interact to regulate and control social life, with a particular focus on surveillance and contexts that are marked by inequality. One of her main areas of interest is the impact of data-intensive technologies and monitoring on work and workers. Levy’s upcoming book, Data Driven: Truckers, Technology, and the New Workplace Surveillance, looks at how new forms of digital surveillance and automation are affecting long-haul truckers in the United States and upending their lives and work on the road. A co-authored chapter in The Oxford Handbook of Ethics of AI of 2020 looks at how technology and artificial intelligence will affect workers in ways other than displacing them—including employers using technology to shift risks from themselves to workers—in the workforce and offers some policy responses.
Peter Norlander
Loyola University Chicago
Peter Norlander is an associate professor of management and the director of the master’s degree program in human resources and employment relations at Loyola University Chicago Quinlan School of Business. His research examines the balance of power in employment relationships, discrimination against certain groups of workers, and the future of work—including gig work, outsourcing, and remote work. Recently, Norlander has written about guest worker visa programs and their impacts on workers and firms, stigmatization against unemployed workers amid the COVID-19 pandemic and the 2020 recession, and the effects of digital surveillance tools in the gig economy. His latest working paper on predictors of remote work opportunities before and after the pandemic finds that firms play a key role in deciding if a job is remote, and that workers who are unionized, professionally licensed, or federal government employees were more likely to have remote opportunities before the pandemic.
Meredith Whittaker
Signal Foundation
Meredith Whittaker is the president of the Signal Foundation, a nonprofit organization that runs the ultra-private encrypted messaging app Signal. She previously served as a senior advisor on artificial intelligence to Chair Lina Khan of the U.S. Federal Trade Commission and was the Minderoo research professor at New York University, where her research focused on AI policy and the state of AI, and surveillance business practices. In her 17 years of experience, she has become known as a fierce critic of tech companies, their harmful business practices, and the impacts on workers. She is an advocate for including those who are most impacted by technology and surveillance in decisions about when and whether to share their data. Whittaker has testified before the U.S. Congress on various aspects of technology, including ethical implications of AI and the transparency and accuracy of facial recognition.
Equitable Growth is building a network of experts across disciplines and at various stages in their career who can exchange ideas and ensure that research on inequality and broadly shared growth is relevant, accessible, and informative to both the policymaking process and future research agendas. Explore the ways you can connect with our network or take advantage of the support we offer here.