Equitable Growth’s Jobs Day Graphs: October 2022 Report Edition
On November 4, the U.S. Bureau of Labor Statistics released new data on the U.S. labor market during the month of October. Below are five graphs compiled by Equitable Growth staff highlighting important trends in the data.
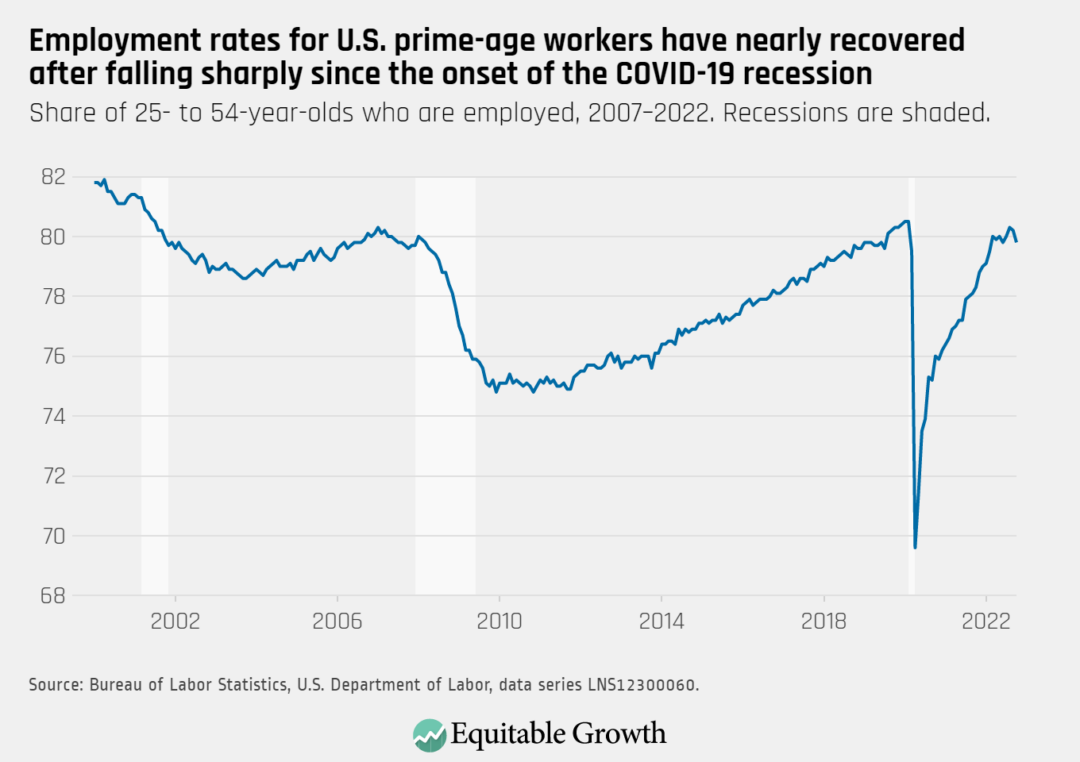
Job growth declined in October, with the prime-age employment rate falling to 79.8 percent and below 80 percent for the first time since June.
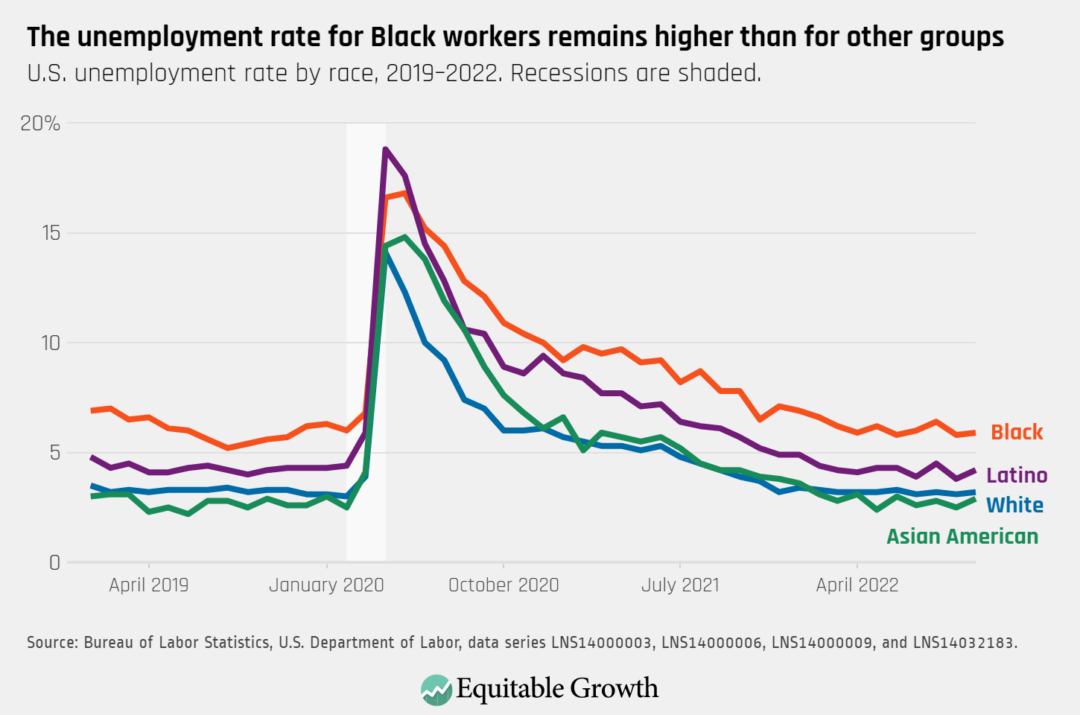
The unemployment rate increased for almost all major demographic groups, with the biggest increases for women and Hispanic workers.
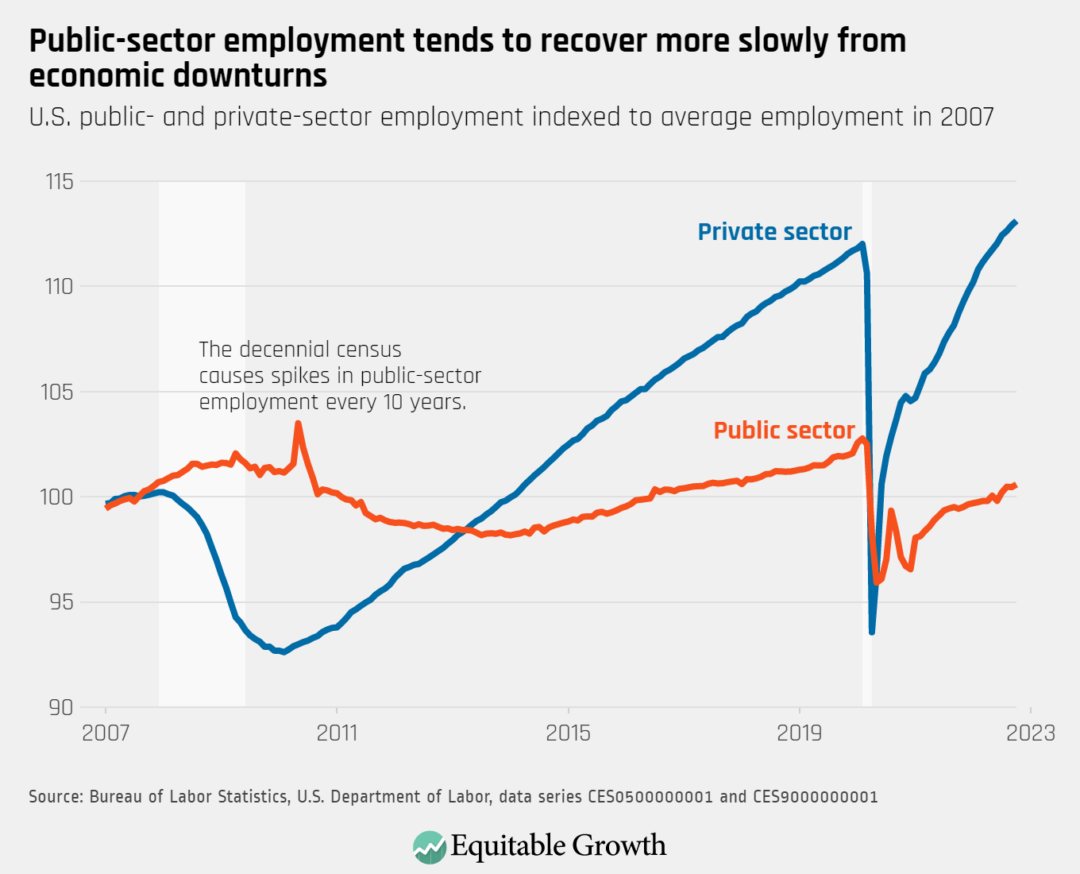
Public sector employment still lags in the recovery, with private sector employment above its pre-pandemic levels.
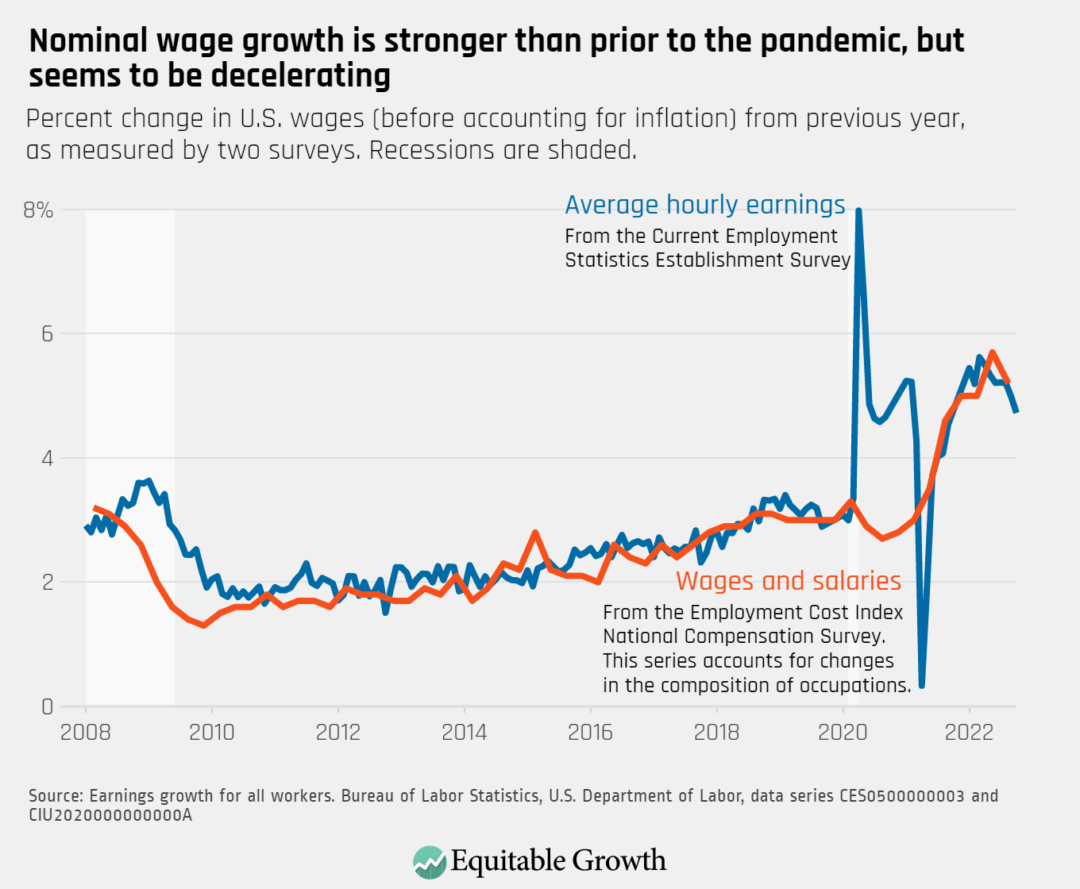
Wage growth decelerated in October, further demonstrating a lack of evidence that wage pressure is a primary cause of continuing inflation
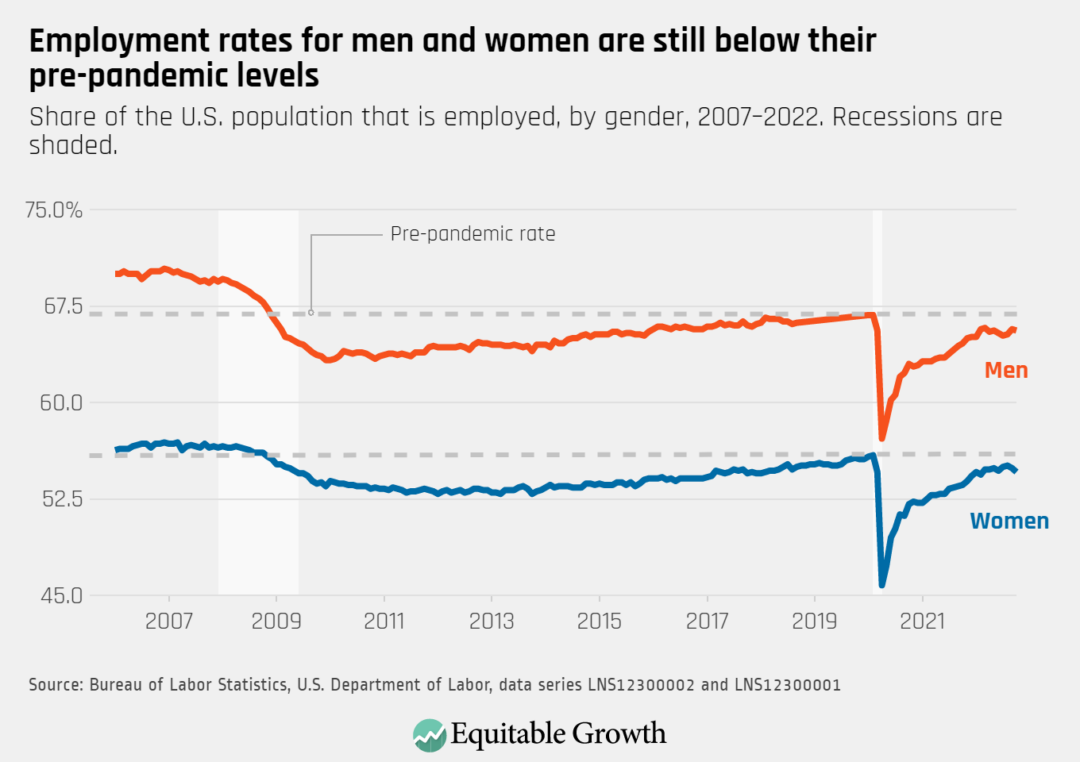
Employment rates decreased for women and men in October, but slightly more so for women as unemployment levels increased and almost 200,000 dropped out of the labor force.