Equitable Growth’s Jobs Day Graphs: September 2022 Report Edition
On October 7, the U.S. Bureau of Labor Statistics released new data on the U.S. labor market during the month of September. Below are five graphs compiled by Equitable Growth staff highlighting important trends in the data.
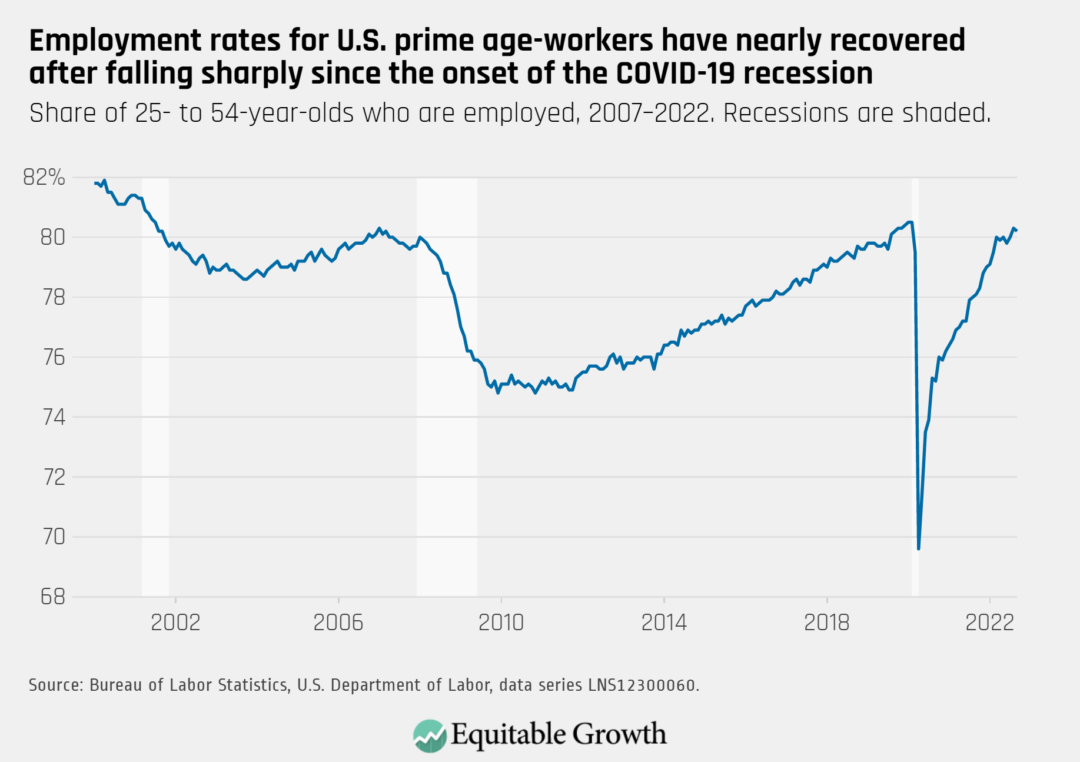
The employment rate for prime-age workers declined to 80.2 percent in September 2022 from 80.3 percent in August, with total nonfarm employment rising by 263,000.
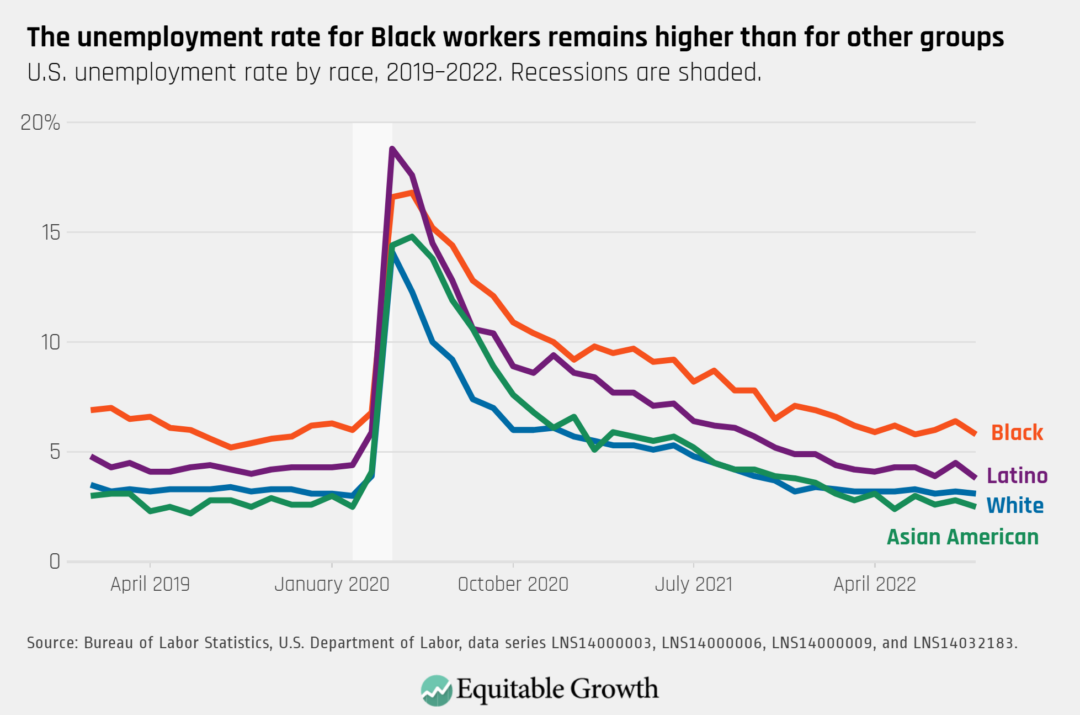
The unemployment rate decreased to 3.5 percent in September and remains higher for Black workers (5.8 percent) and Latino workers (3.8 percent), compared to White workers (3.1 percent) and Asian American workers (2.5 percent).
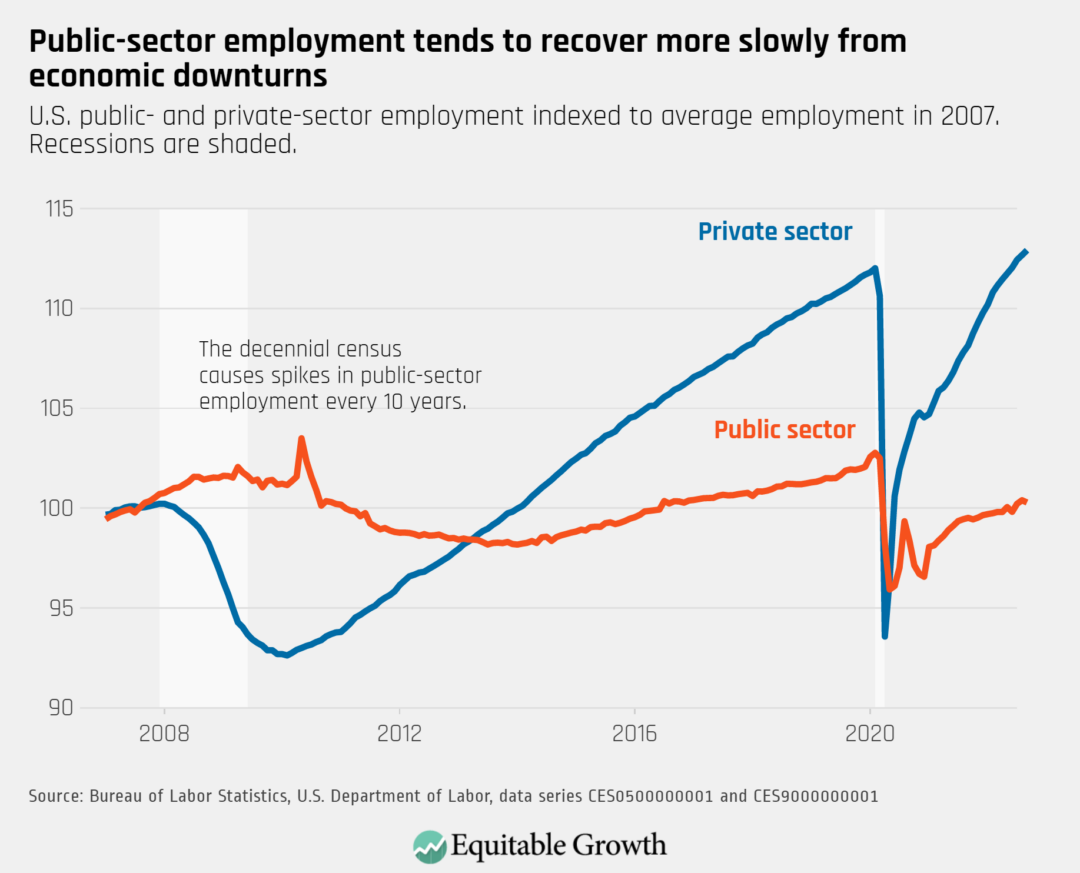
Private-sector employment continued to rise in September, while public-sector employment declined slightly and remains below pre-pandemic levels.
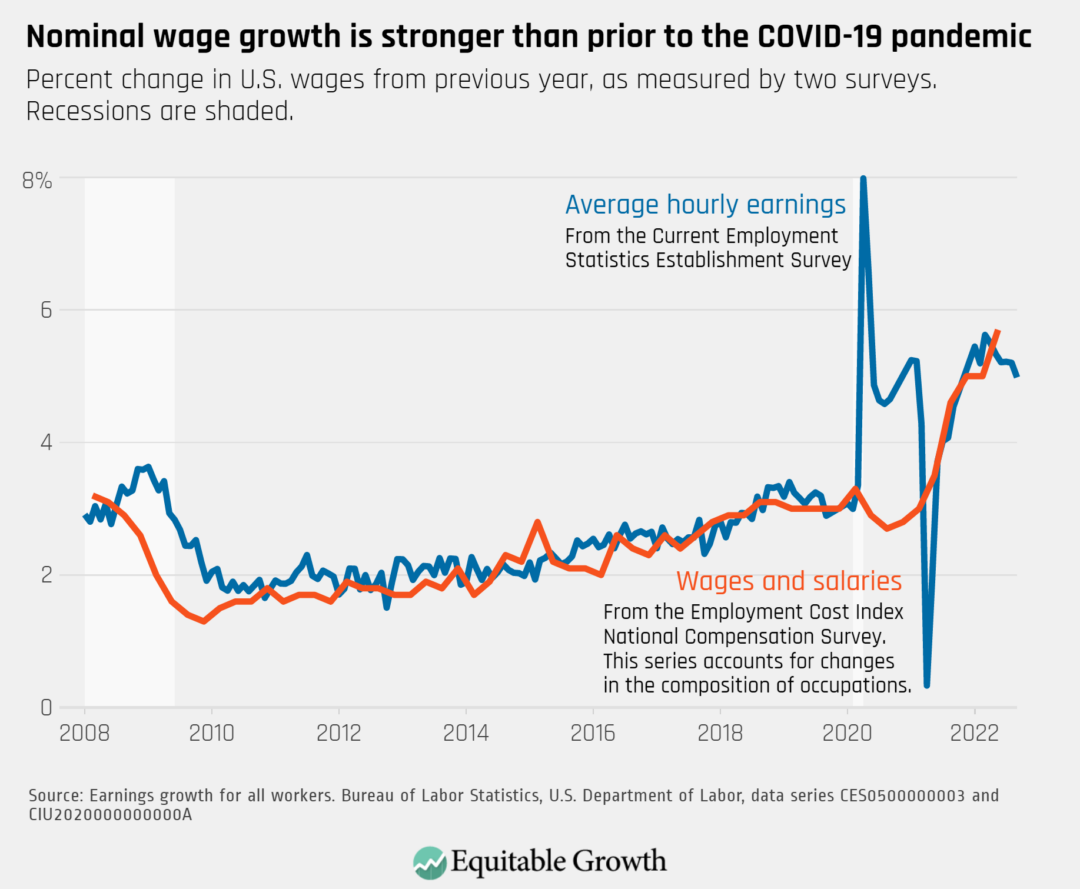
Nominal wage growth (not accounting for inflation) cooled in September, with average hourly earnings growth at 5 percent over the past 12 months.
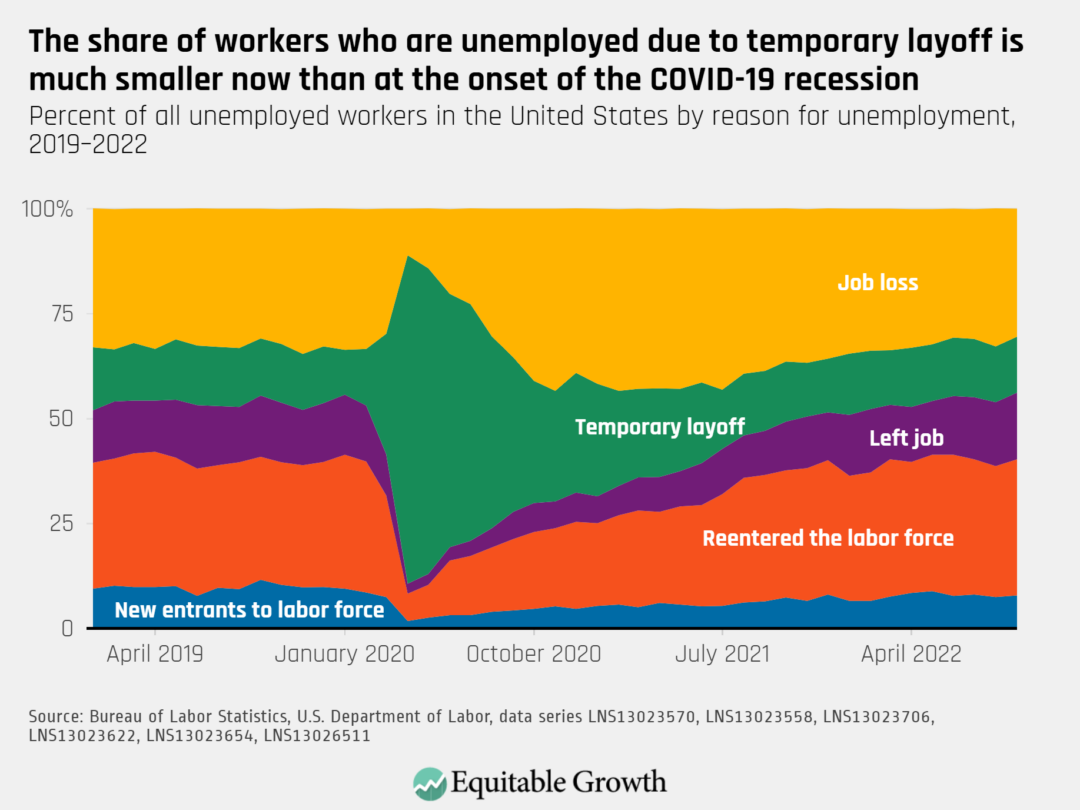
The number of unemployed workers decreased in September. The share who are unemployed due to job loss fell to 30.5 percent, and 13.3 percent have been temporarily laid off; 15.9 percent left their jobs, 32.4 percent are re-entering the labor force, and 7.9 percent are new entrants.