“Competition’s Role in Controlling Prescription Drug Prices”
Michael Kades
Director, Markets and Competition Policy
Washington Center for Equitable Growth
Testimony Before the
Subcommittee on Antitrust, Commercial, and Administrative Law
“Diagnosing the Problem: Exploring the Effects of Consolidation and Anticompetitive Conduct in Health Care Markets”
Thank you Chairman Cicilline, Ranking Member Sensenbrenner, full committee Chairman Nadler and full committee Ranking Member Collins for the honor of testifying before this Subcommittee on competition and prescription drug prices.
My name is Michael Kades, director of Markets and Competition Policy at the Washington Center for Equitable Growth. We seek to advance evidence-backed ideas and policies that promote strong, stable, and broad-based economic growth. Anticompetitive conduct in prescription drugs is emblematic of the kind of inequality that is at the core of the most important challenges facing our economy and our nation.
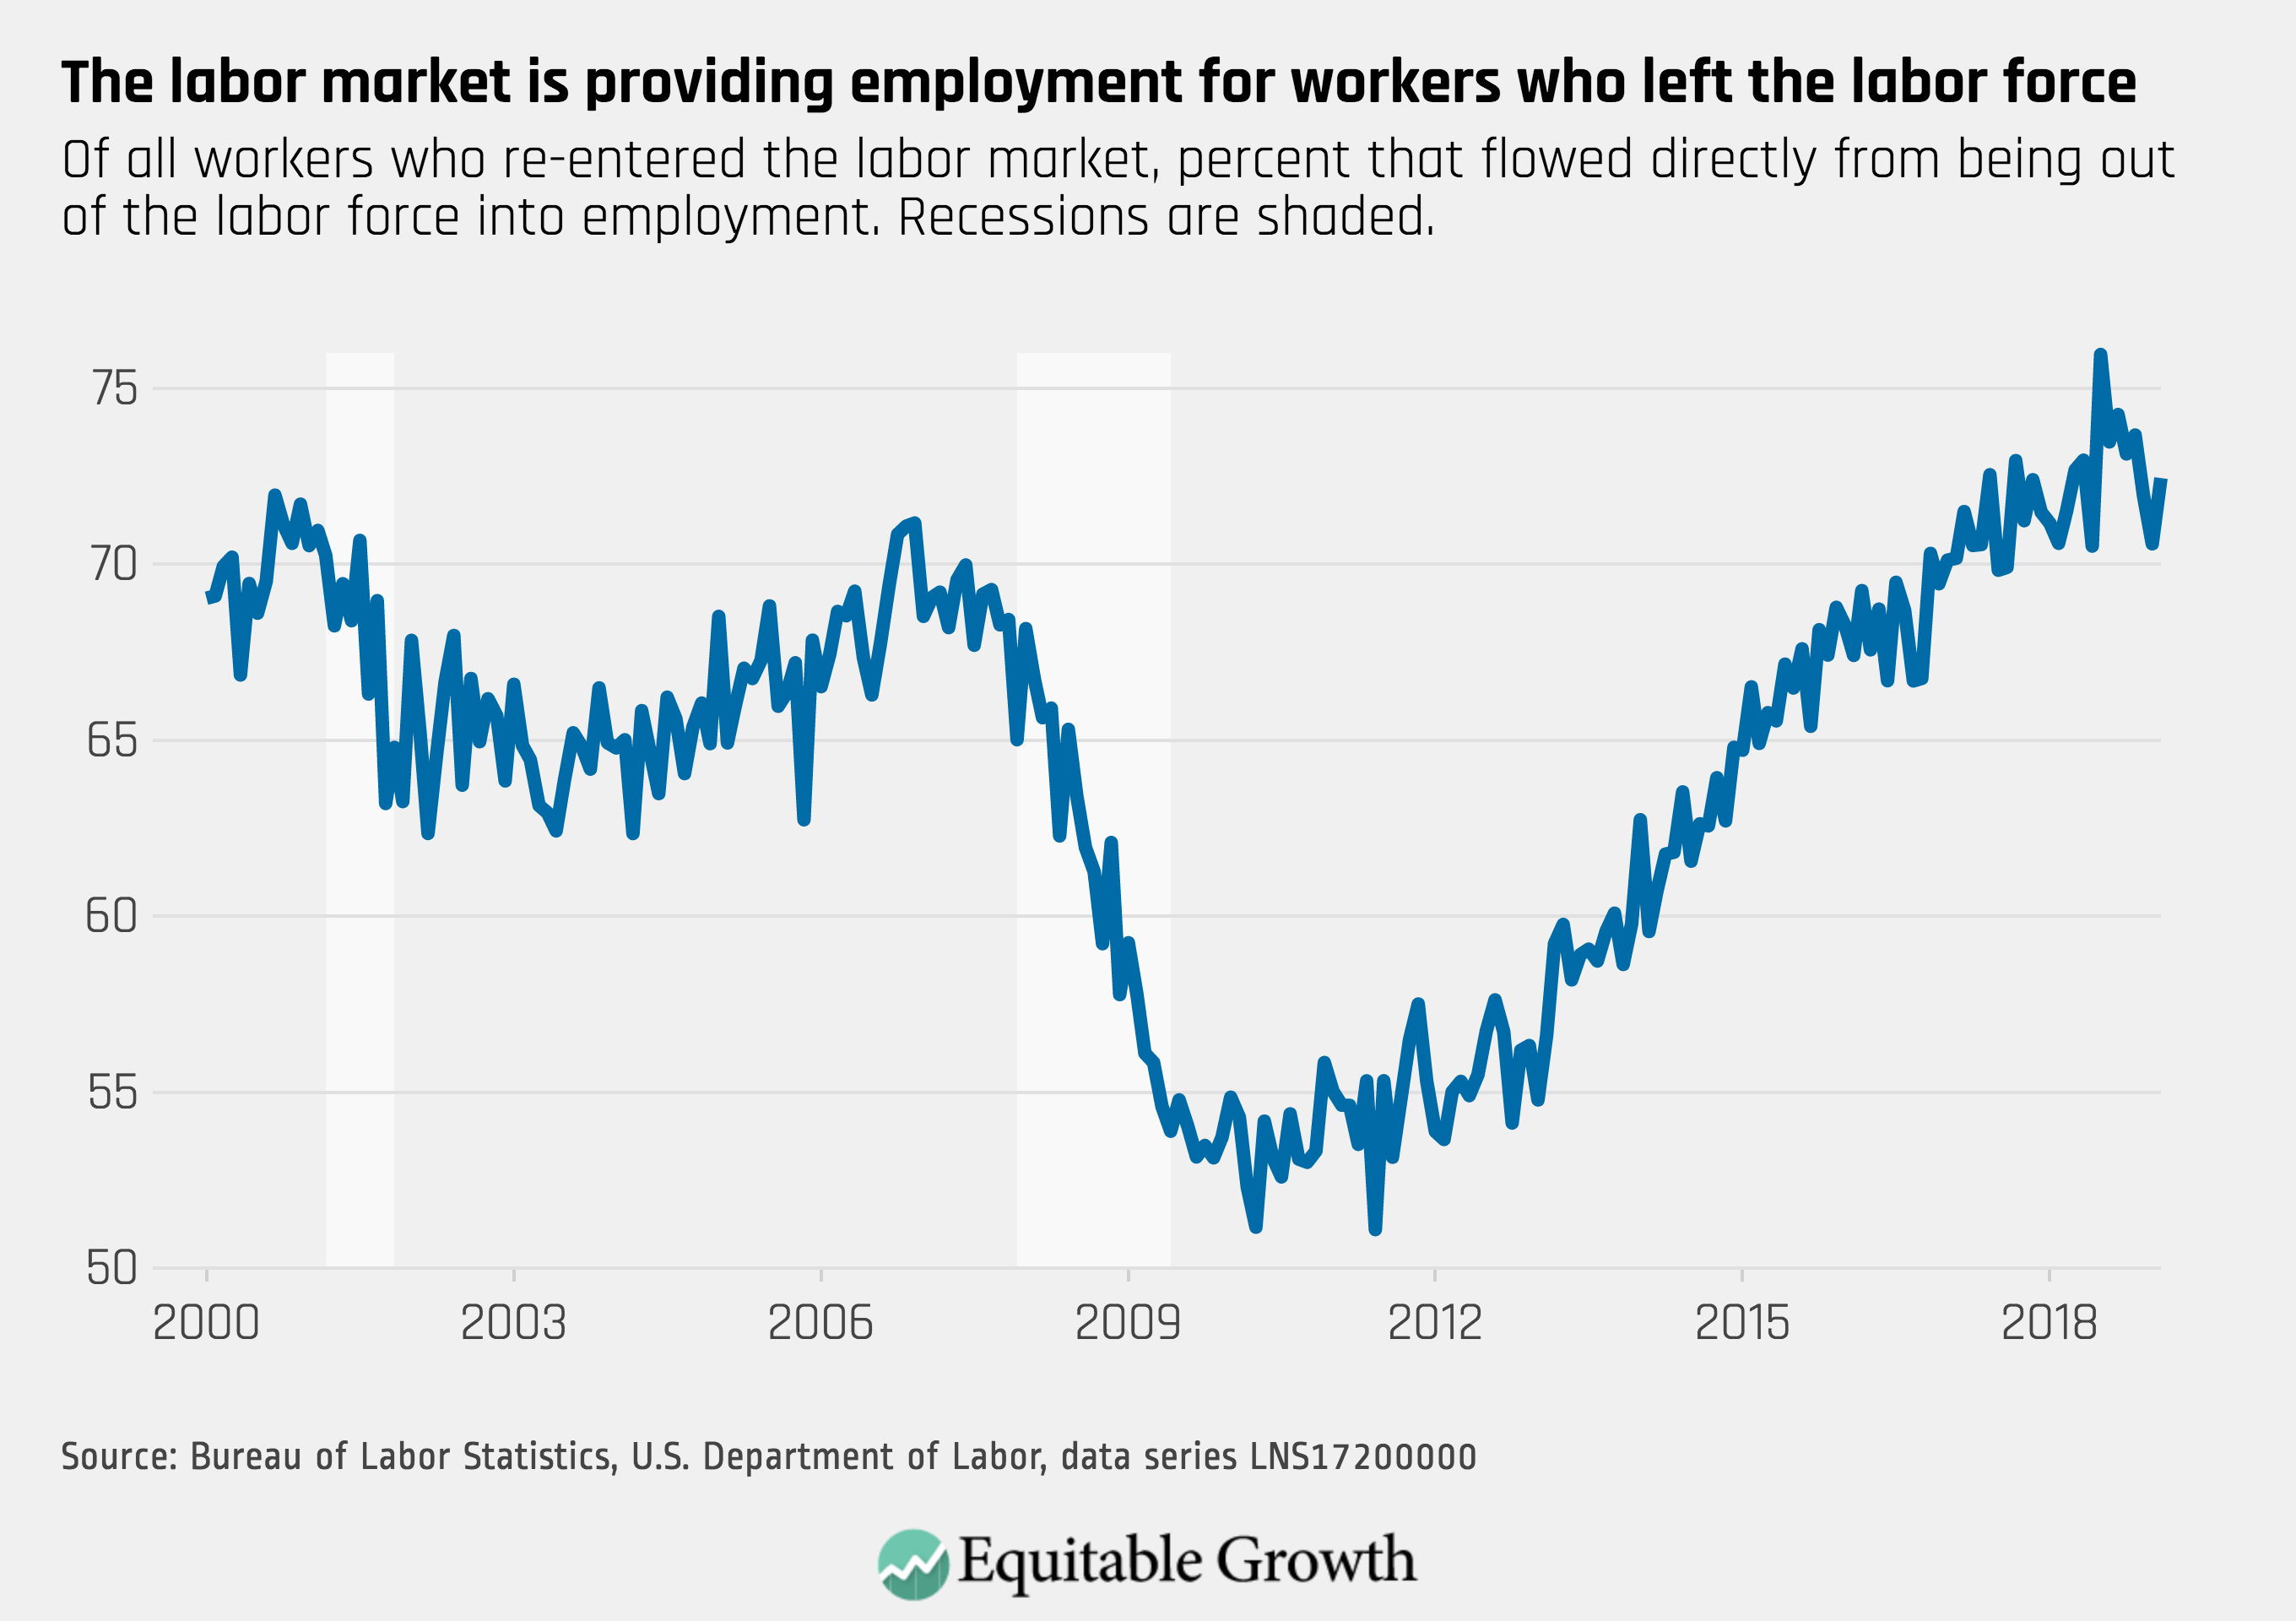
Health care costs in general, and prescription drugs specifically, are, and will continue to be, a major burden on American families, employers, and taxpayers. In 2017, the United States spent $333 billion on prescription drugs, accounting for roughly 1 out of every 10 dollars spent on health care. This challenge is not simply about costs. When prescription drugs cost too much, it affects the patient, not just her pocketbook. Thirty percent of Americans are not taking their prescriptions as directed due to costs. Behind these numbers are real people facing real problems such as Adalyn Watts, who, on a fixed income, can’t afford her insulin and still buy food and pay the rent.
There is no silver bullet to controlling prescription drug costs. Rather, it will take a broad range of policies to address the problem. Within that context, competition can play a vital role in promoting the development of new drugs and controlling costs. In 1984, Congress passed the Hatch-Waxman Act, which spurred both innovation and price competition by creating a pathway for the approval of generic drugs. Today, however, competition is broken. It has become far too easy for companies to manipulate the system to delay competition and increase prescription drug costs.
Delaying and suppressing competition in prescriptions can be enormously profitable, increasing the cost of prescription drugs by millions of dollars a year and preventing competition for years. Unless a strong deterrent exists, many companies will see antitrust liability simply as a cost of doing business. Yet even as the public and Congress are turning their attention to high prescription drug costs, the federal courts have questioned and limited the Federal Trade Commission’s ability to deprive defendants of the profits they earn by violating the Federal Trade Commission Act.
Allowing companies to engage in anticompetitive activity also may undermine innovation. If a company can maintain its monopoly by excluding competition or by paying off a competitor, then it will have less incentive to innovate. This is likely to be a particular problem in pharmaceutical markets. Oftentimes, a small tweak to a product will extend the exclusivity of a product for years at little cost. Instead of undertaking costly and risky research that could lead to a breakthrough, companies may rely on anticompetitive conduct to protect their profits.
There are three simple policy proposals that could bolster competition in pharmaceutical markets.
- Stopping Strategies that Delay Generic Approvals: This Subcommittee, along with the Senate Judiciary Committee, has been a leader in addressing sample blockades and safety protocol filibusters. The CREATES Act would stop both practices.
- Stopping Pay-for-Delay Agreements: Despite the U.S. Supreme Court’s clear signal in the Actavis case that pay-for-delay can be anticompetitive, the FTC continues to spend substantial resources and time challenging clear violations. Tougher laws such as the Preserve Access to Affordable Generics Act would deter such conduct and free up limited resources to attack other anticompetitive conduct.
- Restore and Confirm the Federal Trade Commission’s Disgorgement Authority: A relatively simple modification to the Federal Trade Commission Act would clarify the FTC’s authority to deprive companies of any illegal profits they earned—authority that is critical to deterring highly profitable but anticompetitive conduct.
I make these recommendations based on my career spent fighting anticompetitive practices in the health care industry and elsewhere. For 20 years at the Federal Trade Commission, much of my time was spent on the frontline of what has been, and continues to be, a never-ending struggle to protect competition in pharmaceutical markets.
In principle, the antitrust laws stand as a bulwark against anticompetitive conduct. But the courts have increasingly stripped those antitrust laws of their potency. With few exceptions, courts have imposed ever higher burdens of proof on the government, creating incentives for companies to violate the antitrust laws. What should be easy cases have become difficult to prove, and many types of conduct escape condemnation. As a result, companies are emboldened to push the limits of business conduct because the rewards are great and the risks of liability are low. All the while, consumers are paying the price with higher drug costs.
Over the course of my career I have seen the power of antitrust enforcement to protect consumers from activity that, when left unchecked, costs consumers millions and puts lives at risk, and what happens when courts circumscribe antitrust doctrine and cripple enforcement. As a young attorney, I was part of the FTC team that successfully challenged a generic company’s strategy to lock-up a key supply ingredient on three drugs and raise prices by more than 2,000 percent, thus earning more than $100 million in illegal profits. I played a leading role in the FTC case challenging Schering-Plough’s $60 million payment to a potential competitor to delay its entry, which protected close to $1 billion in revenue for Schering-Plough’s branded K-Dur product. Unfortunately, the federal courts initially decided that the branded companies could pay to eliminate potential competition, at least until the patent expired, legitimizing what came to be known as pay-for-delay patent settlements.
Then, as an attorney advisor to Federal Trade Commissioner, and later, FTC Chairman Jon Leibowitz, I coordinated the Federal Trade Commission’s strategy to stop this practice, which delayed cost-saving competition by, on average, 17 months and cost consumers $3.5 billion a year. After a concerted, decade-long effort that involved virtually all parts of the agency, the Department of Justice’s Antitrust Division and the Solicitor General’s Office, the Supreme Court in Federal Trade Commission v. Actavis held that such agreements can violate the antitrust laws. Although the decision prevents the worst-case scenario, it is taking years—and, in a recent case, a decade—for the FTC to obtain relief in even the most blatant pay-for-delay case.
Even as the Federal Trade Commission made progress on stopping pay-for-delay patent settlements, companies found new ways to subvert competition. Two related tactics are sample blockades and safety protocol filibusters. FDA approval to sell a generic drug requires a company to prove that its product is the same as the branded drug product by comparing its product to the branded product. Certain branded pharmaceutical companies are preventing companies from obtaining branded samples, which prevents the generic manufacturer from obtaining approval to market its product. Relatedly, in certain circumstances, the law requires the brand company and the generic company to negotiate safety protocols. Some branded companies filibuster these negotiations. As Deputy Chief Trial Counsel for the Bureau of Competition, I worked on investigations into, and cases challenging, branded companies’ use of these tactics to delay competition.
My testimony begins by describing generic drug competition, the unique role it plays in controlling the prices for prescription drugs, how that competition is fragile, and how it can easily be disrupted by anticompetitive practices. Then, I propose three policy reforms that will bolster competition and deliver more affordable medicine to consumers and save lives. My comments will be motivated by a simple idea: the focus of policy should be to understand the experiences of—and improve the living standards of—American families, particularly middle-class families and families striving to reach the middle class.
A. The Nature of Competition in Pharmaceutical Markets Creates Incentives to Delay and Prevent Competition
Competition plays a unique and fragile role in determining prescription drug costs: Unique because competition from generic alternatives are the only competition that dramatically reduces costs, and fragile because this competitive dynamic can be circumvented in many ways.
Prescription drugs fall into two broad categories. The more traditional and common ones are called small molecule drugs (ibuprofen, antibiotics, etc.). A newer but growing category is biologics, which are protein-based and derived from living matter or manufactured in living cells using recombinant DNA biotechnologies (Humira).
1. Generic Competition for Small Molecule Drugs
The impact of the Hatch-Waxman Act on competition for small molecule drugs cannot be overstated. Prior to its passage, few generics were available. Today, generic competition has a dramatic impact. As Figure 1 shows, in a matter of months (and sometimes even faster), a generic drug takes the vast share of the branded product’s sales. This phenomenon is similar for almost all small molecule drugs. Figure 1 depicts a generic entry event that occurred in 1999. Currently, a generic product gains market share at even a faster rate than in the late 1990s: Now, a generic product, on average, captures 90 percent of the market within a year of entering the market, and the branded company’s profits plummet. Simply delaying generic competition can be very profitable.
Figure 1
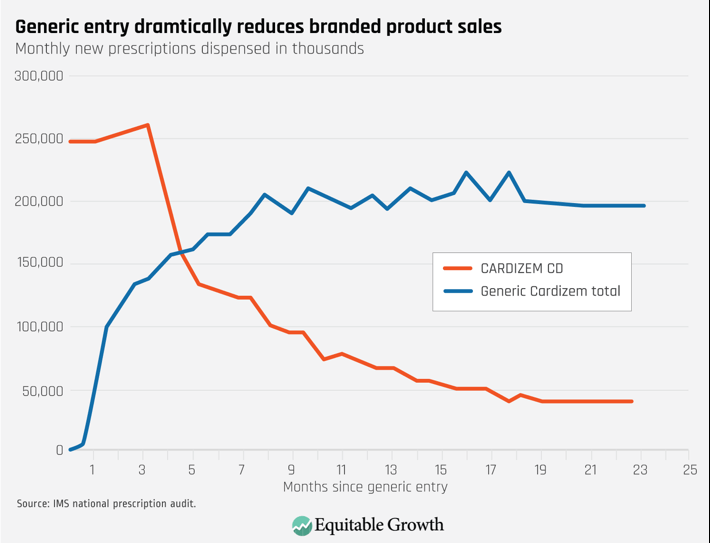
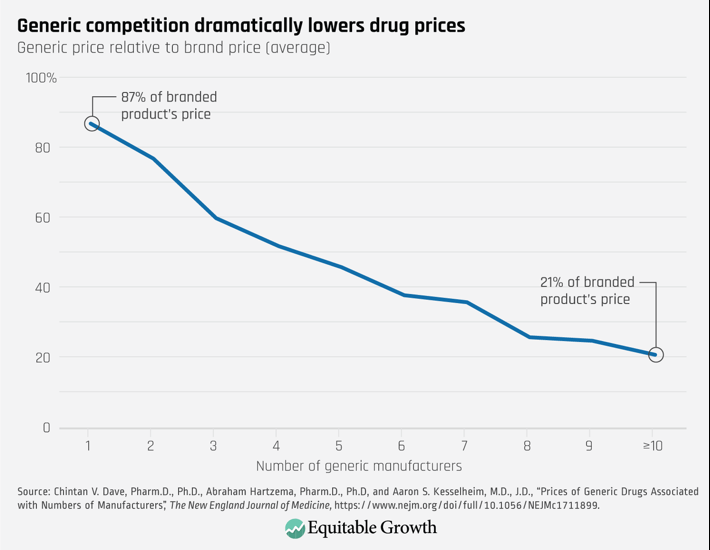
Both generic companies and consumers, however, benefit from competition. As Figure 2 shows, generic competition leads to substantial price decreases. Eventually those prices fall to roughly 15 percent of the branded price. While generic companies earn profits, the big winners are consumers, who end up receiving the same therapeutic benefit at a far lower cost.
Critically, price competition, whether for small molecule drugs or biologics, comes from a limited set of potential competitors. And the incentives to prevent that competition are large.
Figure 2
2. Biosimilar Competition for Biologics
Biologics drugs such as Humira represent an increasingly large portion of prescription drug costs, accounting for 25 percent of all prescription drug sales in 2016. They offer great promise in combating debilitating and rare diseases. But they tend to be very expensive, costing patients tens, or even hundreds, of thousands of dollars per year.
In 2010, in the Biologics Price Competition and Innovation Act, Congress attempted to create a similar competitive dynamic for biologics that exists for small molecule drugs. The act created an abbreviated path for approval of biosimilar drugs. Like generics, biosimilars have no clinically meaningful difference from the corresponding biologic drug. Biosimilar drugs, however, are more expensive to develop than generic small molecule products, and they require more testing. And, as of yet, none are deemed interchangeable. Even when BPCIA was enacted, experts expected that biosimilar production would be priced at less of a discount and achieve a lower level of market penetration than generic small molecule drugs. With many biologics having high prices and large revenues—Humira sales exceed $13 billion, Enbrel sales fall just short of $5 billion, Rituxan sales exceed $4 billion—biosimilar competition can save hundreds of millions of dollars per year per drug even if the biosimilar product is priced at a modest discount (25 percent) and gains only a modest share (30 percent).
So far, in the United States, experience has not lived up to those expectations. The European Union approved its first biosimilar in 2006, but the FDA did not approve a biosimilar until 2015. Today, according to NPR, Europeans have access to some 50 biosimilars. The FDA has approved 17 biosimilars, and only seven are on the market. In Europe, biosimilars accounted for more than 25 percent of reference molecule share for Remicade within 2 years of launching (which has risen to more than 60 percent). In contrast, in the United States, biosimilar versions of Remicade account for just 7 percent of the market after 2 years. Although a biosimilar version of Humira will not be available in the United States until 2023, competition from biosimilars in Europe forced AbbVie to lower Humira’s price 80 percent.
Biosimilars are delivering significant savings in Europe but not in the United States. There are many reasons for the lack of success in the United States, which Professor Scott-Morton discusses. A successful biosimilar market must develop in the United States in order to control prescription drug costs.
Critically, price competition, whether for small molecule drugs or biologics, comes from a limited set of potential competitors. And the incentives to prevent that competition are large.
That competitive dynamic is fragile because there are many decisionmakers and overlapping legal and regulatory structures. Successful competition means the product has obtained approval from the Food and Drug Administration, has gotten a preferred status on the insurer’s formulary, and a doctor, who has little or no financial incentive, has prescribed it. If competition breaks down at any point in that chain, prescription drug costs increase.
B. Breaking the Chain: Preventing Approval of Generic or Biosimilars through Sample Blockades and Filibustered Negotiations
Obviously, a product without FDA approval cannot compete in the marketplace. If the company cannot satisfy the FDA’s requirements, then the system is working as it should. Yet some branded companies have found two ways to manipulate the system to prevent generic approvals: through sample blockades and filibustered negotiations.
1. Sample Blockade
If a company seeking approval for a generic drug (or a biosimilar) cannot obtain samples of the branded product, then it cannot perform the testing required to obtain approval. No samples; no testing; no FDA approvals, all of which means no competition and higher prescription drug prices.
Typically, companies seeking to develop a generic drug or biosimilar product obtain samples from drug wholesalers. In the case of a restricted or closed distribution system, the branded company is the only source for the sample. Some companies simply refuse to sell the sample to a potential competitor, thereby protecting the branded franchise. This strategy can delay competition for years—and sometimes for a decade or longer. For example, Mylan Pharmaceuticals alleges that it tried, unsuccessfully, to buy samples for Thalomid beginning in 2004 and for Revlimid in 2008, drugs both subject to Risk Evaluation Mitigation Strategy, or REMS, but the manufacturer, Celgene, refused. In 2014, Mylan sued Celgene in a case that is scheduled to go to trial this year.
This strategy arose from a manipulation of the REMS systems. Some drug products present unique dangers, and the FDA imposes additional safety requirements to ensure that the drug’s benefits outweigh its risks. The most restrictive of these requires a closed distribution system in which the manufacturer may not sell through normal distribution channels (through wholesalers). Instead it sells directly to pharmacies or through a specified distributor. REMS systems with restricted distribution revealed that a branded company could easily prevent a generic company from obtaining samples. Over time, some companies have taken the position that REMS or not, a company has no obligation to provide its product to companies seeking to market a competing product. According to the FDA, 28 out of 54 products in which drug companies cannot obtain samples are products with no REMS requirement.
2. Safety Protocol Filibusters
The second tactic occurs only with drugs subject to a REMS. By law, when a company seeks approval to sell a generic version of a branded drug subject to a REMS, there is a presumption that the branded company and the generic companies should develop a shared REMS distribution system and a shared set of safety protocols for the distribution of the drug, known as a single-shared REMS. Before receiving FDA approval, the generic must reach an agreement with the branded company on the shared system or seek a waiver of the requirement from the FDA. The branded company, which is already approved and on market with its REMS distribution system, by contrast, faces no repercussions for refusing to negotiate. Dragging out negotiations delays approval of the generic product and protects the branded company’s profits.
The presumption has failed. Since Congress created the presumption of a single-shared REMS system more than a decade ago, the FDA has approved only one single-shared REMS system where the generic product was not on the market. Two examples stand out. In the case of Suboxone, a drug used to treat opioid addiction, the branded company allegedly delayed negotiations of a shared REMS so that it could switch its franchise to a new form of the drug that insulated its $1.5 billion franchise from generic competition. For more than 3 years, generic companies tried unsuccessfully to negotiate a shared REMS system with Jazz Pharmaceutical for Xyrem, a billion-dollar drug used to treat narcolepsy, before the FDA granted a waiver from the shared REMS requirement.
In some cases, the generic may not have received approval even without these delay tactics. But it makes little sense for a monopolist to serve as the gatekeeper for competition.
3. Failed Solutions
These strategies are neither new nor unexpected. Congress has said explicitly that a company shall not use a REMS system to “block or delay approval” of an ANDA. But the statute provides no enforcement mechanism. On multiple occasions, the FDA has tried to address the situation. In response to branded companies’ arguments that generics would adopt insufficient safety precautions in their testing, the FDA began reviewing generic companies’ testing procedures. If the FDA is satisfied, it will send a letter confirming that the generic companies’ protocols contain safety protections comparable to the applicable REMS for the branded drug. Further, the letter states that selling product to the generic company would not violate the applicable REMS. Finally, starting last year, the FDA began disclosing all drugs for which a potential generic company has said that it could not obtain the branded product. Disclosure has had little impact. The current list identifies more than 170 inquiries covering more than 50 products.
Monopolization is illegal under Section 2 of the Sherman Act, and this tactic should fall within the scope of Section 2. Over the past two decades, however, the Supreme Court has significantly limited the scope of monopolization law, in particular for monopolists’ refusals to deal with competitors. Although the Federal Trade Commission has argued in Amicus Briefs that refusing to provide samples could violate the antitrust laws, it has not brought an enforcement action. Some private action, antitrust cases have survived motions to dismiss and summary judgment. No case has been successfully litigated to judgment. At best, antitrust enforcement in this area takes years, by which time the conduct may have achieved its goal.
4. The CREATES Act: A Practical Solution
The Creating and Restoring Equal Access to Equivalent Samples (CREATES) Act, a bipartisan bill introduced by the Chairman and Ranking members of the House Judiciary Committee and the Antitrust subcommittee, is a practical and narrowly tailored solution to these problems. First, a generic or biosimilar developer could sue a branded company for samples if the product is not available in the normal channels of commerce and the branded company has refused to sell to the developer. If successful, the court would order the branded company to sell sufficient samples to the generic company for testing purposes. To ensure the branded company does not simply force every generic competitor to bring an action, the bill provides for attorney fees for the plaintiff if successful. And the court assesses a penalty if the branded company lacks a legitimate business reason for refusing to sell the samples or if it fails to obey the court order to sell the product. Second, the bill would eliminate the presumption in favor of a shared REMS.
This solution is simpler than requiring the FDA to wade into commercial disputes between private parties. Also, the remedies are narrower than under the antitrust laws. A clear rule bolstered by a simple enforcement mechanism will eliminate the incentive and ability for companies to use a sample blockade to delay entry.
Objections to the bill are unfounded. Taking a step back, bioequivalency and biosimilar testing, which is the issue being addressed in the CREATES Act, occurs in a tightly controlled setting and involves a relatively small number of samples. The FDA estimates the testing requires roughly 1,500 to 5,000 units (capsules or tablets) and relatively few subjects. That setting presents a lower level of risk than occurs in the real world with everyday use by patients, which are situations that REMS address.
Some have argued that the bill eliminates the FDA’s authority to ensure that testing procedures are safe and will pose a danger because some drug developers will mishandle the samples during the testing process. The FDA flatly disagrees: “The CREATES Act would—appropriately—leave unchanged FDA’s authority to ensure that generic developers are using acceptable safety standards in bioequivalence testing.” The FDA would have the same authority and responsibility to ensure safety as it does currently. Section 3(b)(2(B) of the CREATES Act requires drug developers to obtain FDA approval for its bioequivalent or biosimilar testing before it can bring an action for samples for any drug subject to a REMS. Further, the FDA can impose any requirement it deems necessary.
Enacting the bill will not lead to frivolous litigation. The primary relief is that the plaintiff will receive enough samples to conduct the necessary testing for FDA approval. Only a company with the interest and capacity in developing and marketing a generic or biosimilar product will benefit from this injunctive relief. Nor will the penalty provision trigger frivolous lawsuits. A defendant can always avoid the monetary award by simply supplying the drug. Further, the monetary penalty occurs only if the defendant has no legitimate business reason for having refused to sell the samples to the plaintiff. The penalty provision will deter companies from abusing the system.
Without any deterrence, some companies might simply require every generic company to sue them before providing the samples, which would defeat the purpose of the bill. Others have suggested that the penalty should go to the U.S. Treasury, either in whole or in part. Such a change would diminish or eliminate the incentive of the plaintiff to undertake the additional and difficult burden of establishing that the penalties are merited. Similarly, giving the FTC the responsibility to enforce the statute or to obtain monetary penalties would force the agency to choose between its broader mission or spend significant resources enforcing this one issue.
A monetary penalty may not be only the deterrence that could work. Alternatively, another possible penalty would be to reduce the branded company’s exclusivity by some multiple of the days that the branded company did not provide the samples.
C. Breaking the Chain: Pay-for-Delay Patent Settlements
The competition chain also breaks if a branded company pays the generic or biosimilar company to delay launching its competitive product. These agreements arise in patent litigation. The branded company has sued the generic company for patent infringement. If the brand wins the litigation, the generic company cannot enter the market, and the brand keeps its monopoly profits. If the generic wins, it can enter the market. The brand quickly loses sales as described in Section A1. The generic earns a profit—but far less than what the brand earned—and consumers pay lower prices.
Beginning in the 1990s, a new form of settlement arose. The brand company would eliminate the potential for competition and pay the generic company not to market its product for a period of time. This strategy circumvents the Hatch-Waxman structure to encourage competition. Both the branded and generic company profit at the expense of the consumers.
1. The Problem
The antitrust battle over these settlements has raged for more than 15 years. In a series of decisions that began in 2003, various courts concluded that this practice was acceptable. In these courts’ view, the fact that the branded company’s patent might exclude the generic meant that the branded company could pay the generic not to compete for any period of time until the patent expired.
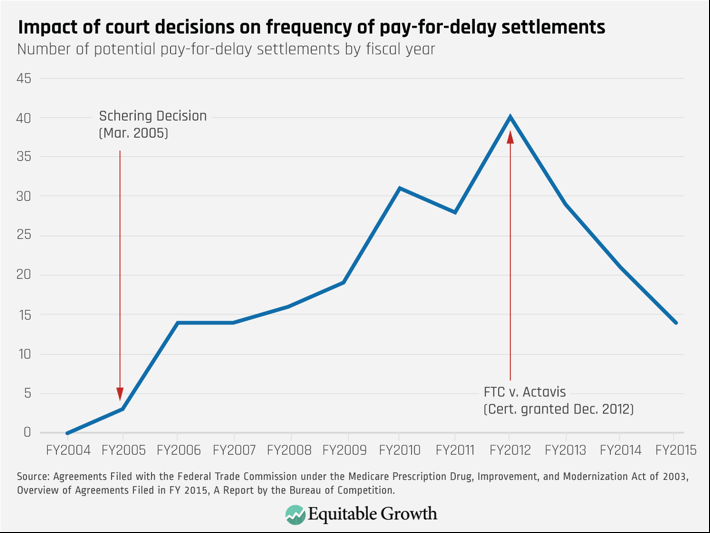
These rulings had a devastating impact on generic competition. The number of potential pay-for-delay deals increased from zero in fiscal year 2004 to a high of 40 in fiscal year 2012. On average, these deals delayed generic competition by 17 months and increased total prescription drug costs by $3.5 billion a year.
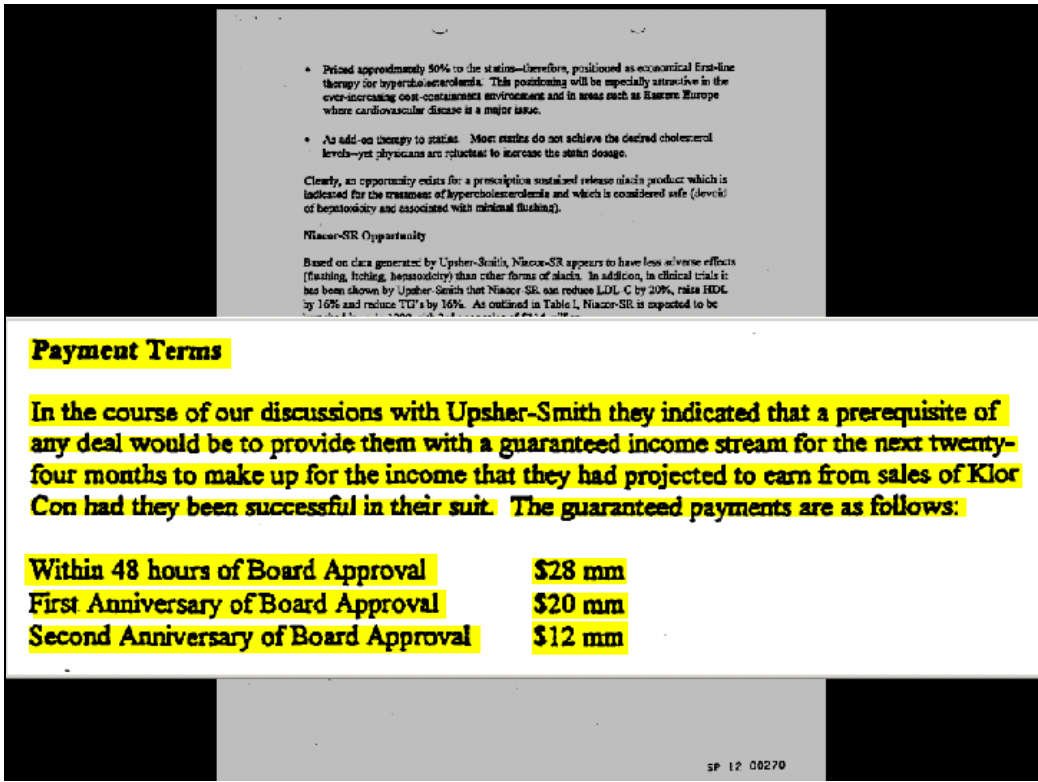
These cases reveal the powerful incentives for branded and generic companies alike. Branded companies are calculating how much the generic could earn by competing and compensating them for not competing. Take the FTC’s case against Schering-Plough and Upsher-Smith. The case involved Schering’s branded product, K-Dur 20, a potassium supplement. Schering alleged that Upsher’s generic version would infringe the patent on the coating of its K-Dur product. Under the settlement, Upsher agreed to stay off the market for 4 years. In addition, Schering paid Upsher $60 million. Upsher also gave Schering the rights to sell four unrelated products outside of North America. Figure 3 shows a page from a document presented to Schering’s board that describes the settlement. The board was told explicitly that the payments were to replace the income Upsher would have made selling the generic product.
Figure 3
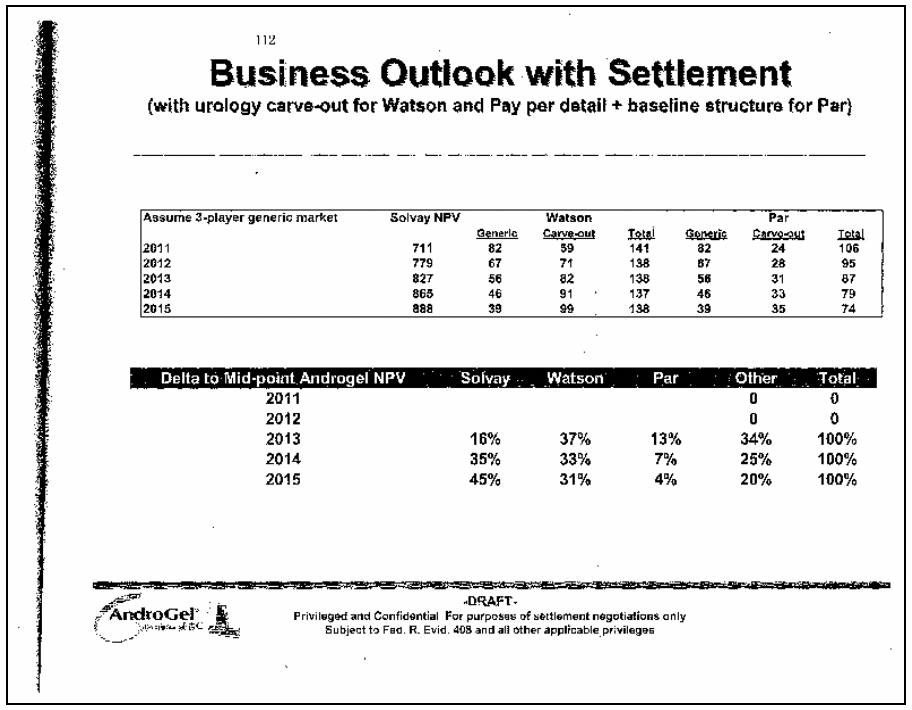
In the Androgel litigation, the FTC challenged a settlement in which Watson Pharmaceuticals, the generic company, agreed to keep its generic Androgel product off the market until 2015. Until then, Watson would market Solvay’s branded product and receive a royalty on the branded product’s sales. Instead of trying to take sales from the monopolist, Watson would be trying to increase them; Watson was literally sharing in Solvay’s monopoly profits. Figure 4 is an excerpt from a Solvay document analyzing potential settlements with the co-promotion agreement. The left column shows the date of generic competition. Not surprisingly, the later competition occurs, the more Solvay earns (the Solvay NPV) and the less Watson makes (“Generic column”). The Watson carve-out column shows how much Watson will make from the co-promotion. The later the generic competition occurs, the more Watson makes on promoting branded Androgel. Indeed, with a share of branded Solvay’s Androgel profits, Watson would make the same profit whether it launches a generic in 2011 or 2015. Consumers, who do not appear in the document, are worse off, as they lose the benefit of competition for 4 years.
Figure 4
2. The Supreme Court’s Partial Solution
In 2013, in the Androgel case (FTC v. Actavis), the Supreme Court rejected the lenient view that patent holders could simply pay potential infringers to stay off the market. According to the Supreme Court, an agreement in which the branded and generic companies eliminate potential competition and share the resulting monopoly profits likely violates the antitrust laws, absent some justification. The Supreme Court’s decision has limited pay-for-delay deals. In fiscal year 2015, the most recent year of reported data, the number of potential pay-for-delay deals fell to 14.
That success has been incomplete, and it overlooks the cost of enforcement. The Supreme Court approach requires a case-by-case analysis of a practice that virtually always is anticompetitive. That allows companies to find new ways to hide compensation or offer a plethora of alternative justifications for their conduct. Based on the past mistakes and some open hostility to the Supreme Court’s decision, courts could accept one of these defenses and create a costly loophole. Some courts are openly hostile to the Supreme Court’s decision.
Further, the approach is resource intensive. The FTC has had to litigate multiple pay-for-delay cases since the Supreme Court’s decision. As former Acting Chairman Maureen Ohlhausen explains, for first 2 years after the Androgel decision, the commission was “relegated to damage control,” having to file “ a series of amicus briefs across the country to rectify misconceptions.” Indeed, the FTC finally resolved the Androgel case itself last week, almost 6 years after the Supreme Court decision allowing the case to go forward and more than a decade after the case was filed.
3. Lessons From the Fight Over Pay-for-Delay Settlements
First, pay-for-delay underscores how strong the incentives are for companies to eliminate competition, which benefits them but harms consumers. Further, branded and generic companies are aware of those incentives and act on them.
Second, antitrust rules matter. When courts treated pay-for-delay agreements as legal, their use skyrocketed. (See Figure 5.) When the Supreme Court rejected that approach, their use declined, but they are still occurring.
Figure 5
Third, although the current Supreme Court rule on pay-for-delay settlements protects competition better than the lower courts had, it still has required the FTC to spend substantial resources to prevent clearly anticompetitive conduct.
Congress should pass legislation that creates a strong presumption against pay-for-delay deals such as the Preserve Access to Affordable Generics Act. Not only would such legislation stop the practice. It also would free up resources so that the FTC could investigate and challenge other anticompetitive activity in the pharmaceutical industry.
D. Stopping Anticompetitive Conduct Before it Starts: The Need for Strong Deterrence
Some practices such as pay-for-delay and sample blockades can be addressed through industry-specific legislation, as I have discussed. But Congress cannot legislate a specific statute for every type of conduct. Over the years, the courts have limited the reach of the antitrust laws, particularly regarding conduct by monopolists or vertical agreements (those that are between actors at different levels of the supply chain such as a branded manufacturer and a Pharmacy Benefit Manager). This development is problematic in the context of pharmaceutical markets. When combined with the substantial benefits of limiting generic competition, complex and vague doctrines are an invitation for companies to act on those incentives, which will increase prescription drug pricing.
This dynamic increases the importance of monetary remedies. The Federal Trade Commission has deprived companies of the profits they earned while violating the antitrust laws. Recently, the Third Circuit Court of Appeals clipped the FTC’s ability to seek monetary remedies in precisely the type of case where it is most needed.
The FTC alleged that ViroPharma had illegally maintained its monopoly over Vancocin capsules (a drug that treats a potentially life-threatening gastrointestinal infection) by filing sham petitions to delay the approval of generic competition:
ViroPharma illegally maintained its monopoly over Vancocin Capsules by filing 43 repetitive and unsupported (or sham) petitions with the FDA, as well as three lawsuits, between 2006 and 2012, all in an effort to obstruct and delay approval of a generic version of its branded drug. Even after a panel of 16 independent scientific and medical experts convened by the FDA considered and rejected ViroPharma’s unsupported arguments, ViroPharma continued to repeat its rejected arguments, the complaint alleges. The FTC alleged that ViroPharma’s conduct significantly delayed the FDA approval of a generic, costing consumers hundreds of millions of dollars.
In essence, the FTC alleged that ViroPharma bombarded the FDA with multiple and repetitive requests to make it harder for generic companies to obtain approval. Although the FDA rejected the petitions, the review process itself delayed generic approval.
The allegations, if true, are egregious and without a legitimate justification. Because they involved an attempt to influence the government (petitioning), the government must show that the petitioning is a sham, a high standard of proof. Practically, the FTC could not bring a case until the FDA had resolved all, or at least most, of the petitions. At that point, the FDA typically also approves the generic product. The FTC can probably challenge a sham petition case only when the conduct is complete.
The FTC had two choices. It could file an administrative action, in which case the only relief would be a conduct remedy (ordering the defendant not to engage in similar conduct in the future). Or it could file an action in federal court, where it could also seek disgorgement. Because of the allegedly egregious conduct, the profitability of the sham petitioning (hundreds of millions of dollars), and the difficulty of proving the case, it would make little sense to bring a case that did not seek a monetary remedy.
The Third Circuit Court of Appeals recently affirmed the dismissal of the action, holding that the FTC did not allege that ViroPharma “is violating, or is about to violate” the law as required by statute. Although one can criticize the decision on multiple grounds, the relevant point for the committee is that, if correct, the decision would severely limit the FTC’s ability to seek monetary remedies in pharmaceutical cases.
The decision essentially puts the FTC in a catch-22. Particularly in a sham petitioning case, if the FTC files the action before the conduct is complete (before the petitions have been denied), then it will be difficult to establish the petitioning is a sham. If the FTC files the case after the conduct is complete, then the defendant will argue that it is no longer violating or about to violate the FTC Act and that, therefore, the FTC cannot bring a case in federal court and cannot seek disgorgement. But a sham petition case is precisely the type of conduct that will be deterred only if there are significant repercussions.
Certainly, other courts have taken a different position. Rather than wait for years as the courts sort through this issue, Congress should clarify that under the Federal Trade Commission Act, the FTC can seek a permanent injunction for any violation of the Act, including any ancillary equitable relief such as disgorgement or restitution. Clarifying this authority is critical for the FTC to effectively deter anticompetitive conduct.
E. Conclusion
A lack of competition in pharmaceutical markets contributes to higher prescription drug prices. Because of the unique nature of generic competition, anticompetitive conduct can yield hundreds of millions or even billions of dollars in monopoly profits. For consumers, that can mean additional hundreds or thousands of dollars in prescription drug costs each month. Further, over the past four decades, courts have consistently weakened antitrust doctrine, making easy cases difficult to win. As a result, antitrust enforcers have spent significant time and resources to stop even the most egregious violations.
Three policy changes would limit anticompetitive conduct in pharmaceutical markets and bolster competition:
- Legislation such as the CREATES Act would stop both sample blockades and safety protocol filibusters, which delay competition with no countervailing benefit. The CREATES Act would stop both practices.
- Legislation such as the Preserve Access to Affordable Generics Act would create a strong presumption against pay-for-delay patent settlements, deterring such agreements and freeing up limited resources to attack other anticompetitive conduct.
- Legislation to restore and confirm the Federal Trade Commission’s authority, ensuring that the FTC’s enforcement actions have teeth.
Thank you again for the opportunity to testify on this critical issue.