Labor market concentration and competition in the United States has received renewed and well-deserved attention over the past several years. Competitive labor markets are critical engines of economic growth, worker well-being, and equality. Like in the concentration of sales data, however, it is well-documented that concentration levels in the U.S. labor sector have been rising at the national level.
A new working paper, titled “Local and National Concentration Trends in Jobs and Sales: The Role of Structural Transformation,” confirms these national trends. Its co-authors—David Autor at the Massachusetts Institute of Technology, Christina Patterson at the University of Chicago, and John Van Reenan at the London School of Economics—find that concentration levels across all sectors—manufacturing, retail trade, wholesale trade, services, utilities and transportation, and finance—individually and cumulatively have risen sharply.
They calculate that concentration in sales, as measured by a weighted average of the Herfindahl-Hirschman Index, or HHI—a widely used market-concentration measure that is calculated by summing the squares of each firm’s share in a given market—is up 53 percent and concentration in employment is up by 68 percent in 2017, compared to 1992. To put this in context, a market that goes from five equal-size companies to only three equal-size companies will experience a 63 percent increase in its HHI.
More significantly, the paper also looks behind these national concentration figures to examine whether local concentration trends in job markets and sales track these national trends. These local trends are arguably more important from a competition perspective because people prefer to shop and work near where they live, making competition in local markets most directly relevant to people’s day-to-day lives and livelihoods.
The three co-authors find that while local sales concentration trends track national trends, local job markets have become less concentrated even as national labor concentration has trended upward. Interestingly, though, the downward trend in local job market concentration is being driven by sectoral shifts, not by de-concentration of job markets in any sector.
The authors identify the reallocation of economic activity away from the manufacturing sector and toward the service sector as key to understanding the net decline in concentration in local labor markets. They find that manufacturing is much more highly concentrated than services, even though concentration in both industries has risen over their period of analysis.
For sales, the sectoral shift is not enough to offset the rising concentration trend, and local sales concentration still rises. In employment, however, they conclude that “the reallocation of employment toward less concentrated industry-county cells more than fully offsetsthe rise in within industry-county employment concentration, leading to a net fall in local employment concentration.” Without the reallocation, they estimate that employment concentration would have risen by 9 percent instead of falling by 6.9 percent.
Autor, Patterson, and Van Reenan explain the disparate results between employment and sales concentrations by observing that productivity—output per worker—generally rises faster in manufacturing that in other sectors, meaning that a reallocation from manufacturing to other sectors tends to be larger than for sales. “All else equal, sectoral reallocation from manufacturing to services reduces both local sales and employment concentration,” they write. “But the de-concentrating effect is larger for employment than sales because the extent of reallocation is greater.”
The co-authors use a series of counterfactuals to illustrate the fact and the magnitude of this effect. They also look at whether geographic shifts can explain the observed differences, finding that controlling for geographic shifts only modestly impacts trends in employment concentration and has no effect on sales concentration.
The implications of these findings are nuanced but significant. Regarding sales, the co-authors note that increased concentration is likely driven by the rise of chain stores, which may be more efficient and offer better variety. Regarding employment, workers with good sectoral mobility probably enjoy greater competition, and those with limited sectoral mobility have more limited options. But, importantly, that increased overall competitiveness comes not from employment markets becoming more competitive—they are not—but rather from workers shifting from less competitive sectors (manufacturing) into relatively more competitive sectors (services).
It remains to be seen whether trends in increasing local employment competitiveness will hold up over time, but there are good reasons to suspect they may not. First, at some point, the shift of workers from manufacturing to services will slow down or even stop, as the pool of manufacturing workers shrinks. Indeed, manufacturing’s share of employment has already fallen by almost 10 percent from 1992 to 2017. As noted earlier, without the effect of this shift the authors estimate employment concentration would have risen by 9 percent instead of falling by 6.9 percent over the studied period.
Second, employment in the service sector is more competitive than in manufacturing, yet both sectors are trending toward increased concentration. Combining these two effects over time may see the impact of the shift shrink while an increasingly large pool of service workers see concentration in that sector increase.
The reallocation of workers from manufacturing to services also has significant implications for the balance of bargaining power between workers and employers, highlighting the close-but-complex relationship between bargaining power and competition. While employment markets in manufacturing are more concentrated than in services, manufacturing workers have much higher rates of union membership and a more organized labor force.
As a result, employees in manufacturing markets, even though concentrated, have historically enjoyed relatively high wages and a greater share of the economic surplus generated in these markets than their counterparts in the service sector. Accordingly, the reallocation of workers from manufacturing to services might simultaneously lead to decreased concentration in local labor markets and decreased worker bargaining power—and attendant lower wages and poorer working conditions.
At the same time, the reallocation of workers to the service sector also may be why there is new interest in unionization within that sector. A resurgent labor movement has met opposition from service-sector employers, such as Starbucks Corp., and led to calls for increased government support for unionization efforts, particularly in the service sector.
Equitable growth in competitive labor markets will require more than just antitrust enforcement, as worker organization also plays a critical role. This study by Autor, Patterson, and Van Reenan drives home the complexity of understanding U.S. labor market dynamics at both the national and the local level, and the need to pursue multifaceted policy solutions to promote efficient and equitable markets for workers.
The Washington Center for Equitable Growth today announced its 2023 cohort of grantees, an impressive group of researchers from across academic disciplines who are studying how inequality affects economic growth and well-being in the United States. This year’s funding will be distributed across 16 grants to a total of 35 grantees, who range from Ph.D. candidates to well-established thought leaders in academia.
This is Equitable Growth’s 10th grant cycle since our founding in 2013. Over the past decade, we have been able to distribute roughly $10 million to nearly 400 grantees at various U.S. colleges and universities studying how inequality affects economic growth. Our grantees work to build a strong research base that provides evidence to decision-makers seeking to address pressing economic issues in the United States, informing the policy debate in Washington and in statehouses across the country.
Equitable Growth’s funding is guided by four channels through which economic growth is produced and distributed:
Macroeconomics, including the distributional effects of monetary and fiscal policy
Human capital and well-being, including intergenerational mobility and the long-term returns to investments in children and families
The labor market, including workplace organization and power imbalances
Market structure, including the degree of market power and the effectiveness of policy tools to promote competition
We also are excited to continue to collaborate with the Russell Sage Foundation, a leading funder of social science research, particularly on social, political, and economic inequality. Russell Sage is generously providing co-funding for one of this year’s research grants.
Two projects focus on the U.S. child care system—an area in which Equitable Growth has been eager to fund research and that will certainly have policy implications as costs continue to rise, care options remain inaccessible for many U.S. families, and workers’ wages remain low. A third project explores the long-run effects of investments in children:
Scott Allard of the University of Washington and Taryn Morrissey of American University will examine the child care industry and workforce across U.S. counties since the onset of the COVID-19 pandemic, specifically looking at differences by geography, race, and poverty level.
Elizabeth Davis and Jonathan Borowsky of the University of Minnesota and Upjohn Institute’s Aaron Sojourner and Gabrielle Pepin will look at the impact of supply-side investments in child care in terms of access to and stability of care options, and whether such investments vary by neighborhood.
Cornell University Ph.D. candidate Anna Malinovskaya aims to find a causal effect of exposure to the Special Supplemental Nutrition Program for Women, Infants, and Children in-utero and in childhood on one’s long-term outcomes. She also plans to study whether and how the effect of WIC exposure is strengthened if one is also exposed to other large-scale public programs, such as Head Start or Medicaid.
Another area that Equitable Growth is excited to fund is worker power and labor organizing. Two grants this year will focus on unions in the United States:
Cornell University’s Kate Bronfenbrenner will look into the differences between unionization efforts that are affiliated with the National Labor Relations Board and those that are not NLRB-affiliated. She will compare characteristics of firms, industries, and bargaining units, as well as how the tactics of both employers and unions in non-NLRB campaigns differ from traditional NLRB campaigns.
Washington University in St. Louis’ Jake Rosenfeld, Western University’s Patrick Denice, and City University of New York’s Jennifer Laird will explore the puzzle of why the U.S. Supreme Court’s decision in Janus v. AFSCME, which effectively made the public sector a so-called right-to-work labor force, did not appear to weaken public-sector unionization and what lessons organized labor can draw from this conclusion. The Russell Sage Foundation is co-funding this project.
Several funded projects also focus on policies that contributed to the long-standing racial wealth gap and what policies may be effective at reducing it:
New York University’s Jacob Faber and Katherine Thomas, in conjunction with Cornell University’s Wenfei Xu and University of Virginia’s Thomas Storrs, will digitize previously thought-to-be-destroyed Federal Housing Administration maps from the 1930s and 1940s that detail redlining in FHA loans. They will then examine how these maps determined which neighborhoods were redlined and how race played a role in those determinations.
Leah Hamilton of Appalachian State University and Stephen Roll of Washington University in St. Louis will look at two guaranteed income programs in Georgia to determine how these policies affect wealth- and credit-building for Black women specifically.
David McMillon of Emory University and the Atlanta Federal Reserve Bank and Karen Kopecky of the Federal Reserve Bank of Cleveland seek to explore whether reparations can close the racial wealth gap in the United States by studying how parental income, wealth, and education affect children’s wealth as adults.
Inflation is also a key research area in this year’s grants, with two projects looking at various aspects of inflationary pressure and its impact on U.S. families and workers:
Columbia University’s Christian Moser, Andres Drenik at the University of Texas at Austin, and Andres Blanco of Emory University and the Atlanta Fed seek to determine the employment and wage effects of inflation in the current inflationary environment.
University of Maryland Ph.D. candidate Michael Navarette and Princeton University postdoctoral scholar Seula Kim will study whether there are heterogeneous inflation rates across the United States and if so, which geographic areas face higher rates of inflation and why. They will specifically look at food price inflation and determine whether local market concentration affects inflation.
The creation of new data that is broadly available to researchers has long been a priority for Equitable Growth, as has the creation of disaggregated data that allows for more granular analysis. As such, three projects this year focus on expanding access to different types of data and utilizing that data to produce evidence that informs potential policy solutions:
Luigi Pistaferri of Stanford University and Fatih Guvenen of University of Minnesota will utilize the Global Repository of Income Dynamics database, which Equitable Growth helped support in a previous grant cycle, to challenge an accepted finding in economics—that inequality increases with age within a birth cohort. Early empirical evidence from the GRID database shows this is no longer true. The co-authors will develop a model to explain this new empirical fact based on the idea that inequality is generated more from differences in childhood experiences than from labor market experiences.
Loyola University Chicago’s Peter Norlander and Svetlozar Nestorov will process job ad text in transparent and replicable ways, creating a new resource for scholars studying the labor market.
Yale University’s Zach Cooper and Stuart Craig, and Zarek Brot-Goldberg from the University of Chicago, will create a database of hospital mergers over the past 40 years, detailing where mergers happen, which people are affected, whether there is a difference between nonprofit and for-profit hospitals, and whether higher-priced hospitals provide higher-quality care.
Two projects will look at the effect of government action—investments and regulation, respectively—on the labor market and on workers:
Alla Abdelfattah, a Ph.D. candidate at the University of California, Davis, will explore the effects of public investments and government subsidies of large-scale business openings (via tax and related incentives) on local labor markets and wages, including the skills demanded by employers post-opening.
Jonathan Kowarski, a Ph.D. candidate at the University of California, Los Angeles, will study whether Clean Air Act regulations increase firms’ labor market power and how those changes potentially impact worker outcomes, drawing lessons for policymakers on how regulations to combat climate change can be designed in ways that promote competitive labor markets.
And finally, Equitable Growth is excited to fund research that examines climate change and the economic impacts of climate policy:
Cornell University’s Ivan Rudik and University of Arizona’s Derek Lemoine seek to explain how climate adaptation projects mitigate the inequalities that arise from climate change and to inform how the United States should invest in global climate mitigation and adaptation activities.
As in years past, Equitable Growth will also host a Dissertation Scholar in the 2023–24 academic year. This program is open to Ph.D. candidates whose research aligns with our funding priorities and offers professional development, mentorship, and training opportunities, as well as exposure to how to make research relevant to policymakers. This year’s Dissertation Scholar is Nataliya Nedzhvetskaya of the University of California, Berkeley, who is studying the scale, scope, and spread of employee activism, workplace protests, and the impact on corporate stock prices.
Equitable Growth is excited to see the results of this research come to fruition, and we congratulate the grantees for their participation in this year’s competitive grant cycle.
Homeownership is part of the American Dream and a pathway to build wealth for many people in the United States. Homeownership allows families to plant roots, build equity, and secure financial stability for future generations. But this is not the case for everyone. For some, there is a hidden barrier that disrupts the wealth-building potential of homeownership: appraisal bias.
Appraisal bias is a skewed valuation of a home’s worth based on the racial or ethnic identity of its owners or its surrounding neighborhood. Systemic, deeply entrenched, and difficult to identify, appraisal bias steers the wealth-building trajectory of millions of families off course. Excellent new work and reporting brings to light the issue for the Black community, but the effects of appraisal bias are widespread, particularly for the Latino community.
What does this look like in reality? Consider the experience of Yoselin. In 2018, Yoselin and her husband took a monumental step toward securing their financial future—they became homeowners. The house, a three-bedroom, two-bathroom property in Brooklyn, New York, represented more than just a place to live; it symbolized hope and opportunity to build family and community.
At the time of purchase, they could not afford a 20 percent down payment, which meant they needed to cover the additional cost of private mortgage insurance. Knowing the sacrifices required for wealth-building, they decided this was worth it. Over the years, they transformed their home with energy-efficient upgrades and interior improvements, injecting love and labor into every nook and cranny.
By 2021, the housing market had soared, with property values across the country escalating at an unprecedented rate. Viewing this as a golden opportunity to reduce their interest rate, adjust their loan-to-value ratio below 80 percent to end the requirement for private mortgage insurance, and lower their monthly payments, the two homeowners contacted their financial institution to refinance their mortgage. During the refinancing process, an appraisal was conducted of their property.
To their shock, the appraisal report was riddled with discrepancies. Their appraisal had one less bedroom than the previous appraisal, for example—one big reason why the home listed for less in 2021 than it did in 2018, significantly diminishing its value. The appraisal value was set at $515,000, glaringly short of comparable neighborhood properties selling for between $550,000 and $590,000.
Armed with proof of discrepancies from the original appraisal, they petitioned for a reevaluation, expecting an easy fix. Their appeal was met with bureaucratic obstinance, and they were unable to secure a reevaluation. As the dust settled, the only options available to them were to continue paying for private mortgage insurance or to reduce the loan amount—a cost they simply could not afford. They were trapped by the unexpected appraisal result and ultimately decided to bear the added costs of the mortgage insurance premium.
This story is a testament to the harsh reality that systemic biases, even in seemingly mundane practices such as home appraisals, can significantly hamper wealth-building within marginalized communities. The account of Yoselin’s family isn’t an isolated case. It ties into the broader issue of appraisal bias that significantly impacts homeownership and wealth-building in marginalized communities.
In response to a mandate from the Biden administration and the intergovernmental Property Appraisal and Valuation Equity, or PAVE, task force, the Federal Housing Finance Agency in 2022 unveiled 47 million public appraisal reports. These reports, collected between 2013 and 2021, exposed an enduring bias in the home appraisal industry favoring higher values for homes owned by White individuals, while depreciating those owned by people of color. An analysis of these appraisals, using U.S. Census Bureau tracts to represent neighborhoods and comparing similar housing areas, identified a clear link: the more White residents in a community, the higher the appraised home values.
The data also show that the impacts of appraisal bias are particularly stark for the Latino community. According to a recent report by the housing finance giant Freddie Mac, home purchases in majority-Latino neighborhoods are about twice as likely to be undervalued, compared to appraisals in predominantly White neighborhoods. To put it that into perspective, about 15.4 percent of single-family properties in majority-Latino census tracts were appraised lower than their contract price between 2015 and 2020, compared to 12.5 percent in majority-Black areas and 7.4 percent in majority-White areas.
The results were even starker when the concentration of Latinos was higher. The rate of homes with lower appraisals increased to 16.7 percent in areas where Latinos represent 80 percent or more of the population. To put it another way, if four out of your five neighbors are Latinos, then your house has a 1 in 6 chance of having an appraisal lower than the contract price.
It gets worse. As if undervaluation weren’t bad enough, the magnitude of the lost value is breathtaking and lifechanging. A 2022 study of the recently released FHFA data by Junia Howell, a sociologist at the University of Illinois Chicago, finds that in metropolitan areas with at least 50,000 Latino residents, the average house in a Latino neighborhood was appraised at $321,000. Comparatively, in these areas, the average house in a White neighborhood was appraised at $891,000, reflecting a whopping 278 percent higher appraisal value, on average.
This is not only a travesty for the individual homeowners but also for the overall housing market. Latino homeownership serves as a powerful engine for the U.S. housing sector, playing a pivotal role in the robustness of the U.S. economy. According to the Urban Institute, over the next 20 years, Latinos will comprise 70 percent of net new U.S. homeowners and are essential to the future of the U.S. housing market and U.S. economy. With housing’s combined contribution to the U.S. Gross Domestic Product, at 17 percent annually, the success of Latino homeowners and the U.S. housing market have a mutual dependence and shared trajectory.
Change is needed to ensure that homeowners such as Yoselin can access the full potential wealth-building power of homeownership, as well as to support the broader housing market and ensure that the economic potential of the Latino community is fully realized. Policymakers and the housing industry must take actions recommended by the National Fair Housing Alliance and the PAVE taskforce. Specifically, they should:
Redefine the governance structure of appraisals. Empower the Appraisal Subcommittee of the interagency Federal Financial Institutions Examination Council by giving the subcommittee the authority to establish rules for how properties are appraised and who can perform these appraisals for all mortgage transactions.
Diversify the appraiser profession. Make the appraiser profession more accessible by reducing barriers to entry. Additionally, ensure all appraisers are well-trained in fair housing practices to promote diversity and equity, as well cultural competence and language proficiency.
Enhance appraisal standards. Strengthen the integrity of property appraisals by giving the Appraisal Subcommittee the authority to advance rules that ensure appraisals are fair, transparent, and supported by data.
Boost funding for fair housing. Allocate more resources to U.S. Housing and Urban Development programs that advocate for fair housing. Additionally, invest in initiatives that educate the public about appraisal discrimination and how to appeal valuations they believe to be unfair. These educational programs must be available in multiple languages and should be led by community-based organizations.
Improve data access. Equip the Consumer Financial Protection Bureau with the authority to establish rules under the Home Mortgage Disclosure Act requiring mortgage lenders to share valuation data. These data should be organized into a publicly accessible database.
The proposed actions offer a starting point and a blueprint for systemic change. While each action alone might not eliminate appraisal bias, collectively, they can initiate the structural change necessary for a fairer system.
Addressing appraisal bias for the Latino community is not just about making things right for families such as Yoselin’s or addressing individual injustices. It is also about recognizing the role that homeownership plays in wealth accumulation and, in turn, the broader economic health of the United States. By rectifying these discrepancies, we can ensure that homeownership is a wealth-building tool accessible to all, irrespective of race or ethnicity.
—Sam Kenney is a senior policy analyst at UnidosUS with the economic development team focused on housing and wealth building.
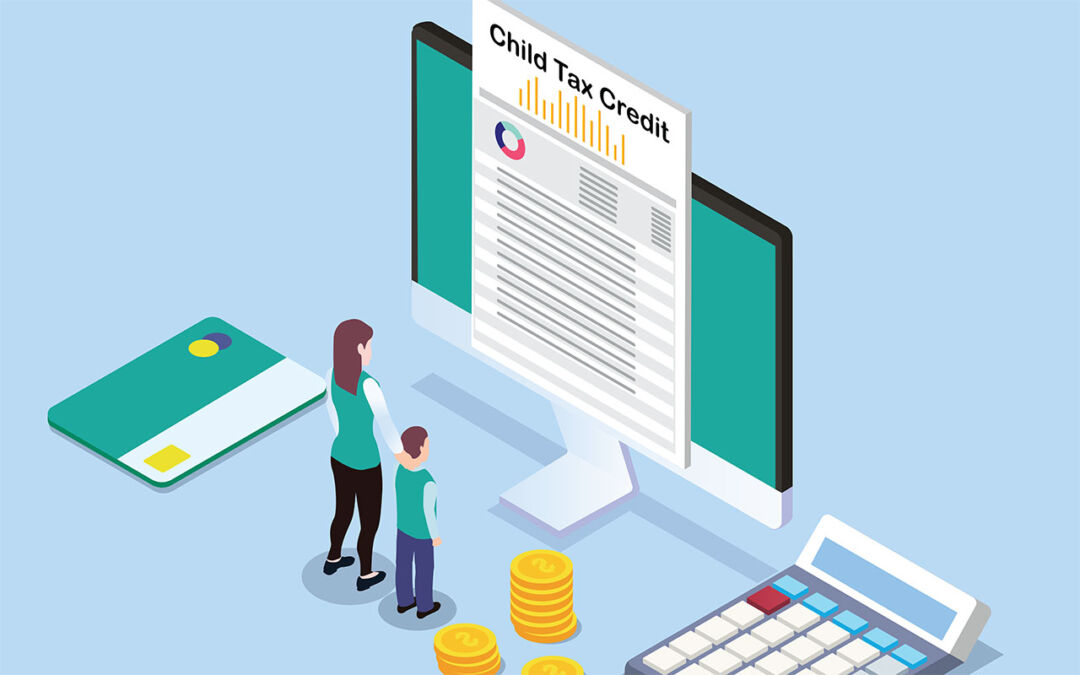
Childhood poverty is a stubborn problem in the United States. About 11 million U.S. children lived in poverty prior to the COVID-19 pandemic, accounting for nearly one-third of the impoverished population in one of the wealthiest countries in the world. Upon the expansion of one of the federal government’s most effective anti-poverty programs—the Child Tax Credit—childhood poverty witnessed “a record drop” during the pandemic, according to data compiled by the U.S. Census Bureau in 2020 and 2021.
The Census Bureau reported a 46 percent decline in its Supplemental Poverty Measure—which measures poverty levels by calculating net income after payroll taxes, tax credits, and federal anti-poverty assistance such as the Child Tax Credit, housing subsidies, and the Supplemental Nutrition Assistance Program—from 2020 to 2021. A major component of this poverty measure was the increased value of the Child Tax Credit, from $2,000 to $3,600 for children under 6 years old and to $3,000 for children between the ages of 6 and 17, which lifted 2.9 million children out of poverty.
Paying monthly bills, such as utilities payments, was the most popular use of these benefits among surveyed recipients of the Child Tax Credit, at 75%. The next most-popular use was the purchase of school supplies or school clothes and uniforms for their children (25 percent) and spending on child necessities, such as diapers and wipes (10 percent). The co-authors also report response rates of between 9 percent and 12 percent for monthly spending of the expanded CTC benefits on mortgage or rent payments. Child care is the least widely used spending of these benefits by families (5 percent to 7 percent), while another 1 percent to 2 percent went into savings accounts.
This working paper demonstrates that a distinct majority of families spent their expanded Child Tax Credit on immediate living expenses and child-related expenses. This led the four co-authors to investigate whether the expanded CTC program improved the economic well-being of low-income U.S. households. Using two separate economic models, the researchers find that each additional $100 increase in monthly CTC payments significantly decreases material hardships experienced by the families receiving the benefits.
More specifically, the average amount of the Child Tax Credit among those who received it was close to $500. When multiplied by each reported month, the average benefit displayed a reduction in the total number of children living in poverty by about 17 percent. What’s more, food insecurity or food hardships also declined because of an additional $100 in monthly CTC payments.
These findings demonstrate that expanding income support programs, such as the Child Tax Credit, are immediately beneficial not only for families with children living in poverty but also for the broader economy of the United States where the families are spending these expanded benefits. Indeed, these findings show that extending the expanded CTC program will help support U.S. families and the broader economy for years to come.
There is a common politicized thread to arguments against expanding the federal antipoverty Child Tax Credit program permanently and to the justifications that a majority of the U.S. Supreme Court used recently when they struck down affirmative action at higher education institutions for historically marginalized student applicants. This overarching theoretical argument is that policies that foster more economic equality and eliminate unfair advantages are themselves unequal and unfair.
This overarching argument is wrong, based on the best available evidence. In this era of politicized theoretical arguments, the importance of evidence-based research that informs policy decisions is paramount. In the case of affirmative action, research conducted over the past decade shows that eliminating these considerations at colleges and universities results in decreased percentages of a diverse array of students, resulting in continuing unequalaccess to a collegeeducation.
In the case of expanding the Child Tax Credit, recent evidence gathered amid the COVID-19 pandemic demonstrates this form of income support for lower-income families with children enables these families to better make ends meet without encouraging recipients of the credit to take the benefit and subsequently exit the workforce or reduce their participation in the U.S. labor market. This column presents the evidence about the efficacy of the expanded CTC benefits detailed in a new working paper, “The Short Term Labor Supply Response to the Expanded Child Tax Credit,” by economists Brandon Enriquez at the Massachusetts Institute of Technology, Damon Jones at the University of Chicago, and Ernest V. Tedeschi at financial research firm Evercore ISI (and now chief economist on the White House Council of Economic Advisers).
Their working paper details the consistency in labor force participation before and after the Child Tax Credit was expanded in 2021 to test the hypothesis that CTC recipients decrease their labor supply after receiving the credit. The expanded Child Tax Credit, enacted as a part of the American Rescue Plan Act, provided eligible families with additional income per child. Specifically, an extension of the plan in 2021 temporarily increased the child tax credit from up to $2,000 per qualifying child ages 16 and under to $3,600 for children ages 6 and under and $3,000 for children ages 6 to 17.
The expanded Child Tax Credit also was temporarily redesigned to include full-refundability of the credit, which meant that families with little to no income could receive it. This generated two main changes: the phase-in portion of the credit was removed, and an immediate income effect was created.
The prevailing theoretical expectation presumed that the income effect would cause CTC recipients to decrease their propensity to work, and increase their demand for leisure. Yet research shows that there is no evidence of a short-term change in labor supply for families who received the increased credit.
Specifically, using Current Population Survey microdata, the three economists examined labor supply outcomes among households who qualified for varying relative increases in household income via the expanded CTC income. They find that lower-income individuals used the expanded Child Tax Credit to strengthen their incomes while continuing to participate in the labor force, thereby strengthening the U.S. economy.
Enriquez, Jones, and Tedeschi also find that there was no change in “the relationship between labor force participation and CTC eligibility, which is nearly identical pre- and post-CTC expiration, suggesting the extended CTC did not reduce labor force participation.” This finding matches other recent research findings conducted on the 2021 expansion of the CTC on labor supply that also failed to produce significant results on an impact on labor supply.
Previous studies also showed that lower-income families were more likely to spend money on necessities: food, clothing, rent, and car payments, among other necessities. In addition, more saving occurs in higher-income Black and Hispanic families than in lower-income Black and Hispanic households.
The upshot: evidence demonstrates that labor force participation rates do not change for CTC recipients based on the size and the delivery of those benefits. In the future, then, the ability of the Child Tax Credit to help lower-income families should be a key economic policy objective for these families in order to foster more equitable, and thus stronger U.S. economic growth. The evidence is clear.
The Unemployment Insurance system in the United States aims to provide temporary and partial wage replacement for workers who become unemployed through no fault of their own. In helping unemployed workers maintain a basic level of consumption—buying food, shelter, and other necessities—this joint federal-state insurance system is an important tool for protecting economic security and stabilizing the macroeconomy during downturns in the U.S. economy.
The role of unemployment insurance is particularly crucial for Black workers, who are more vulnerable when they lose their jobs given the large and enduring racial disparities in the United States. For instance, Black workers face discrimination in hiring and hold less in savings to help see them through periods of unemployment. Yet, in practice, the way unemployment insurance rules are designed might end up limiting access for Black unemployed workers, and mitigating how well the system can achieve its policy objectives of aiding suddenly unemployed workers and stabilizing the macroeconomy.
A key concern dating back to the founding of the unemployment insurance system is its decentralized structure, which leaves considerable autonomy in setting rules on eligibility criteria and benefit amounts to each state, as well as the District of Columbia, Puerto Rico, and the U.S. Virgin Islands. This means that unemployed workers with the same work history, such as the same earnings before job losses, and the same reasons for separation from their last employers, can receive less unemployment insurance in some states than in others. Our recent research, available as a working paper, finds that these differences in state rules contribute to racial inequities in the amount of Unemployment Insurance accessible to Black claimants, and sacrifice the overall efficiency of the UI program.
Our research exploits administrative data from the federal audit program of the U.S. Department of Labor, the Benefits Accuracy Measurement. This data allows us to construct a representative sample of claimants since 2002, in all U.S. states and territories (except for the U.S. Virgin Islands), which includes claimants’ demographic information, work history, and the amount of Unemployment Insurance they received, if any.
Importantly, this dataset contains information on all individuals who filed a claim, whether they received or were denied Unemployment Insurance. This dataset is unique: it contains more reliable information about work histories and unemployment insurance than in survey data, and it covers individuals across virtually all U.S. states and territories, unlike in standard administrative data.
We document a large racial gap in the outcome of unemployment insurance claims. Sixty-one percent of Black claimants and 76 percent of White claimants were deemed eligible for unemployment insurance payments. Therefore, when accounting for eligibility denials, the Unemployment Insurance system replaced, on average, just 29 percent of Black claimants’ wages compared to 36 percent for White claimants. This amounts to a racial 18.3 percent gap in the replacement rate.
We analyze the factors that contribute to this racial gap. First, Black claimants have less favorable work histories when they lose their jobs. For instance, they have generally received lower earnings in the preceding quarters. Second, states with a larger share of Black workers have more stringent rules overall. It implies that even if Black and White claimants had exactly the same work histories on average, Black claimants would still receive a lower replacement rate, only because they are exposed to these more stringent state rules.
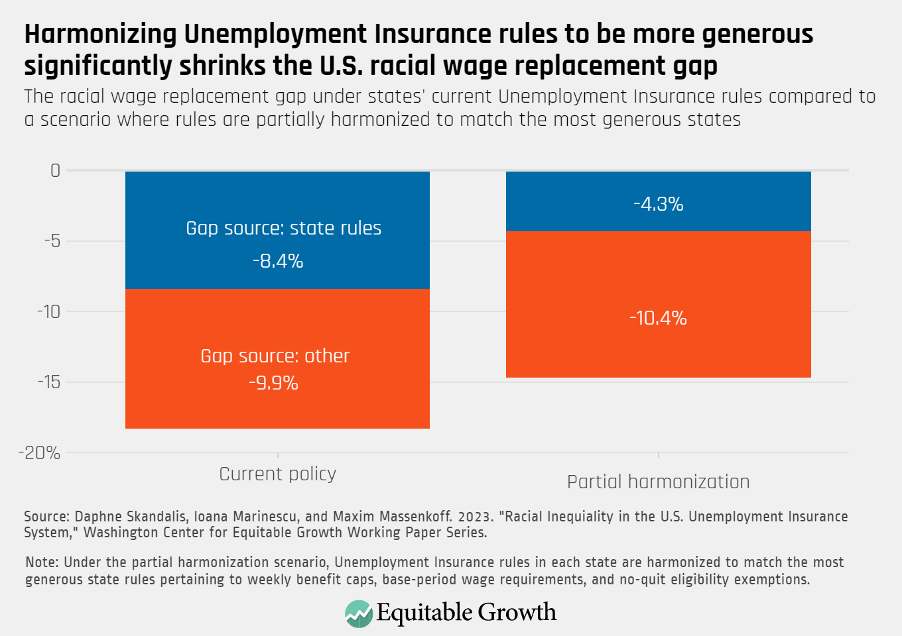
How much do differences in state rules alone contribute to the racial gap in replacement rate? After accounting for claimants’ work histories, we estimate that the differences in state rules (considering all dimensions of rules) cause Black claimants to have an 8.4 percent lower wage replacement rate than White claimants. Therefore, state rules differences are responsible for almost half of the total racial 18.3 percent gap. (See Figure 1.)
Figure 1
Importantly, these differences have nothing to do with potential racial differences in pursuing UI claims. Even if all unemployed workers claimed Unemployment Insurance, state rule differences would impose a similar penalty on Black claimants.
We then focus on three specific types of UI rules that are particularly salient: the minimum earnings required for eligibility, the possibility to be eligible after quitting one’s last job with a good reason, and the cap on the maximum weekly benefits amount. Based on our estimations, only harmonizing these three rules to the level in the most favorable state would shrink the overall racial gap—as well as the portion of the gap caused by state rules—by about 4 percentage points, as shown in Figure 1.
After showing that differences in unemployment insurance rules across states generate racial inequality, a key question is whether they represent an efficient response to differences in local economic conditions. In that case, these differences across states could help the unemployment insurance system reach its policy objectives, despite creating racial inequality.
To answer this question, we consider what would happen if all states and territories marginally increased the levels of their Unemployment Insurance. We compute for each state both the social costs and the social value that this would generate. We take into account all the relevant local economic factors, such as the average drop in income that people experience after losing their jobs, the average rate of unemployment, and the typical response to increases in UI benefits. We find that the social costs of expanding Unemployment Insurance would be lower in states with a larger fraction of Black claimants while the social value would be larger.
Our results demonstrate that increasing the amount of Unemployment Insurance would be especially beneficial on net in states with a larger fraction of Black claimants. The current situation where states with a higher share of Black claimants have less favorable UI rules is, therefore, inefficient in addition to inequitable.
Altogether, our findings show that the large disparities that exist in state UI rules generate racial inequality in the access to unemployment insurance, as well as inefficiency. Having more harmonized rules across states, for instance by setting higher minimal standards at the federal level, could both reduce racial inequality and increase the efficiency of the Unemployment Insurance system. More generally, our findings show that ostensibly race-neutral policy designs can disadvantage racial minorities. Identifying and addressing racial gaps in policies is critical for tackling racial inequality.
— Daphné Skandalis is an economist at the University of Copenhagen. Ioana Marinescu is an economist at the University of Pennsylvania, and Maxim Massenkoff is an economist at the Naval Postgraduate School.
When it comes to understanding the costs of gun violence in the United States, many people rightfully focus on the human cost. People who are slain or take their own lives, their family members who suffer in the aftermath, and the communities afflicted by their losses are often centered in media coverage and conversations about gun violence. Yet whether caused by a mass shooting, assault or homicide, act of suicide, or police shootings, we all pay for the costs of gun violence in expected and unexpected ways.
In fact, the human toll of gun violence is so pervasive that its consequences permeate nearly every facet of U.S. society, including economics. Examining the economic consequences of gun violence, however, is not intended to put a price on human life. Rather, the aim is to provide a deeper understanding of just how extensive and ubiquitous gun violence is in the United States.
It is near impossible to sum up all of the monetary costs of gun violence in the United States. Estimates attempting to do just that have ranged from $229 billion to $280 billion, and all the way up to $557 billion per year. Such a wide range is not much of a surprise, considering the lack of reliable data and different assumptions that go into making these calculations.
All of these numbers, however, fail to encapsulate the total cost. This includes the psychological costs of gun violence, such as the emotional burdens of living in fear and the ongoing traumas experienced by individuals and communities. Then there are the indirect monetary costs that are often unaccounted for, such as lost investments and business opportunities, as well as macroeconomic harms. As a result, any overall estimates or numbers are more likely to be a lower-bound estimate rather than a complete picture.
What makes an accounting of the economic costs even more challenging is that holistic data on the economic cost of gun violence is hard to come by. There are few comprehensive studies, limited public and private funding, and some limits on how much data can be released to the public. Compounding these problems is the politicization of gun violence, reflected in the legislative fight over directing resources just toward studying the issue.
Indeed, the so called Dickey Amendment, first instituted in 1996, prevented the U.S. Centers for Disease Control and Prevention from using any funding “to advocate or promote gun control,” essentially shutting down government research on the topic until Congress clarified the law in 2018 and funding was first allocated in 2019. The result is that we’re left piecing together what few studies do exist, limitations and all, to try and get a better sense of how much gun violence costs our country.
Academics and policymakers alike may be lacking data on measuring these costs and understanding how much value our society loses to gun violence, but we do know some of the root causes behind certain components of gun violence. For instance, research finds that income inequality, concentrated poverty, underfunded public housing, under-resourced public services, and underperforming schools are all conditions that tend to increase the likelihood of gun violence within a given community.
Moreover, increases in deaths at the hands of White supremacists and related extremists, easy access to guns, lack of strict regulations, the loneliness epidemic, and police violence all play a role in continuing and escalating the vicious cycle of gun violence we see in the United States.
This issue brief can’t explore all of these causes in detail. But it is important to remember that many of the costs outlined below fall on all of our society via public funding being directed toward security infrastructure for schools instead of other educational programs, reduced tax base due to limited business activity in areas suffering from gun violence and crime, and funding from federal government, states, and localities spent on healthcare costs for those who are uninsured. What’s more, gun violence reflects and worsens racial and income inequalities. Black Americans, for example, are 10 times more likely than White Americans to die by gun homicide, and young people are more likely to die from gun violence in areas where poverty is more highly concentrated.
This issue brief examines different areas where the economic costs of gun violence have been most completely measured in order to provide a comprehensive look at where the costs come from and their impact on U.S. society. Specifically, I look at the cost of gun violence as it relates to:
Healthcare
Employers and businesses
Wages and human capital
Communities
I then conclude with a look at the need for more timely studies to be conducted, more data to be collected, and more public and private funding dedicated to researching this problem. These are just some of the necessary steps to get a more holistic understanding of the scope of the problem and inform future evidence-based policymaking to address the issue.
Healthcare costs
Some of the biggest monetary costs that gun violence imposes on our society are related to healthcare. Trips to the emergency room, ambulance rides, inpatient care, physical therapy, and ongoing emotional and mental trauma that survivors must endure all add up to significant sums of money. Similar to overall estimates, the healthcare-related costs of gun violence fail to encapsulate the true costs. This is due to a variety of reasons, most notably because many survivors of gun violence face barriers to receiving the care they need—due to the cost of care or access to care—or choose not to seek medical assistance.
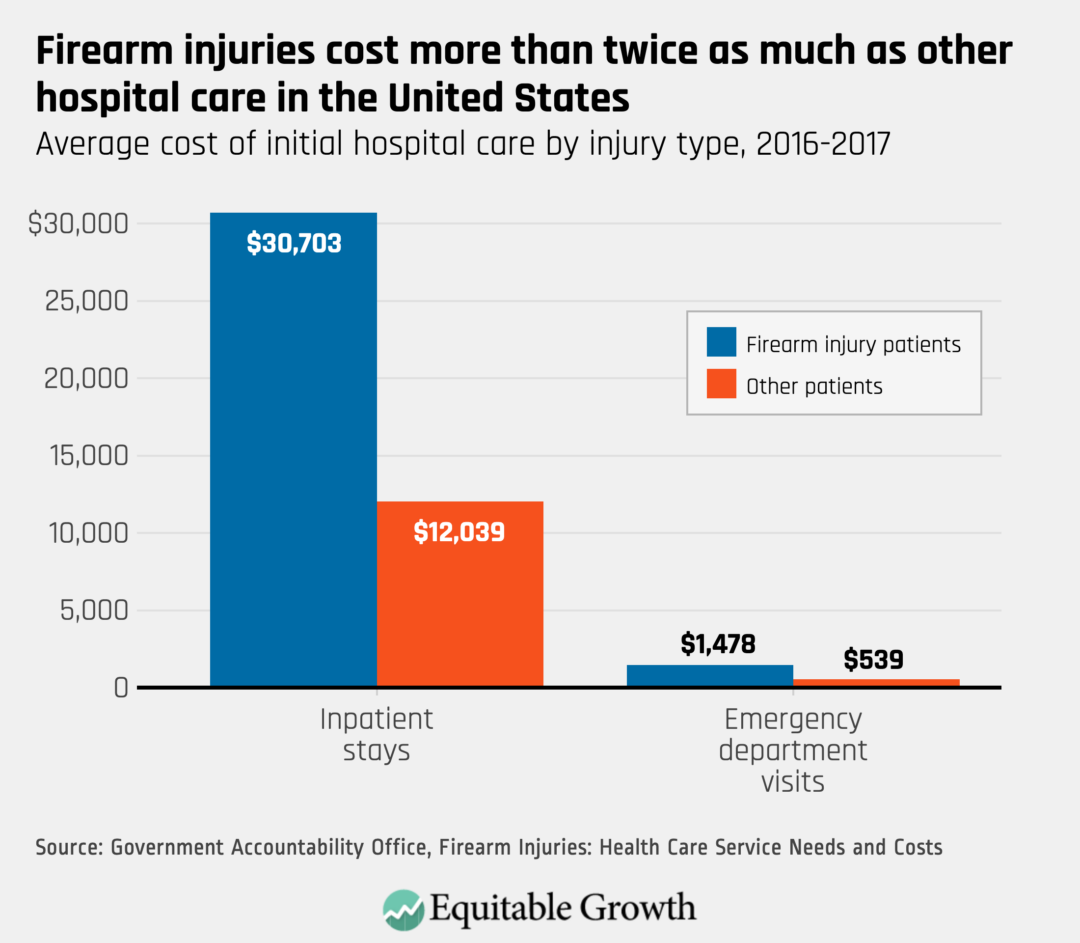
Inpatient stays are the main driver of healthcare costs. One recent study finds that more than 90 percent of initial hospital costs from 2016–2017 were driven by inpatient stays, even though they are less common than those who only received treatment in emergency rooms. That same study also finds the average cost of initial treatment for a gunshot wound—either in an emergency room or inpatient care—was more than twice the average cost of treating other patients.
Looking at this data more closely, one study found that from 2010–2015 the average annual cost of inpatient hospitalizations for firearm injuries exceeded $900 million. Another study found annual inpatient costs averaged more than $700 million between 2006 and 2014. (See Figure 1.)
Figure 1
For fatal firearm injuries, the costs are relatively straightforward. Data from the U.S. Centers for Disease Control and Prevention from 2020 shows that fatal firearm injuries cost a total of $290 million, with an average cost of $9,000 per patient. But for survivors of gun violence, the ongoing costs can multiply exponentially.
One recent study finds that among those who survived a nonfatal firearm injury between 2008 and 2018, medical spending increased by $2,495 per person per month—or 402 percent—compared to peers who weren’t exposed to gun violence. That same study finds most of this increase is within the first month after surviving a shooting, when per person costs increased by an average of $25,554. Up to 16 percent of those who experienced a firearm injury required readmittance, facing an average cost of $8,000 to $11,000 per patient. Between 2010 and 2015, approximately one in six patients with a firearm injury was readmitted within six months, with costs exceeding a total of $500 million over that time span.
Another method used to encapsulate the ongoing cost of gun violence on people’s well-being are quality-of-life costs. The loss of quality of life represents the present value of a victim’s life that was either cut short or permanently damaged by gun violence, and usually excludes the cost of medical care and lost work. One estimate put this cost at $169 billion per year in 2015, but more recent estimates indicate this number has ballooned to approximately $489.1 billion.
It’s worth noting there is a lack of contemporary studies looking at the total lifetime costs of injuries caused by gun violence. Any studies that currently exist are so outdated they’re no longer a reliable indicator of the totality of healthcare costs due to gun violence. This highlights the need for an ongoing collection of data over time to get a more complete sense of the true scope of healthcare related costs of gun violence. (See sidebar.)
Longer-term healthcare costs of gun violence
While there hasn’t been much research into the total lifetime cost of gun violence, there has been research looking at some of the longer-term healthcare costs—most notably related to mental health and the families of survivors.
One recent study finds that nonfatal firearm injuries lead to increases in psychiatric disorders, substance use disorders, and healthcare spending and use in the month immediately after the injury. Another recent study finds similar trends among gun violence survivors, but with an additional 40 percent increase in pain diagnoses and an increase in the use of pain and psychiatric medications. A third study finds that children who were exposed to a fatal school shooting in their area led to a 21 percent increase in antidepressant use in the two years following the incident.
As of 2015, the estimated direct cost of mental health-related expenses totaled $410 million annually. It is worth noting that this estimate has almost certainly increased commensurate with the increase in gun violence, and it would be even higher if all victims and families could afford or desired to seek out counseling.
These mental health costs also spread to more people than just immediate survivors. Family members experiencing gun violence had a 12 percent increase in psychiatric disorders compared to families who did not. Some gun violence survivors have injuries so severe that family members are compelled to become caretakers, therefore forgoing educational, professional, and economic opportunities. This in turn not only causes lost sources of income among the entire family, but also a general diminishing of quality of life among family members.
Disparate impact on low-income people and people of color
Much like other costs of gun violence, healthcare costs incurred from gun violence have a disproportionate impact on low-income people and people of color. This starts with the location of gun violence itself. Residents in the lowest income zip codes are approximately twice as likely to be admitted to an emergency room or hospital for a firearm injury. As median incomes increase, gun injuries decrease.
One study found that about 41 percent of initial hospitalization costs for gunshot wounds in 2006–2014 were for patients covered by Medicare or Medicaid. That same study also found that shooting victims who are covered by Medicaid had the highest per incident costs, averaging more than $30,000 per initial hospitalization—$7,000 more than privately insured patients. More recent studies corroborate these findings, with Medicaid and other public coverage accounting for more than 60 percent of annual costs of care related to gun violence in 2016–2017.
This situation is even bleaker for those who do not have insurance. Victims of firearm assaults are disproportionately more likely to be uninsured, and trips to the emergency room and hospital admissions for the uninsured occur nearly three times more often and more than twice as often, respectively, compared to the national average. Unfortunately, many who are uninsured then struggle to pay their hospital bills. The U.S. Department of Health and Human Services found that only 12 percent of uninsured families could pay their hospital bills in full, and that uninsured people with incomes above 400 percent of the Federal Poverty Level could only fully pay for 37 percent of their hospitalizations.
Employers lose approximately $535 million per year in direct costs from gun violence due to lost revenue, time spent adjusting schedules to cover for lost work, and training new replacements for vacancies. Businesses that rely on customer interactions, most notably the retail and service sectors, may see their revenues drop faster than other businesses due to patrons shopping in safer communities to avoid the threat of gun violence.
These issues are compounded by owners facing trouble hiring employees willing to travel through or work in communities plagued by gun violence. These factors cause many businesses to close their doors outright, but those which stay open often incur costs on items such as camera systems, bulletproof windows, motion sensor lights, barred doors, and security staff. Spending money on security measures such as these prevent entrepreneurs from investing that money elsewhere in their businesses or communities.
But the costs incurred by businesses exceed changes to physical infrastructure. Many entrepreneurs choose to open their businesses in safer neighborhoods, representing lost economic value in communities plagued by gun violence. Fear of gun violence also stops people from shopping in a certain neighborhood at night, if they even decide to shop there in the first place. Other studies also found that crime and fear of crime adversely impact retail development and limit business activity and revenues.
Indeed, a more recent study finds that sudden surges in gun violence is associated with as much as a 4 percent reduction in new retail and service establishments in major cities across the country. That same study also finds that one additional gun homicide in Minneapolis in a given year results in 80 fewer jobs the next year.
This loss of revenue has broader implications beyond individual businesses. Phenomena such as enduring neighborhood segregation and increased crime lead to lower tax revenues, in turn impacting economic mobility. For instance, one recent study finds that reduced tax revenues from property taxes reduces public safety expenditures per capita, and reduced school expenditures leads to less spending per pupil. This adds up to fewer opportunities for individuals and families living in these communities to benefit from economic mobility.
Many communities struggling with gun violence also suffer from myriad other disadvantages, many of which lay the groundwork for more gun violence to take place. Systemic lack of investment in historically underfunded neighborhoods and cities, income inequality, limited economic opportunities, concentrated poverty, underperforming schools, lack of access to food, shortage of affordable housing, and police violence all play a role in perpetuating the vicious cycle of gun violence. Indeed, 26 percent of firearm homicides in 2015 in the United States took place in U.S. Census Bureau tracts that contained only 1.5 percent of the population.
Impacts on human capital and wages
Gun violence has an overall negligible impact on productivity. Typical measurements of productivity only account for regular production through labor market earnings and household production. But victims of gun violence engage in other activities outside of the market and household, both for better and for worse. Some positive examples include volunteering for local organizations or caregiving for family members and friends. On the flip side of this coin, data from Washington, DC indicates that about 86 percent of homicide victims and suspects were known to the criminal justice system in some way due to previous property crimes, drug crimes, or unarmed violent offenses.
One of the biggest costs of gun violence is lost wages. This can be defined as the value of work an individual is unable to do as a result of injury, disability, or death. Calculations for this also include wage equivalents for unpaid household and caregiver work on behalf of victims. A 2015 estimate found that the U.S. economy loses approximately $49 billion every year in lost wages, and by 2022 this increased to $53.77 billion due to gun violence. Considering individuals living in households with a median income of less than $44,000 per year account for 6 in 10 nonfatal firearm assault injuries, these lost earnings have a disproportionate impact on people who are already struggling to make ends meet.
Economic impact of school shootings
When it comes to gun violence, few things garner more attention than a mass shooting at a school. The results of these events are traumatic, and they too impose tremendous monetary costs on our society. The school shooting in Uvalde, TX in 2022 cost an estimated $244.2 million alone, including direct and indirect costs related to healthcare and lost wages respectively. Just like other costs of gun violence, the costs of both physical alterations to schools to increase safety and negative educational consequences that come from school shootings have a ripple effect on survivors and communities.
School shootings have a lasting impact on students who survive them. One recent working paper finds that surviving a school shooting increases rates of absenteeism and grade repetition, reduces the likelihood of graduating high school by 4 percent, reduces the likelihood of attending college by 10 percent, reduces the likelihood of graduating college by 15 percent, and decreases employment rates and earnings at ages of 24 and 26.
Other studies find similar results, both in the United States and abroad. Research also finds that school shootings decrease retention rates among teachers and support staff in the years following a shooting. These effects show up in schools across the country. Schools in Texas that experience a shooting see a 12 percent increase in absences, 28 percent increase in chronic absenteeism, and the rate of grade repetition more than doubles. High school students in California who remained enrolled in school after experiencing a shooting had lower standardized test scores, and students who survived the Sandy Hook shooting registered decreased test scores in math and English.
Other reports indicate that schools spent more than $150 million in federal dollars on school safety and security since 2018, and at least $811 million for security guards in school districts since the mass shooting at Columbine High School in 1999. This nationwide trend is occurring at the state and local level. Approximately 90 percent of U.S. school systems made security enhancements in the three years following the Sandy Hook shooting in 2012. This spending places an undue strain on state, local, and individual school budgets, diverting funds away from educational efforts and toward increasing school security measures.
Broader, community-level costs
Many of the costs imposed on our society by gun violence can be calculated, however imprecisely, but there are lots of other knock-on effects that are difficult to capture.
One example are costs associated with the U.S. criminal justice system. Lawyers for courtroom hearings, court administrative staff and processing, filling prisons with people, and police responses and investigations are all tangible costs caused by of gun violence. One estimate finds that these criminal justice costs totaled $11.01 billion per year. Another study found that $5.2 billion alone comes from long-term prison costs for those who commit assault or homicide with a firearm.
These costs are necessary in order to ensure people who commit harm to others with a firearm are prevented from continuing to do so. Yet a fundamental reason why these costs are so high is the easy access to guns and the sheer volume of guns currently in circulation in the United States. A nation awash in guns increases the likelihood that violent situations become more lethal and land more people in the criminal justice system. A domestic abuser with access to a firearm, for example, makes it five times more likely that a woman will be killed.
Other indirect costs from gun violence impact wealth inequality through a variety of facets. There are severalstudies, for example, showing links between increasing crime rates and decreasing property values and other negative consequences. While these studies look at the overall crime rate, it’s worth remembering the prevalent role of firearms when crimes are committed. While this research sheds light on some of the negative impacts of gun violence, there’s less information exclusively examining the broader impact of gun violence on communities.
One study found that surges in gun homicides slowed home value appreciation by 3.9 percent across multiple U.S. cities and led to decreased credit scores in certain census tracts. More specifically, it found that each additional gun homicide in 2014 was associated with:
A $22,000 decrease in average home values in Minneapolis census tracts and a $24,261 decrease in Oakland, CA census tracts
A 3 percent decrease in homeownership rates in Washington, DC
A 20-point decrease in average credit scores in Minneapolis census tracts and a 9-point decrease in Oakland, CA census tracts
That same study also found that increased rates of violence led to higher rates of relocation away from the area, therefore increasing vacancy rates and lowering home prices due to absentee homeownership.
Because the United States relies on homeownership as a primary means of wealth-building, the negative impacts on housing values caused by gun violence in these communities affects the wealth generation of people living in those areas. Indeed, homeownership among Black families makes up an even greater share of household wealth than other families. Combined with the enduring consequences of redlining and other forms of racial discrimination in housing markets, this reliance on homeownership for wealth generation exacerbates the wealth gap between Black and White families. For Black families living in communities with high rates of gun violence, their main form of wealth accumulation is increasingly compromised.
The indirect, negative consequences of gun violence aren’t limited to just housing and credit scores. The overarching fear of crime and gun violence, and people’s perceived risk of gun violence, has been shown to impose a wide range of social and psychological burdens and costs. The emotional burden of fear weighs on everyone in a community—residents, employees, and visitors alike. Costs such as these are hard to calculate and don’t typically make the headlines, but they have a very real and tangible impact on the people who live in communities plagued by gun violence.
The costs of gun violence to the U.S. economy and society outlined in this issue brief are only the tip of the iceberg. More needs to be done to get a more all-encompassing picture of the complete cost that gun violence inflicts on the United States. More timely studies must be conducted, more data needs to be collected and released, and more public and private funding needs to be dedicated to researching this deadly problem. A concerted effort among public and private stakeholders to help fill the void of recent, timely research and data on the costs of gun violence would help U.S. policymakers and academics alike get a complete understanding of how pervasive the costs of gun violence can be.
Simply collecting more data on the economic costs isn’t a replacement for taking more substantive, direct action to reduce gun violence. The availableevidence on the immediate human consequences today are clear, and there are current policy prescriptions on the table for enactment.
Both Congress and the Biden administration are offering concrete steps to address the issue. The Bipartisan Safer Communities Act would expand background check requirements, broaden restrictions on gun ownership, and provide incentives for states to pass Extreme Risk Protection Order laws, which allow groups to petition courts to remove weapons from people deemed a threat to themselves or others. Recent executive orders from the Biden administration would increase the number of background checks, accelerate federal law enforcement’s reporting of ballistics data, and provide more information on licensed firearms dealers who violate the law.
These are steps in the right direction, but more can be done. The already available evidence clearly demonstrates the direct human consequences of gun violence on everyday citizens and should spur policymakers into action.
Many policymakers, of course, understand the moral urgency to act to end gun violence. But their knowledge and understanding of the problem can be deepened to create a more holistic understanding of the issue, create more informed evidence-based policymaking going forward, and then have reliable metrics at hand to understand whether and how these policy actions are resulting in better U.S. economic and societal outcomes.
U.S. consumers generally believe that gig workers who labor for companies such as Uber Technologies Inc. and Lyft Inc. are free to set their own hours and thus able to determine broadly how much they will earn while ferrying passengers to and from their different destinations. Consumers of these services make a series of assumptions based on shared knowledge of how employment arrangements in the United States work or should work.
Riders probably assume, for example, that the longer gig workers labor at the wheel, the more they will make per hour, and that skills acquired over time mean that these workers can improve their hourly pay because, say, they can learn what areas and times are lucrative or how to game the algorithms.
But, as it turns out, these assumptions do not pan out. Gig work is far from flexible. Gig workers are highly “incentivized” through pay structures to work at specific times. Not working at those times or in the ways that Uber and Lyft want their contract drivers to work can result in them losing money, instead of earning it.
Using data extracted from drivers’ labor and then fed into machine-learning technologies, these companies can personalize base pay and the opportunities to raise base pay. This may sound like a rewards system for individual hard-working gig workers, but in fact because every gig driver is ostensibly an “independent contractor,” the two companies can drive down individual pay while maximizing their own corporate profits.
Counterintuitively, according to Uber’s own research, workers who labor for longer typically make less per hour. So even if drivers are working at the same time, with the same skills, in the same places, they may earn vastly different amounts.
Though economists and policymakers alike are used to discussing these dynamic algorithmic practices in terms of consumer pricing, these wage-setting practices have real and harmful effects on workers, too. Gig platform companies make a point of describing how their “surge pricing” makes good business sense for themselves and their customers. Yet their individual “surge payments” to their drivers—alongside any number of other wage products such as “bonuses” and “quests”(gig work-speak for complying with the companies’ rules to increase your base pay) results in unpredictable, variable, and personalized hourly pay that upends our legal and social expectations of “equal pay for equal work.”
Indeed, gig drivers often describe their experience of these algorithmic systems explicitly in terms of gambling. They are always hoping they will “hit the jackpot” with a high-paying trip while the app tries to trick them by giving out just enough rides to keep them on the road.
My new working paper, “On Algorithmic Wage Discrimination,” is the result of my almost decade-long ethnographic research on gig drivers in the San Francisco Bay Area. Among other things, I find that the digital, black-box structure through which wages are set among these workers results in unpredictable and variable pay, often changing from person to person and hour to hour.
Workers described the opaque, unpredictable, and variable pay practices to be fundamentally unfair and harmful. I argue that they are also fundamentally at odds with U.S. legal and cultural views of fairness at work. Digitally variable, personalized pay represents a historical rupture in how wages are determined, how work is coordinated, and how income is distributed between employees and employers arising from the data-driven logic of informational capitalism.
How should policymakers respond? I propose a non-waivable ban on the practice of algorithmic wage discrimination. This could include a ban on digitally determined pay per ride or on digitally personalized pay more broadly. Such a ban would put an end to the gamblification of work and the uncertainty of hourly wages that are endemic to the on-demand sector. And a ban also would disincentivize certain forms of data extraction and retention that may harm low-wage workers down the road, addressing the urgent privacy concerns that others have raised.
Similar to proposed bans on targeted advertising, which attempt to limit the use of personal data to make money from targeted ads, a peremptory ban on algorithmic wage discrimination might also disincentivize the growth of fissured workplaces under informational capitalism. If firms cannot use algorithmic gambling mechanisms to control worker behavior through variable pay systems, then they will have to find ways to maintain flexible workforces while paying their workforce predictable wages under a fair employment model.
This kind of ban is not without precedent. The spirit of a ban on algorithmic wage discrimination is embedded in both federal and state level antitrust laws, as I argue in my working paper. If workers are consumers of on-demand ride-hailing companies’ technology—as these companies claim—and not their employees, then digitalized variable pay in the on-demand economy violates the spirit of the 1936 Robinson-Patman Act, which was enacted to prohibit anti-competitive price discrimination.
Towards Justice, a non-profit legal organization, recently sued Uber and Lyft under California state antitrust laws, alleging violations of the state’s Cartright Act (the rough equivalent of the federal Clayton Antitrust Act) and California Business and Professions Codes that prevent secret commissions and other fraudulent practices. But enforcement actions such as this will take years and may not prevent these practices from migrating to other sectors. Hence, I propose a ban.
The precise limits of a proposed non-waivable ban need to be explored, and many questions remain in the statutory construction of such a ban and in its coverage, among them:
Should such a prohibition be limited to companies with a controlling market share, as Fordham University School of Law’s Zephyr Teachout suggests?
Should the ban only rule out digitalized variable pay between workers, but still allow a company to use algorithmic assessments to change how much it pays workers as long as those changes are applied to everyone?
Should the ban prevent the use of digital bonuses entirely, or would it allow such bonuses only if they were offered consistently to all workers?
Should such a law or regulation cover all digitalized variable pay practices across industries?
Notably, this is not a problem that U.S. employment law (in its current form) alone solves. If these workers for gig platform companies were classified as employees rather than independent contractors then they would be able to demand a wage floor, overtime compensation, and the right to organize a union. But given the low minimum wage and statutory carveouts for “waiting time,” Uber and Lyft as employers would still be able to use personalized pay to incentivize and control worker behavior.
Indeed, the core motivations of these companies to use algorithmic wage discrimination—labor control and wage uncertainty—could apply to many other forms of employment. Gig nurses, for example, could be offered different payments than their colleagues for the same work, at the same place, based on what the hiring platform knows about how much these nurses were willing to accept for previous assignments, or what they know about their debt and other financial obligations.
Or consider computer scientists laboring as employees for a company that uses software to monitor worker activity. They might have their pay manipulated according to the data extracted from their labor—in ways and for reasons that are invisible and unknown to them.
The United States boasts a clear legal tradition and social expectation of equal pay for equal work, which algorithmic wage-setting violates. Lawmakers and regulators need to examine the harms of these practices. There are still many details to figure out about how to implement a statutory or regulatory ban on algorithmic wage discrimination, but such a ban would remove some of the most egregious pay practices and be a step toward predictable, transparent, and fair pay.
What does economic growth look like along the income distribution?
This post was updated on July 11, 2023.
Gross Domestic Product, or GDP, is the constant go-to economic indicator that news anchors and U.S. Members of Congress alike love to dissect. Reading quarterly reports from the U.S. Department of Commerce’s Bureau of Economic Analysis on GDP growth is a form of divination that, in popular imagination, tells us whether the economic fortunes of the United States are trending up or down. Strong GDP growth is considered evidence of good fortune for all Americans under the presumption that “a rising tide lifts all boats.”
This presumption is mistaken. Aggregate GDP growth may once have indicated good fortune for most Americans, but over the past several decades many Americans have been left behind as growth increasingly tilted toward the rich. This reality makes GDP a misleading statistic for the opinion leaders and politicians who rely on it. The consequence is that policymakers’ diagnoses of the U.S. economy, and their prescriptions for what ails it, are based on the wrong metric.
The good news is that the data and the statistical know-how are now available to fix the problem. The Bureau of Economic Analysis, or BEA, now publishes its Distributing Personal Income data series, which reports on income growth for every decile of income and the top one percent. This data set is still considered a prototype by the agency, but with further investment and refinement, these statistics will allow policymakers to evaluate how the U.S. economy is performing for the working class, the middle class, and the affluent.
GDP 2.0 is Equitable Growth’s name for accounting for inequality in the national accounts, a project that the Bureau of Economic Analysis is now executing on in its Distributing Personal Income prototype series. This prototype data makes it easy to see, for the first time, how the U.S. economy is performing for those at the bottom, middle, and top of the income distribution. Although BEA’s current dataset is an excellent start, there is more to be done.
The current BEA Distributing Personal Income prototype series has a number of excellent features, including a breakdown by types of income and metrics for income before taxes and transfers as well as after taxes and transfers. But for this prototype to become the go-to economic growth metric it needs to replicate more features of the aggregate GDP metric, which became a standard of policy debate because estimates are frequent, timely, and elevated in major agency news releases.
GDP 2.0 will have a significant impact on how U.S. economic policy is discussed and what economic policy is implemented. Specifically, it will:
Connect the idea of aggregate economic data with the real-life circumstances of families in the economy
Focus the attention of the nation on improvements in the economic well-being of families, which is what growth is supposed to deliver
Guide policymakers in designing policies that produce broad-based growth
Allow citizens to hold their elected representatives accountable to delivering an economy that works for all
This column explains why standard GDP growth is insufficient for understanding our modern economy, why measurement is an important first step for better economic policy, and the current status of progress toward GDP 2.0. It concludes with suggested actions that both Congress and the executive branch could take to make GDP 2.0 a reality. These are:
Congress should continue to fully fund this work at the Bureau of Economic Analysis.
Congress should pass a data synchronization bill to expand BEA’s access to IRS tax return data.
The U.S. Department of Commerce should request funding to expand and improve the current BEA data series so it can leave the prototype phase of development.
The Bureau of Economic Analysis should attempt to improve the timeliness of the data. Currently, it is released annually on about a one-year lag. Sub-annual releases and lower reporting lags should both be investigated.
Who benefits from economic growth?
The National Income and Product Accounts were devised in the 1930s, the result of a concerted effort by many economists to better quantify economic output. Simon Kuznets was primarily responsible for their development in the United States and later won a Nobel Prize in economics in 1971 for his work. Gross Domestic Product, a part of those accounts, was a tool well-adapted to the economic problems of the mid-20th century United States. It allowed economic policymakers to understand the vast depth of the Great Depression and highlighted the need for bold action. Similarly, it served as a guide in World War II, providing some indication of how many planes and boats and tanks we might plausibly manufacture if the full resources of the nation were focused on the task.
These are no longer the only economic questions the nation needs answered. In an era where inequality has swelled to levels approaching the Roaring Twenties, elected officials need to know who is prospering from economic progress so they can manage the economy for broad-based growth that benefits all Americans. This need is acute now, because headline GDP growth has become unmoored from the economic fortunes of many Americans.
Growth was more equitably distributed between 1963 and 1979 than it is today. Back then, Americans in the bottom 50 percent of the income distribution tended to see the strongest income growth, and other households saw fairly similar levels of growth at a lower level. Starting around 1980, this relationship began to change. In the decades since 1980, most Americans have seen growth in their own incomes that is below GDP growth, and the distribution has become much more uneven. This is possible because the most affluent Americans have seen very high income growth over this time period, which boosts the average. (See Figure 1.)
Figure 1
This divergence between the average and the actual fortunes of families is a problem Kuznets warned about in one of his very first publications about national accounts. In a section of his 1934 report to Congress titled “Uses and Abuses of National Income Measurements,” he noted that, “Economic welfare cannot be adequately measured unless the personal distribution of income is known,” and concluded, “the welfare of a nation can, therefore, scarcely be inferred from a measurement of national income.”
This divergence makes GDP increasingly misleading as a guide to public policy: It does little good to target GDP as an outcome if most GDP growth flows to a small group of families, leaving the rest with scraps. Despite this, politicians continue to fetishize GDP growth, and pundits encourage them. The Trump administration made a campaign issue out of targeting 3 percent growth and sometimes promised to achieve much higher growth.
The pattern of growth shown in Figure 1 has serious downstream consequences. To take just one significant example, Harvard University economist Raj Chetty and his colleagues have demonstrated that absolute intergenerational income mobility has declined precipitously in the United States, and that two-thirds of this decline can be attributed to unequal patterns of growth.
Chetty and his co-authors find that children in the United States used to have a 90 percent chance of earning more than their parents did, comparing parents at age 30 to children at age 30. But by 1980, the chances had dropped to just 50 percent. This is partially due to lower average growth in the decades since 1980, but Chetty’s research finds that it is primarily caused by most income growth accruing to the high end of the income distribution. (See Figure 2.)
Figure 2
Measurement molds policy and steers public debates
The measurements at the center of national policy debates affect both what policies are discussed and what policies are adopted. A central conceit of many recent policy battles is that growth is an unalloyed good, worth targeting without regard for other considerations. The Tax Cuts and Jobs Act of 2017 was sold on exactly these grounds by its primary proponents.
But claims about economic growth are nearly useless without the relevant context that most growth in the modern U.S. economy accrues to the highest income earners in society. With that bit of context, it becomes difficult to understand why policymakers should be targeting growth at all. Surely we should instead look at distributional tables that tell us how people in particular income brackets will be affected by the tax, as Equitable Growth has advocated.
Indeed, trumpeting the impact of the Tax Cuts and Jobs Act on growth only serves to obscure what the distributional table shows: The law will raise the incomes of the wealthiest Americans and will do little for those at the bottom between now and 2027. (See Figure 3.)
Figure 3
Importantly, political scientists find that our headline economic indicators have a big impact on economic narratives. These narratives mislead people about the strength of the U.S. economy. In a 2020 working paper published by Equitable Growth, a team of political scientists find that the overall tone of economic news is driven entirely by the fortunes of the top 1 percent of income earners. Alan Jacobs of the University of British Columbia, J. Scott Matthews of Memorial University, Timothy Hicks of the University College London, and Eric Merkley of the University of Toronto tracked dozens of print newspapers over several decades. They isolated economic reporting and used text analysis to find the overall tone of economic news, positive or negative.
They find that economic news is positive when the very richest members of society are faring well. Yet the tone of the news is not correlated with the fortunes of anyone else. This is not the fault of journalists. The researchers find that journalists rely on aggregate measures such as GDP to ascertain the health of the economy, and GDP no longer follows the fortunes of the average American.
Targeting a common, available metric without adequate consideration of context can lead people down strange paths. An often-repeated example is US News & World Report’s annual Best Colleges rankings. These ratings so dominated the public imagination that colleges became obsessed with improving their ratings. Since the ratings were based on a small set of measurable outcomes, such as graduation rate, class size, and admissions selectivity, colleges quickly found ways to improve their ratings by changing their practices.
This college rankings example shows that measurement shapes outcomes. The metrics that are collected shape the policy options that elected officials consider. The political science research cited above shows that economic narratives in the media are likewise shaped by the available indicators. The U.S. economy has changed enormously since Kuznets first devised the National Accounts in the 1930s. Managing our complicated modern economy requires more context. It requires GDP 2.0.
GDP 2.0: Measuring who prospers when the U.S. economy grows
Academic economists have already provided a working prototype of what GDP 2.0 might look like. Thomas Piketty at the Paris School of Economics, and Emmanuel Saez and Gabriel Zucman, both at the University of California, Berkeley, have published a public dataset they call Distributional National Accounts that uses U.S. tax data to measure the distribution of income in the United States from 1962 onward. Some of the charts in this column use their dataset. Recently, they launched Realtime Inequality, a website that provides estimates that are only a couple of months old on a monthly basis.
But academic datasets are not a long-term solution for the problem. Government statistics are produced on reliable schedules, using standardized methodologies and the best available data. A distributional measure of growth presented alongside the headline GDP growth number would make the report more meaningful to American families who are not currently well-represented by overall GDP growth.
A government-produced dataset is necessary, and the Bureau of Economic Analysis is now producing prototype statistics that break down income growth in the Personal Income national account. The agency has now released statistics showing how personal income growth was distributed between 2000 and 2021. These statistics are already a powerful tool for examining changes in inequality over the past two decades. The BEA’s data includes breakdowns of income growth for each decile of income and the top 1 percent.
Additionally, the Bureau of Economic Analysis reports how incomes are divided between wages, business income, rental income, asset income, and government transfers. This added dimension is useful for analysis. My analysis, for example, decomposing gains in income for the bottom 50 percent of households since 2007 shows that about half of this group’s gains came from increased transfer payments, such as the Earned Income Tax Credit and Child Tax Credit, but especially thanks to the enactment of the Affordable Care Act in 2010. (See Figure 4.)
Figure 4
Figure 4 details that wages accounted for only about 36 percent of gains for this group, suggesting that without government intervention, inequality would have progressed significantly faster. This analysis is useful for forecasting as well. Transfer payments will not continue to expand due to the Affordable Care Act, so absent other new transfer programs, this group may see their fortunes decline in the near future.
Although the BEA data series is already a notable addition to our federal data infrastructure, it can be further improved. Most notably, the data is currently released at a relatively slow pace compared to other national accounts statistics. Distributing personal income is produced once annually, in December, with about a one-year time lag. Provisional 2021 statistics, for example, were released in December of 2022. Prior to 2022, the lag was two years, so BEA has made some progress.
Yet statistics such as aggregate GDP growth and Personal Income growth, which the new BEA data series is based on, are released much faster. These accounts are released quarterly, and lag the quarter they are reporting on by only one or two months in most cases. Although there are data and methodology challenges, there are methods of reducing production time that the agency could explore now.
More work remains to fully implement GDP 2.0
Indeed, although BEA’s prototype is an incredibly important first step, more needs to be done. Both congressional and executive branch action can improve implementation.
Congressional action
In 2022, Congress fully funded the Biden administration’s request for $2.7 million to improve the distributing personal income dataset. Congress must continue to fund the Bureau of Economic Analysis at current levels or higher so that the agency can devote resources to this new initiative. Currently, the dataset is maintained by just two BEA economists. In order to move out of the prototype phase, the agency will require robust funding from Congress.
Congress should also pass a data synchronization bill. Data synchronization is a proposed policy that would allow BEA to receive additional tax data from the IRS. These data would assist BEA broadly in providing timely and accurate economic reporting. They could help BEA make the distributing personal income dataset more accurate by allowing BEA economists to better account for very high incomes.
Executive branch action
The U.S. Department of Commerce should continue to request funds for the Bureau of Economic Analysis from Congress to produce this distributing personal income data series. Commerce should pair this request with concrete plans for the enhancement of the product. BEA should use funds to explore ways to improve the timeliness of the current data series. If currently available data sources are inadequate, BEA and Commerce should detail improvements to our statistical data infrastructure, such as larger survey samples or more frequent survey administration, which would make greater timeliness possible and present those plans to Congress.
The metrics that policymakers use to evaluate the U.S. economy are reflective of what type of success we, as a nation, value. If realizing the promise of the American Dream is important, then adopting GDP 2.0 will align our economic policies with our values. Adding this crucial context to our National Income and Product Accounts is not just a bookkeeping exercise. It’s a way to set new economic goals and guideposts. Without these guideposts, we cannot achieve strong, stable, and broad-based economic growth.
The report presents new data showing how the rate of national private equity acquisitions, while substantial, mask genuinely explosive growth in private equity ownership in specific local and regional markets. This includes 28 percent of local markets where a private equity firm now controls more than 30 percent of physicians, as well as several specialties where more than 50 percent of the physicians work for a single private-equity-owned firm.
These market shares alone are concerning for patients, workers, and payers. But the report also documents that these local markets with a high share of private-equity ownership are more concentrated—even more so than markets with similarly high market shares controlled by non-private equity owners. This is concerning from a competition standpoint because such markets are more vulnerable to anticompetitive conduct. This finding also suggests that private equity firms either target more concentrated markets or more aggressively consolidate physician markets than their non-private equity counterparts.
The consequences are telling. The report documents statistically significant price effects associated with private equity acquisition using a difference-in-differences analysis. In 8 of the 10 specialties studied, the analysis finds increased prices, ranging from 4 percent to 16 percent across those specialties. Looking only at the markets where a private equity firm controls more than 30 percent of the physicians, the report finds price increases of 18 percent in gastroenterology, 16 percent in obstetrics and gynecology, and 13 percent in dermatology.
Simply put, patients, insurers, and employers pay more for physician services when private equity firms take over.
These findings underline the urgent need for policymakers to pay attention to the surge of private equity acquisitions of physician practices. The report recommends a combination of immediate policy steps to close loopholes in antitrust reporting alongside reforms to Medicare payment policies, tax policies, and other areas that private equity firms and others exploit as they consolidate medical-provider markets and monetize medicine. The report also specifies several areas that would benefit from further study.

 post
post