On July 7th, the U.S. Bureau of Labor Statistics released new data on the U.S. labor market during the month of June. Below are five graphs compiled by Equitable Growth staff highlighting important trends in the data.
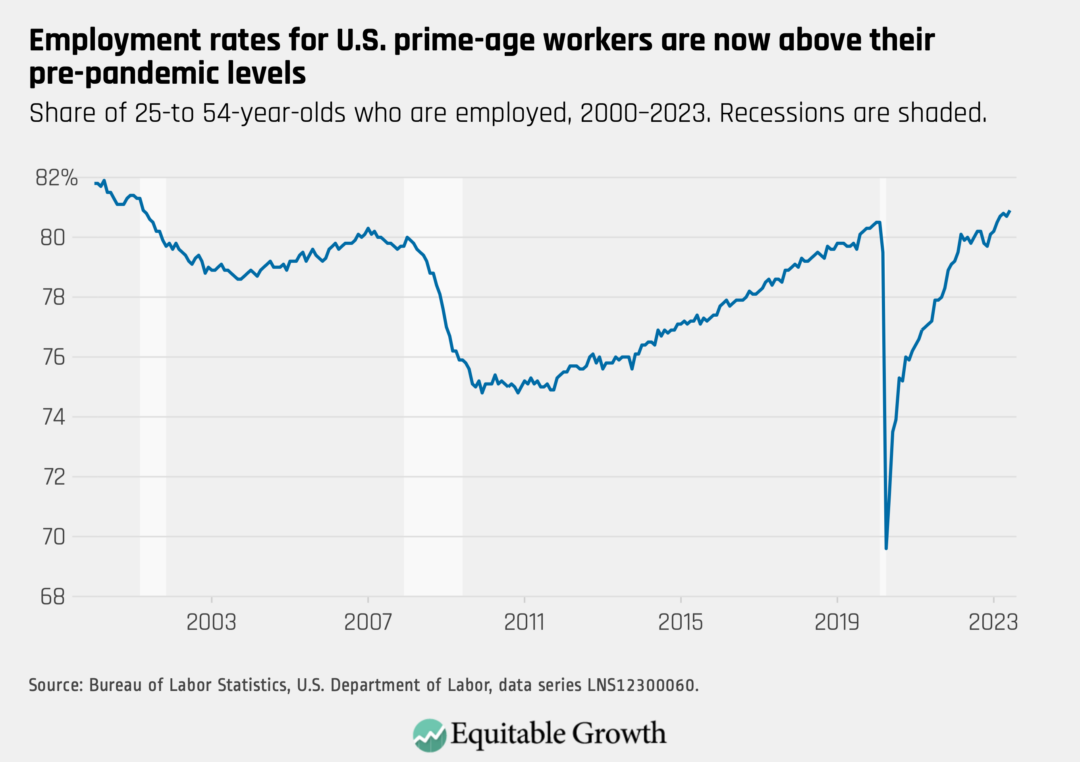
The employment-rate for prime-age workers rose to 80.9 percent in June, it’s highest rate in more than two decades. The U.S. labor market added 209,000 jobs last month.
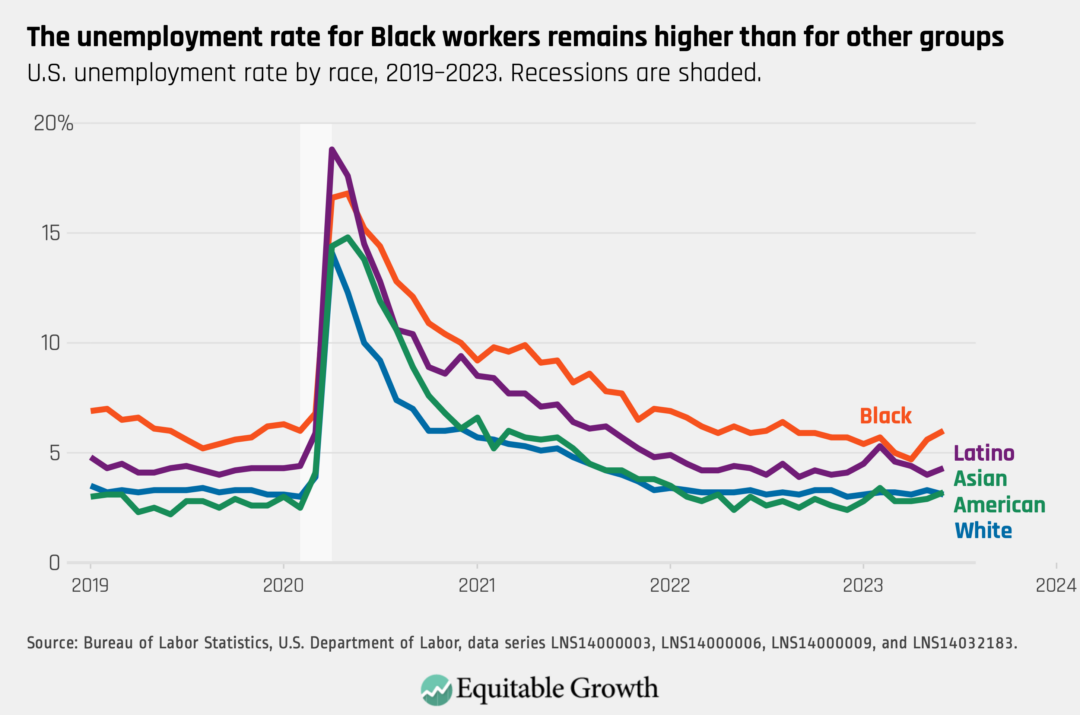
The national unemployment rate fell to 3.6 percent in June, with a decrease for White workers (3.1). Asian American workers (3.2), Black workers (6.0), and Latino workers (4.3) all experienced an uptick in their unemployment rate.
The U.S. economy experienced net employment losses in a few sectors, including retail and transportation and warehousing. Yet those losses were offset by important gains in industries such as construction, and the private education and health services sector, the latter of which added 73,000 jobs last month.
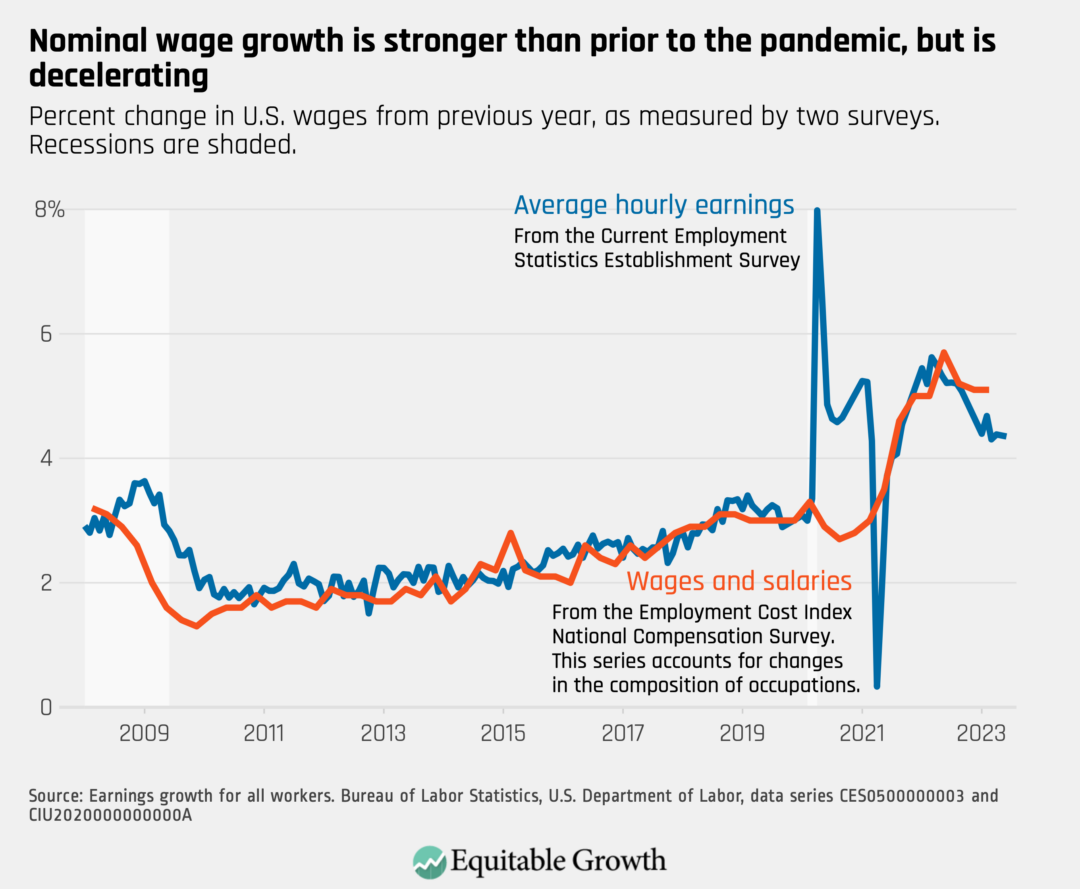
Year-over-year nominal wage growth (not accounting for inflation) remained unchanged in June, with average hourly earnings growth at 4.4 percent over the past 12 months.
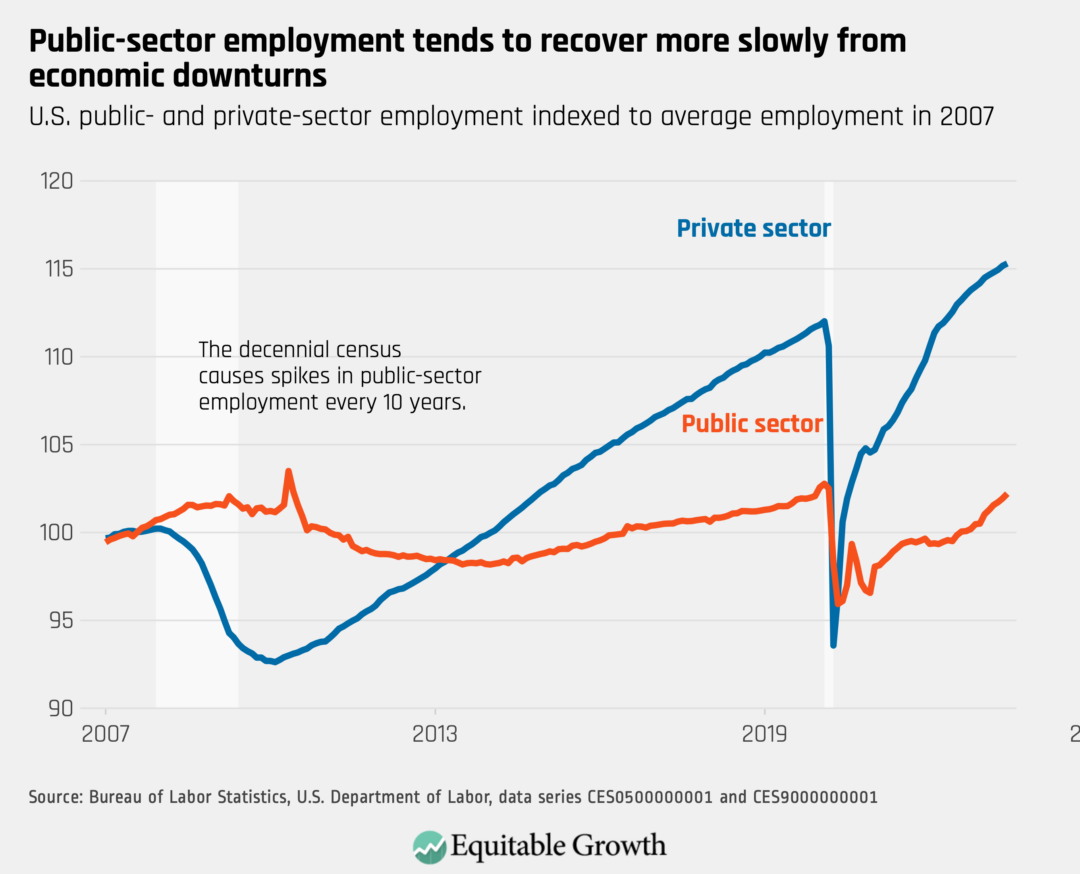
The U.S. public sector added 60,000 jobs last month. Unlike the private sector, however, public-sector employment has yet to fully recover from the COVID-19 recession.
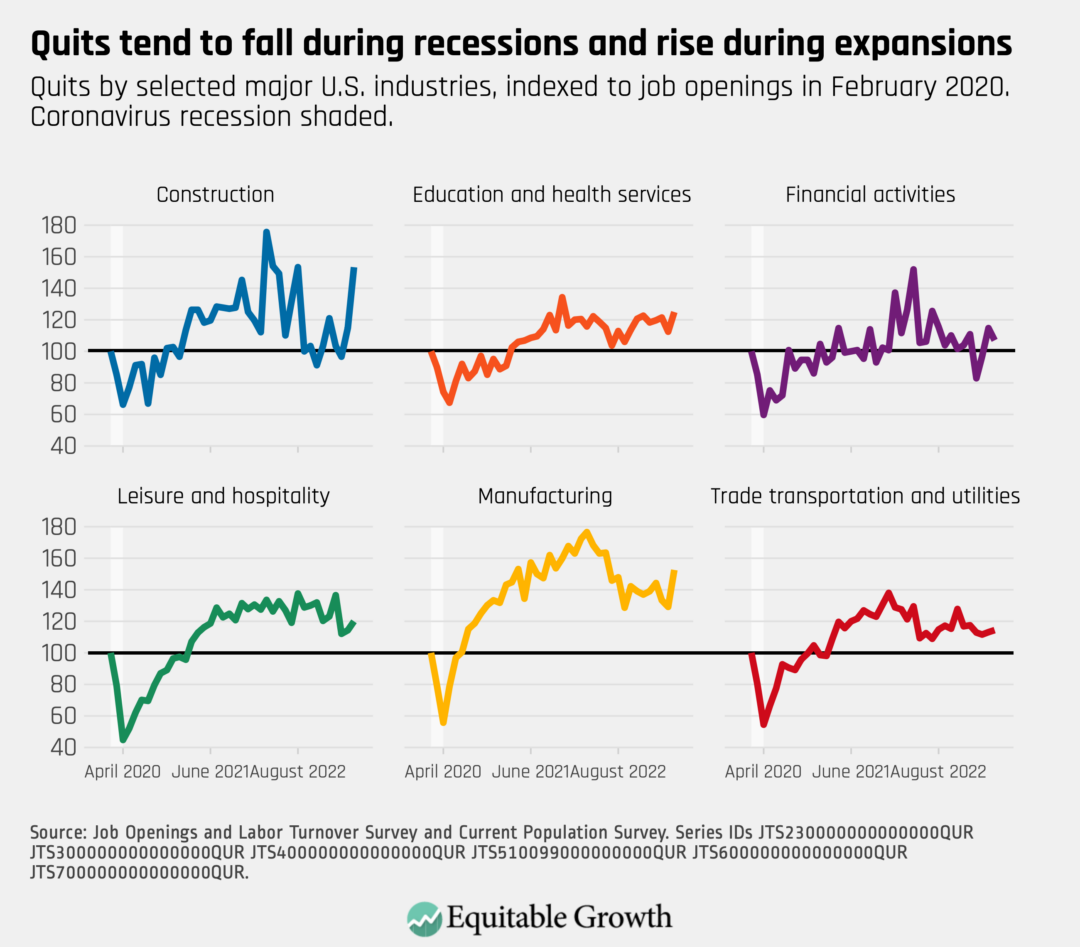
Every month the U.S. Bureau of Labor Statistics releases data on hiring, firing, and other labor market flows from the Job Openings and Labor Turnover Survey, better known as JOLTS. Today, the BLS released the latest data for May 2023. This report doesn’t get as much attention as the monthly Employment Situation Report, but it contains useful information about the state of the U.S. labor market. Below are a few key graphs using data from the report.
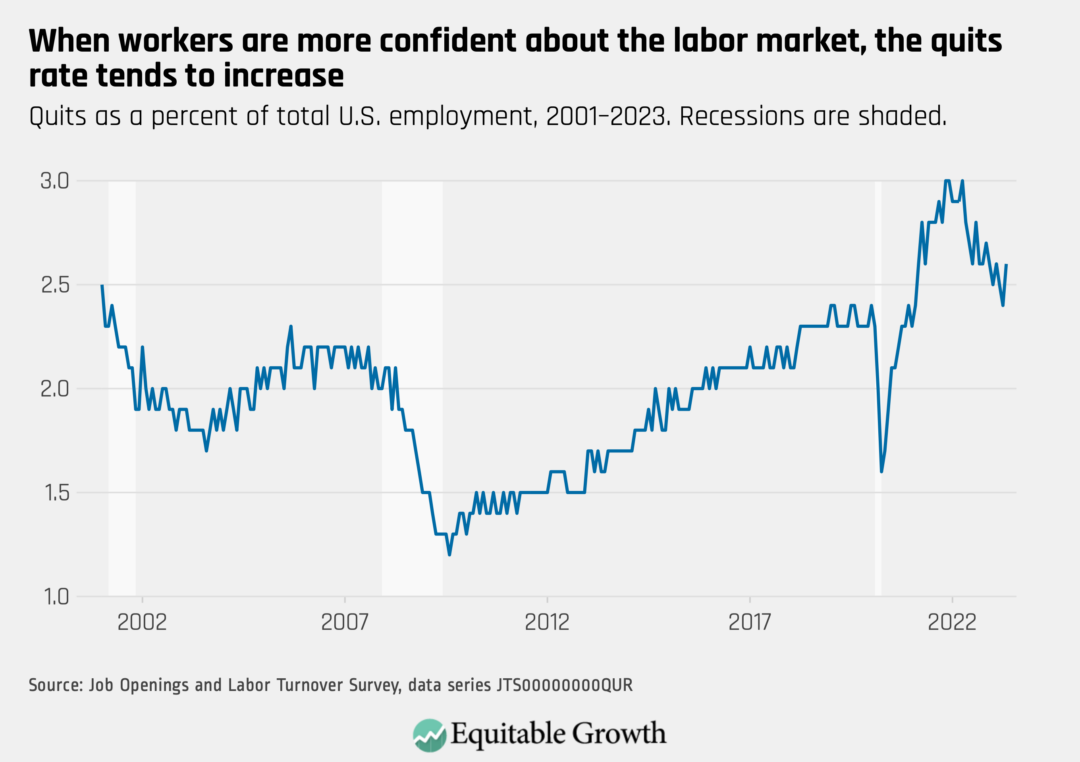
The quits rate rose from to 2.4 percent in April to 2.6 percent in May as more than 4 million workers quit their jobs.
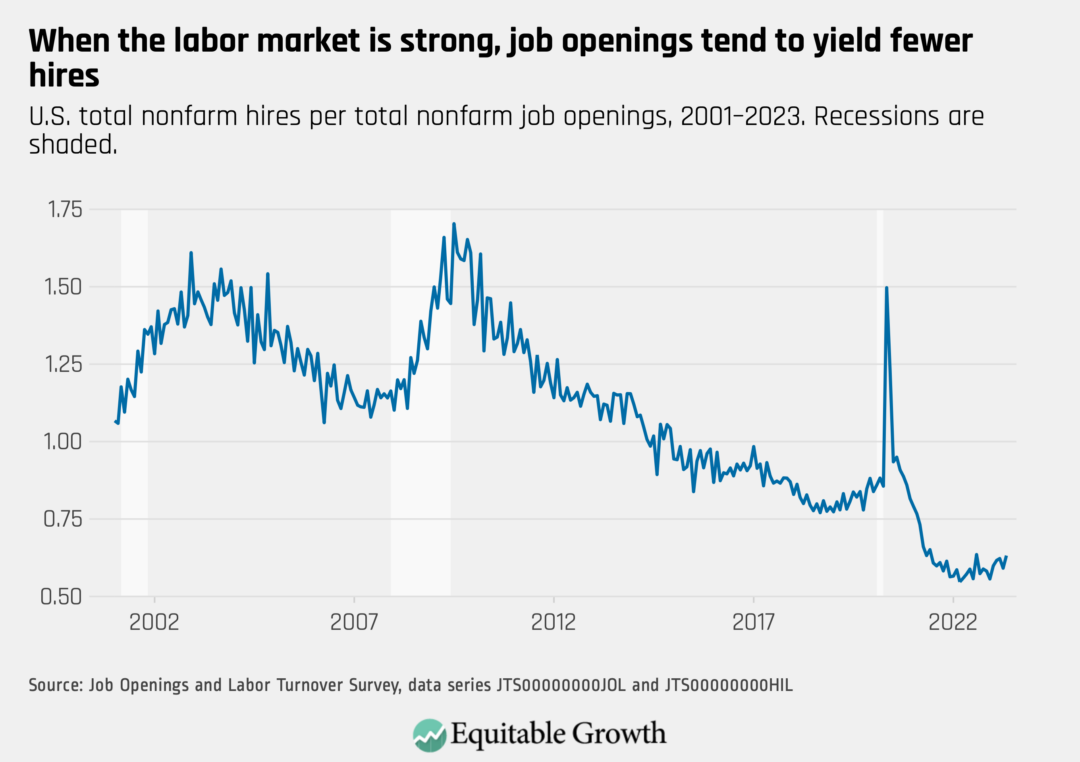
The vacancy yield, a measure that captures how easy it is for employers to fill open positions, rose in May as job openings fell to 9.8 million and hires increased to 6.3 million.
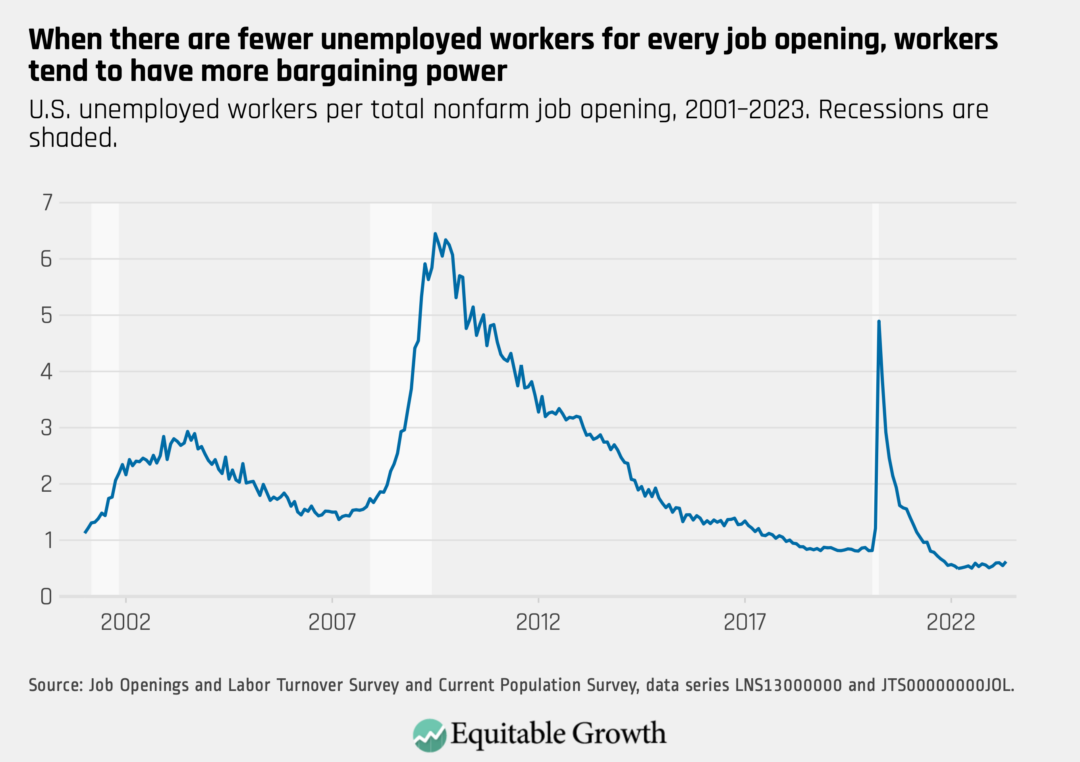
The ratio of unemployed workers to job openings increased slightly in May, as the number of job openings saw a bigger drop than the number of unemployed workers.
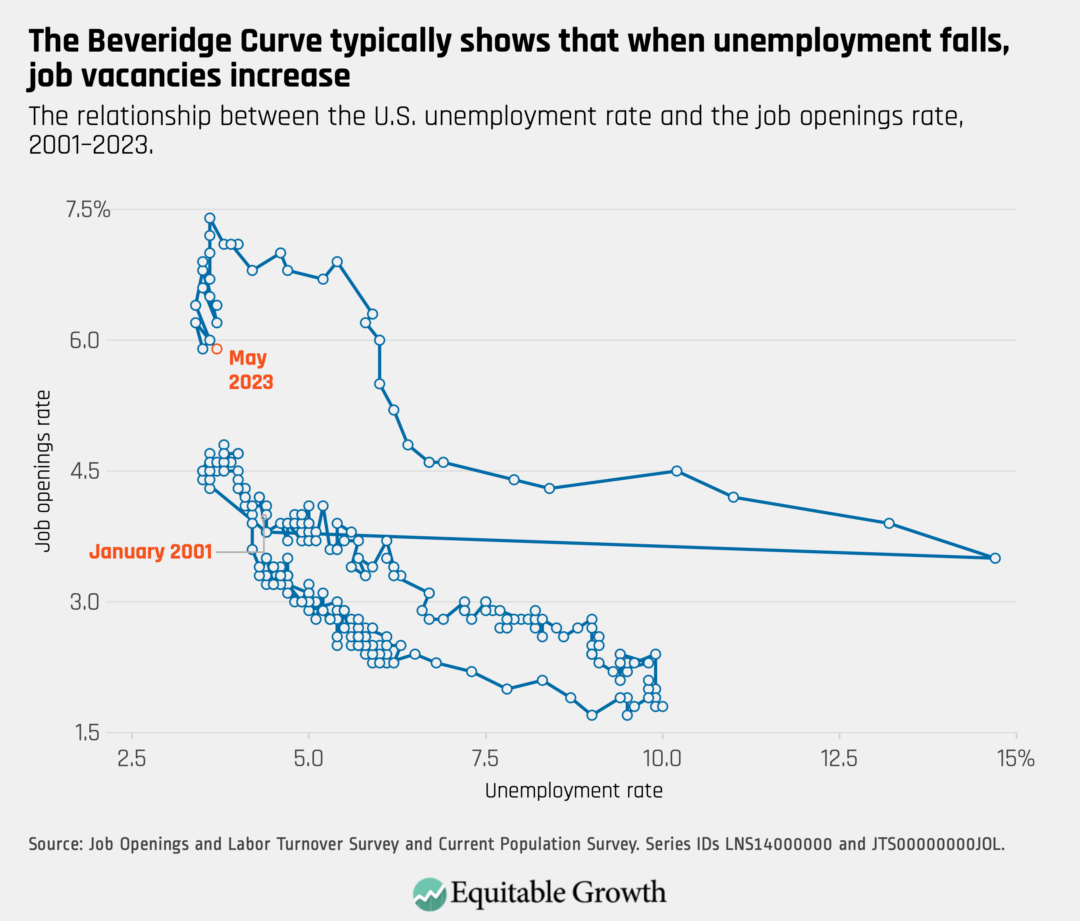
The Beveridge Curve, which usually captures that there tend to be relatively more open positions when the labor market is strong, moved inwards and down as the unemployment rate increased and the job openings rate fell in May.
Most industries experienced an increase in quits in May. There was an especially sharp rise in the construction sector, where the quits rate increased from 2.1 percent to 2.9 percent.
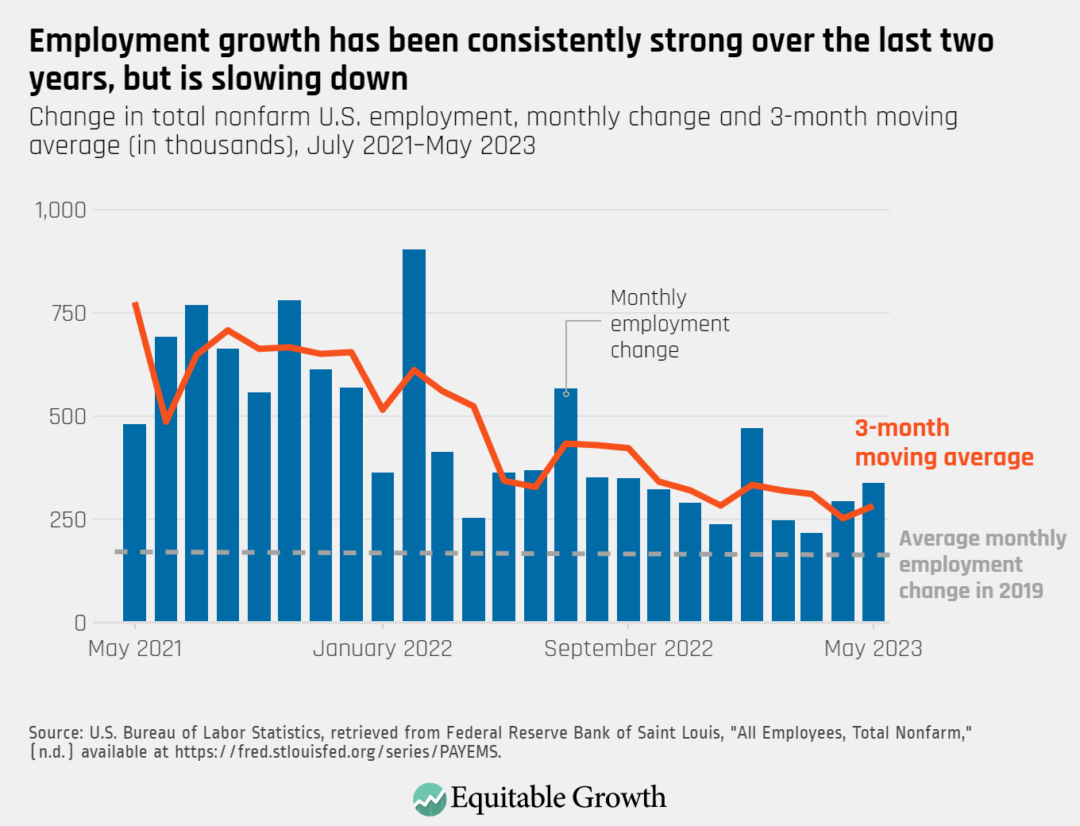
The U.S. economy is now flush with many more jobs than prior to the onset of the COVID-19 recession in early 2020, and employment growth in the country continues to be exceptionally strong—much stronger than in previous early economic expansions. Ahead of the June Jobs Day report on July 7, here is what the employment data say about the health of the U.S. labor market.
Over the past three months the U.S. economy added an average of 283,000 jobs. The prime-age employment-to-population ratio—the share of workers between the ages of 25 and 54 who have a job—stands at 80.7 percent, its highest rate in more than two decades. And the national unemployment rate is low at 3.7 percent, although it registered an uptick in May. (See Figure 1.)
Figure 1
As of May 2023, most major U.S. sectors had fully bounced back from the pandemic shock, with the transportation and warehousing industry experiencing the largest percentage increase in employment since February 2020. With the exception of leisure and hospitality, government, and mining—and even as the information and utilities sectors have suffered net job losses in the past six months—all U.S industries are employing more workers now than prior to the onset of the pandemic. (See Figure 2.)
Figure 2
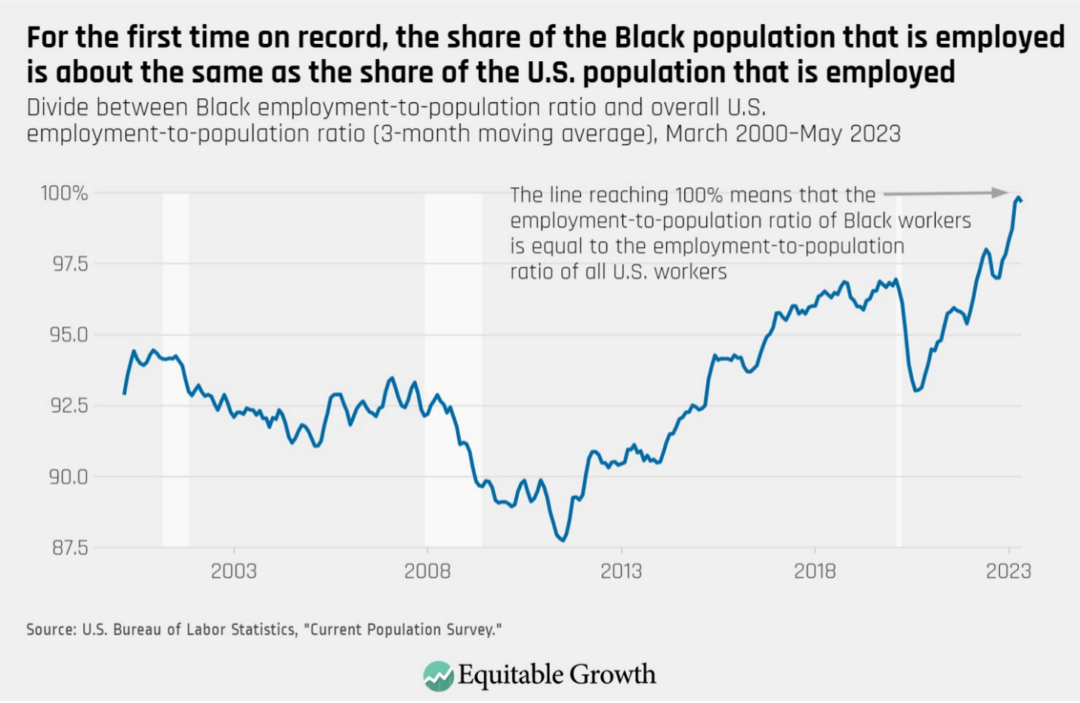
In addition, for about two years now, the strength of the labor market has translated into important gains for low-wage workers and workers of color, resulting in the narrowing of some economic disparities.
Starting in 2021 wage growth, for example, has been stronger for workers in the lower end of the wage distribution than for middle- and high-earning workers. The median Black worker and the median Latino worker also have experienced greater increases in pay than their White counterparts. And in the past year or so, there has been an unprecedented narrowing of the divide between the employment rate of Black workers and the employment rate of all U.S. workers. (See Figure 3.)
Figure 3
Wage growth seems to be slowing down most for some of the lowest paying jobs
When the U.S. Bureau of Labor Statistics releases the most recent employment data for the month of June this Friday, policymakers will have further information on what is happenings to the gains experienced by low-wage workers and workers of color. They also have further information on how the entire U.S. economy is settling into an expansion.
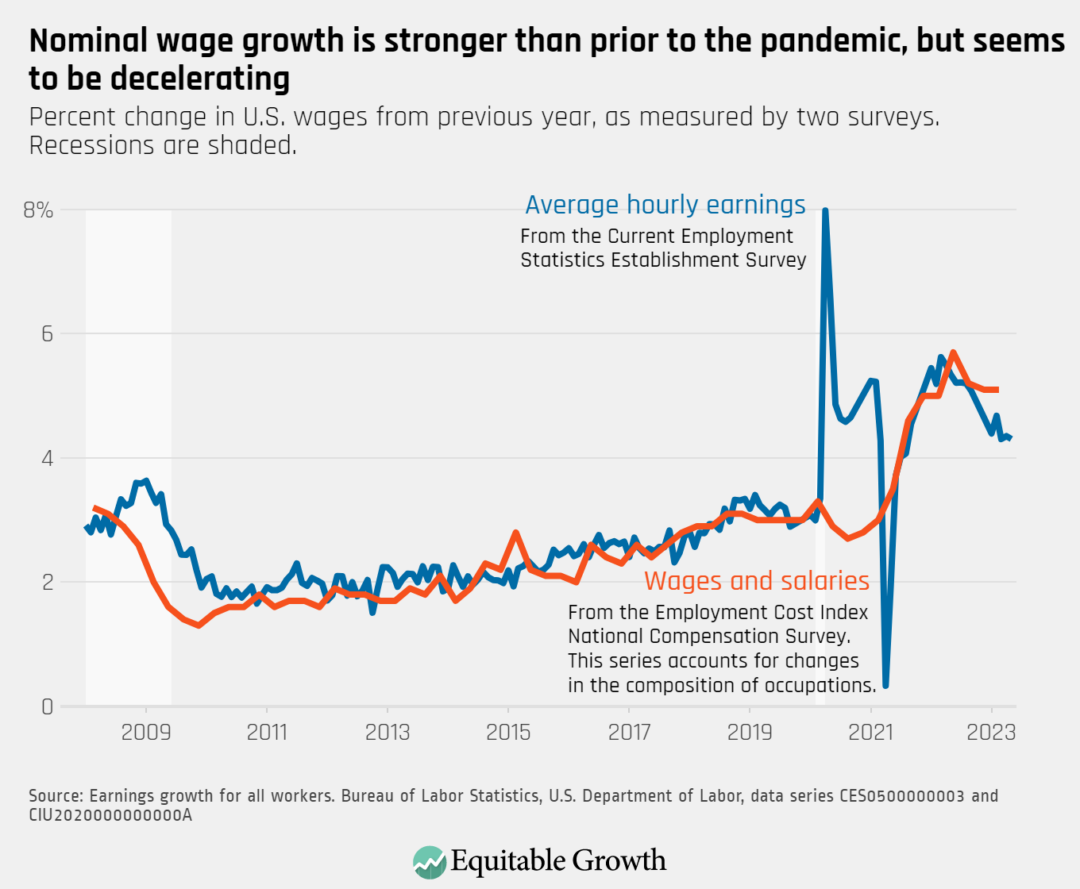
It is still unclear what workers’ enduring experiences will be in a post-pandemic labor market, but a number of economic indicators suggest that the jobs market is not going to be as hot as it was during the immediate aftermath of the COVID-19 recession, which ended in the spring of 2020.
For instance, job growth has come down closer to its 2019 pace. The national quits rate—a good proxy for job-switching and an indicator that signals that workers are confident about their chances of finding a better job elsewhere—also has declined. The number of hires and job openings also are down year-over year. And overall wage growth is also now below its 2022 peak. (See Figure 4.)
Figure 4
While accompanied by a decrease in inflation, this slowdown in earnings growth seems to be especially pronounced for low-wage workers—many of the same workers who say that saw the biggest increases in pay in the immediate aftermath of the COVID-19 recession.
According to an analysis by Indeed, a job listing website, wage growth is tempering across the U.S. labor market but is decelerating much more for positions in the bottom of the pay distribution, including child care jobs. Overall, the posted wages of workers in low-wage occupations grew much more quickly than the wages in middle- and high-wage occupations throughout most of 2021 and 2022, but are now down and rising at a similar pace.
Most indicators show the U.S. labor market is very strong, but some economic disparities could widen anew if policymakers don’t secure post-pandemic gains for workers
The U.S. labor market has proven to be exceptionally resilient over the past two years, and it is normal and expected for increases in job growth to slow down as the labor market surpasses its pre-pandemic employment levels and different parts of the economy bounce back from the initial shocks delivered by the COVID-19 pandemic.
Yet further upticks in the national unemployment rate or a sharp deceleration in wage growth would hurt workers, particularly workers of color and workers holding low-wage jobs. These are the same workers who tend to benefit the most from a strong labor market and are hurt disproportionately during economic downturns.
Policymakers should ensure that the gains made by some of the most vulnerable workers in the U.S. economy are not contingent on the ups and downs of the business cycle. Rather, they should make sure that workers have sufficient bargaining power to secure decent pay, good working conditions, and benefit from the economic value they create.
While the U.S. labor market might not always be as strong as it is now, measures that ensure that workers in the lower end of the pay distribution have access to fair pay and good employment opportunities would further narrow economic inequities and lead to stronger, broadly shared growth.
In the early 19th century, a new type of property tax system emerged in the United States, distinguishing itself from its European counterparts by encompassing all forms of property. This tax system, known as the General Property Tax, went beyond the land-based taxes prevalent in Europe and the United States at the time and even included personal and financial wealth. It essentially functioned as one of the earliest versions of a wealth tax.
For almost a century, the General Property Tax was a cornerstone of the U.S. political and economic infrastructure, contributing a significant portion to the revenues of state and local governments. Unlike the European model, which relied more on central government funding, the General Property Tax showcased the American emphasis on local revenues to finance local government.
The prominence of the General Property Tax waned after the 1930s, however, as it was gradually supplanted by different forms of taxation, including the income tax and the sales tax in the early 20th century and a shift of activity from the local and state governments to the Federal government with large-scale new programs such as the New Deal. Today’s property tax in the United States is focused solely on real estate, the value of which varies greatly from region to region, state to state, and county to county across the nation.
An unintended byproduct of the General Property Tax was the detailed documentation it created, which provides a rich, granular historical dataset on U.S. wealth. Drawing on many primary and secondary sources, our new working paper constructs a new dataset that allows us to chart the evolution of national wealth from 1800 to 1935. We provide a comprehensive, localized measures of wealth at state and county levels. The dataset also enables us to study three fundamental issues:
The trajectory of wealth accumulation during a crucial era of U.S. economic development
The distribution of wealth across different regions of the country
The factors that influenced the local growth of capital
Let’s briefly present all three of these findings detailed in our new working paper.
The immediately striking revelation from the dataset is the rapid acceleration of the growth in national wealth following the Civil War. This is especially evident in regions outside of the South, where stagnation contrasts sharply with the rest of the nation’s prosperity.
At first glance, wealth per capita in the Northeast, Midwest, and South before the Civil War was relatively similar, but this was in large part due to the institution of slavery. Enslaved Americans were regarded as the personal property of their enslavers, implying that Southern states’ wealth figures before emancipation were significantly inflated.
Once we adjust for this by excluding the value of those who were enslaved, the economic realities of Southern states such as Georgia, Florida, and Alabama look starkly different. More than half of these three states’ property was tied to enslavement. As a result, the wealth of White inhabitants in the Southern states seemed much greater than their Northern counterparts due solely to the institution of enslavement.
Furthermore, we find that per capita property value in Southern states experienced a significant decrease, more than 25 percent, from 1860 to 1870, even after the value attributed to enslaved Americans is subtracted. And these negative effects of slavery on the economic development of the South persisted for decades after the Civil War.
Even after considering various geographical, demographic, economic, and inequality factors, counties in the South that had the highest proportion of wealth tied to enslavement saw significantly slower growth over the long term, spanning the 60 years from 1870 to 1930.
The persistence of spatial wealth inequality after the Civil War is another finding. Despite migration flows and increased integration of the U.S. national market, the level of spatial inequality remained high until 1930 and beyond. The wealth hierarchy of counties and states remained largely unchanged, and the share of national wealth possessed by the top 10 percent of counties saw an uptick.
What contributed to the relative wealth of different regions after the Civil War? And why did some areas accumulate wealth faster than others? Our dataset provides some intriguing answers. Geographic features such as climate, topography, soil productivity, and coastal proximity played a significant role in shaping initial wealth and subsequent growth. Other factors, among them literacy rates and population density, also had significant impacts on wealth accumulation.
As regions evolved economically, a trend reminiscent of broader national development emerged. Wealthier regions exhibited lower agricultural employment and a higher concentration in commerce. Manufacturing saw an initial rise and then a decline as regions grew richer.
An important finding in light of the renewed debate about inequality is that wealth inequality within individual counties across the country was negatively correlated with long-term property growth. This correlation remained even when accounting for geographic, demographic, and economic factors. This local-level finding reinforces the broader literature examining the link between inequality and growth. One notable mediator in this relationship was human capital. Regions with higher inequality experienced lower increases in literacy rates.
In sum, the rich information revealed by the historical sources of the General Property Tax that we compiled in this new dataset of localized measures of wealth offers interesting new insights on the determinants of wealth accumulation and should continue to prove useful to economists, historians, and policymakers alike.
— Sacha Dray is an economist at The World Bank, Camille Landais is an economist at the London School of Economics, and Stefanie Stantcheva is a political economist at Harvard University.
This column is the fifth in ourseriesofpieces by guest authors examining systemic racial, ethnic, and gender inequities in the U.S. economy and in access to government social infrastructure and income support programs—inequities that hinder the full growth potential of our economy and the well-being of our society.
LGBTQ+ Pride Month is observed every June to commemorate the Stonewall Riots and celebrate lesbian, gay, bisexual, transgender, and queer pride. The Stonewall riots, also known as the Stonewall uprising, were a series of spontaneous protests by members of the LGBTQ+ community in response to a police raid that began in the early morning hours of June 28, 1969, at the Stonewall Inn in the Greenwich Village neighborhood of New York City. In order to commemorate the anniversary, the first LGBTQ+ parade in the world took place June 30, 1970, in New York City. But what is too often left unsaid in this retelling of the origins of Pride Month are that many of the Stonewall Rioters were Black and Latinx.
The formation of Black LGBTQ+ Pride, or what is also known as Black Pride, helps call attention to this history while also providing a safe space in the present to celebrate those with the dual identities of being part of the African diaspora and being LGBTQ+. The first formal celebration of Black Pride was held on May 24, 1991 in Washington, D.C, and helped organize HIV/AIDS prevention and care information to a community that was decimated by the AIDS pandemic. DC Black Pride helped to catalyze the Black Pride movement, with more than 50 Black Pride celebrations occurring worldwide today, including last month’s DC Black Pride.
Black Pride also is an opportunity to call attention to three important and interrelated areas of equity: economic equity, social equity, and health equity. With recent data demonstrating, for example, that 31 percent of Black LGBT households and 24 percent of Hispanic LGBT households reported earning less than $25,000 annually, compared to 24 percent of Black non-LGBT households and 15 percent of Hispanic non-LGBT households, the need to highlight systemic racial disparities in the boarder LGBTQ+ community could not be more urgent.
Economic inequality based on race, as well as economic inequality based on sexuality, are both well-documented. There is a breadth of research literature, for example, demonstrating the centuries-long wealth gap between Black Americans and White Americans, the enduring impacts of occupational segregation and discrimination, the disproportionate U.S. labor market outcomes on Black Americans during recessions, and a host of other racially inequitable economic outcomes.
Black LGBTQ+ individuals experience compounding race and gender-identity problems alongside particular economic barriers, and thus are more likely to experience poverty compared to both White LGBTQ+ individuals and non-Black LGBTQ+ individuals. More specifically, a 2020 survey from the Center for American Progress finds that 53 percent of Black LGBTQ individuals reported a household income of less than $40,000 a year compared to 41 percent of White LGBTQ respondents. The survey also finds that 69 percent of Black LGBTQ individuals reported discrimination negatively affecting their financial well-being to some degree, while 50 percent of White LGBTQ respondents reported the same. Similarly, 36 percent of Black LGBTQ individuals also reported receiving assistance from the Supplemental Nutrition Assistance Program in the past year compared to 20 percent of White LGBTQ respondents.
Nonetheless, this is just the tip of the iceberg. While federal agencies are beginning to disaggregate economic data by sexuality, improved data infrastructure can help continue to shed light on the impacts of economic inequities faced by the Black LGBTQ+ community. And yet, these economic inequities do not exist in isolation. Rather, they intersect with other aspects of equity and cannot be disentangled, especially health equity and social equity.
Black Pride exists as one means of addressing these inequities. From a social equity standpoint, Black Pride serve as a platform for advocacy and activism, addressing issues such as racism, homophobia, transphobia, and discrimination within and outside of the LGBTQ+ community. Black Prides are much more than just parades, parties and recreational activities—although these also matter—they also provide opportunities for education and awareness-raising, including workshops and panel discussions on topics related to the Black LGBTQ+ community.
Black Pride organizers and attendees join with other members of the African diaspora to deal with the intersection of issues that impact all parts of the Black community such as community policing, homeliness, anti-poverty, the Black Lives Matters movement, gun violence, eliminating food deserts, disaster relief, access to healthcare, vocational education, justice reform, transportation, public school education and public safety issues. With surveys indicating high incidences of police violence and intimate partner violence, it is paramount to address these social issues.
Regarding health equity, all Black Prides offer health screenings and information on a variety of health issues. Black LGBTQ+ individual face unique health issues due the intersecting forms discrimination and stigma that they experience based on their race, sexual orientation, and gender identity. Some of the key health issues that affect Black LGBTQ+ are HIV/AIDS, with Black gay and bisexual men account for the highest rates of new HIV diagnoses in the United States.
Moreover, Black LGBTQ+ individuals experience higher rates of mental health issues as depression, anxiety, and suicidality due to the stress of navigating multiple forms of discrimination and marginalization. Black LGBTQ+ individuals also are more likely to have limited access to quality healthcare and have poorer health outcomes, facing face significant barriers to accessing healthcare due to a lack of culturally competent healthcare providers, discrimination among other providers, and economic disparities that limit access to quality healthcare.
Black Pride leaders and community activists press healthcare providers to recognize and address the unique health issues face by Black LGBTQ+ individuals to provide culturally responsive care that meets their specific needs. Additionally, increased data collection and funding for research and healthcare initiatives that focus on Black LGBTQ+ health is necessary to address the health disparities that exist in this population.
At the Center for Black Equity, of which I am President/CEO, we aim to promote a multinational LGBTQ+ network dedicated to improving health and wellness opportunities, economic empowerment, and equal rights while promoting individual and collective work, responsibility, and self-determination. By calling attention today to three foundational pillars of equity—economic, social, and health—we can uphold the rich legacy of the first Black Pride event in 1991 and continue to build a more equitable society.
—Earl Fowlkes is the President/CEO of the Center for Black Equity (formerly the International Federation of the Black Prides). He served in leadership of DC Black Pride for 15 years.
This post has been updated to reflect that Equitable Growth’s economist sign-on letter, not our comment letter, was submitted to regulations.gov due to an administrative submission error.
In our comment letter, we commend OIRA for taking this important step to update and modernize its guidance for how to analyze the costs and benefits of potential regulations. If finalized, the proposal would bring the Circular A-4 closer to the current state of economic research, better reflecting the realities of how and for whom the current U.S. economy works.
Both our grantees and in-house experts have studied the economic issues undergirding the Circular A-4 since our organization’s inception in 2013. Over that period, Equitable Growth has published hundreds of working papers, issue briefs, and reports that describe how inequality in all its forms—including by income, wealth, race, and gender—constricts economic growth and undermines the universal goal of broad prosperity.
We also have funded and published empirical studies that trace how the economy works in practice, rather than under the assumptions of classical economic theory. As a result of those findings, we have built policy programs that focus on market power and antitrust enforcement, labor unions and other labor market institutions, economic measurement and data disaggregation, and the macroeconomics of climate change, among other topics.
We believe that updating the Circular A-4 in the way proposed will help give policymakers the information they need to make better decisions and, ultimately, improve the country’s trajectory in key economic policy areas. In our organization’s comment letter, we address four issues: distributional analysis and transfers, discount rates, business cycles and general equilibrium analysis, and justifying regulations.
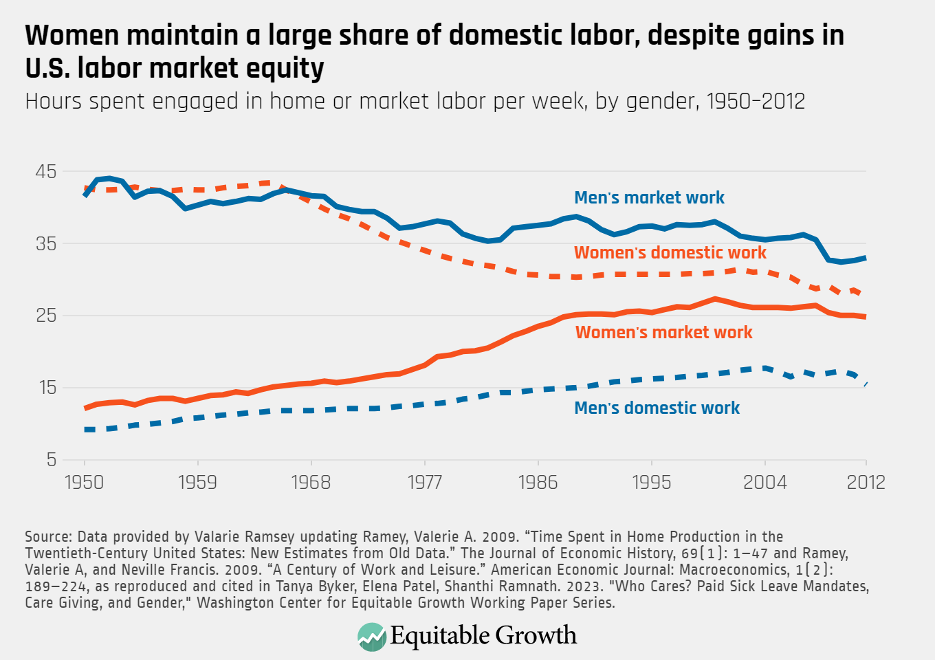
The economic story of the United States in the post-WWII era is arguably the dramatic surge in women’s labor force participation. The increases in hours worked and income generated by women over this period has been pivotal for U.S. economic growth, compensating for the stagnation or only modest gains in men’s income over the same time, especially since the 1970s. Despite these growing professional responsibilities, women continue to shoulder the lion’s share of domestic duties, including child-rearing, caring for loved ones, and homemaking. (See Figure 1.)
Figure 1
This gendered distribution of household labor, especially in the context of care, contributes both to the recent stagnation in women’s U.S. labor force participation and the persistent gender wage gap, making it a recurring impediment to broadly shared economic growth. Some scholars and policymakers point to family-friendly policies, such as paid family and medical leave and affordable child care, as potential tools for fostering gender equity in the home and at work. These provisions equip workers with the time and financial resources necessary to better balance their work and family responsibilities.
Paid sick leave—a workplace benefit offering short-term job protection and wage replacement for workers who are sick or caring for a sick loved one—is one such family-friendly policy that results in a more equitable division of labor at home and at work, according to a recent working paper by Tanya Byker of Middlebury College, Elena Patel of the University of Utah, and Shanthi Ramnath of the Federal Reserve Bank of Chicago.
Importantly, the gendered division of caregiving at home does not necessarily reflect a lack of interest, desire, or expectation on the part of men. While social expectations and gender norms do play into deciding who cares for whom, families also consider other economic factors.
Given the enduring gender wage gap, it may be, on average, more expensive for men than women to take unpaid leave for caregiving purposes. For instance, if the average father earns $1,000 a week and the average mother earns $860 in paid labor—assuming a heterosexual, two-parent household—families will face fewer economic consequences, or opportunity costs, if the mother temporarily halts work to address sporadic or short-term caregiving responsibilities, such as when a child is home sick with a cold or the flu.
These financial considerations create a self-reinforcing cycle where the gender wage gap leads to more caregiving responsibilities for women, and these duties in turn help to maintain the wage gap. Gender-neutral policies that offer wage replacement during times of illness or caregiving, such as paid sick leave or paid family and medical leave, can interrupt this cycle by reducing the opportunity costs for workers who need to step away momentarily from paid work to provide care for a loved one.
Overall 77 percent of U.S. private sector workers have access to paid sick leave, making it a relatively common workplace benefit. But access is not equitable across the economy. Ninety-four percent of workers with wages in the top quartile can take paid sick leave, compared with just 55 percent of workers with wages in the bottom quartile. Likewise, only 51 percent of part-time, private-sector workers have sick leave benefits. To expand coverage, 13 states and the District of Columbia have adopted sick leave ordinances—a legal right for covered workers to accrue sick time on a per-hours-worked basis.
To investigate how these ordinances are influencing workers’ leave-taking behavior, Byker, Patel, and Ramnath used the 2006–2019 basic monthly files of the U.S. Census Bureau’s Current Population Survey. The co-authors compared respondents’ reported absences from work due to sickness or care-giving issues and implemented a two-stage, difference-in-differences model to compare reasons for work absences before and after the implementation of sick leave ordinances, as well as across states without similar laws.
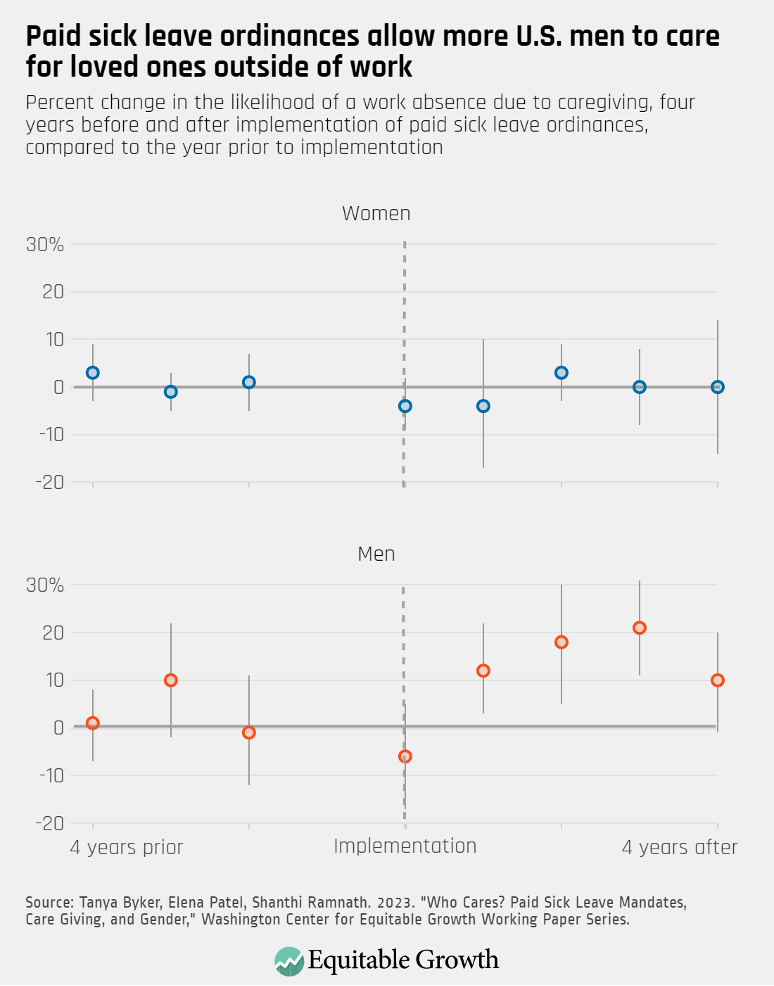
The researchers find that, overall, paid sick leave policies do not significantly increase the likelihood of workers taking leave due to their own illnesses or caregiving duties. These overall findings, however, concealed significant variations by gender, parenthood status, and prior access to leave. Specifically, paid leave ordinances increased the likelihood of men taking leave specifically for caregiving by 10 percent to 20 percent, with the results being primarily driven by men with children in their households.
The increases in caregiving were most notable among men who historically have less access to employer-sponsored sick leave, primarily Hispanic men and those without a bachelor’s degree. Absences for men’s personal illnesses remained unchanged, and no such impact was identified for women, irrespective of whether they had children in the household. Since women were predominantly providing care at home prior to such policies, expanding access to paid sick leave may have facilitated men’s efforts to reach the level of care typically provided by women. (See Figure 2.)
Figure 2
In addition to their implications for gender equity, these findings also underscore how paid sick leave ordinances can serve as an effective, low-risk means of extending access to sick time. The fact that leave-taking behavior remained generally unchanged following the implementation of these ordinances should alleviate employers’ concerns that such policies will result in a significant increase in absences or workers’ misuse of the new benefits.
In fact, only workers with a discernible need for such benefits—mainly Hispanic and less-educated fathers with children at home—altered their work schedules. This aligns with previous research suggesting that sick leave ordinances pose a generally low cost to employers and are most effective when they include employers less likely to provide this benefit otherwise.
There is, of course, no silver bullet for achieving gender equity both at home and in the workplace. Social norms, expectations, and persistent gender-based discrimination continually influence the personal and professional lives of men and women, often in ways that go unseen. This recent research by Byker, Patel, and Ramnath, however, demonstrates how gender-neutral policies can impact the financial decisions families make around caregiving, potentially leading to more equitable divisions of labor.
By enabling fathers to contribute more to home care without sacrificing their wages, paid sick leave plays a vital role in helping men and women balance their personal and professional responsibilities. This balance, in turn, may help shrink the gender wage gap, ultimately paving the way for widespread and more sustainable U.S. economic growth.
The Federal Reserve is at the center of the main story in the U.S. economy, and not just because there’s actual ambiguity around this week’s Federal Open Market Committee meeting. With inflation having moderated considerably, rising just 0.1 percent in May, interest rates are very much a drag on the economy due to the Fed’s aggressive pursuit of price stability over the past year.
This is not surprising. The Fed did what its playbook said it should do—delay rate hikes until it could hike aggressively. U.S. policymakers have added fiscal contraction to delayed monetary policy effects amid headwinds that will continue to build this quarter, but avoiding a debt ceiling catastrophe, a remarkably strong jobs market, and healthy consumer demand are keeping the U.S. economy growing even as growth abroad slows.
The central challenge for the Fed, and policymakers more generally, is how fast to bring inflation down and which tools can achieve the goal of stable prices soonest while balancing the Fed’s maximum employment mandate. Here are some of the factors in play.
Aggregate inflation is moderating, but counterintuitive dynamics abound
June’s FOMC meeting is likely to be the first without a rate hike in more than a year, but the effects of monetary policy notoriously take time to fully work through the economy. Financial conditions are likely to continue tightening for months even as the Fed backs off. An invaluable resource for gauging Fed policy returned this quarter with the New York Fed resuming publication of real-time estimates of the neutral fed funds rate, or r*—the interest rate that would balance today’s economy at the Fed’s employment and inflation targets, for the first time since the beginning of the COVID-19 pandemic in 2020.
Among the most important long-term unresolved questions in macroeconomics is whether the persistent trend in low interest rates the U.S. economy has experienced since the 1990s is showing significant signs of reversing. The rapid recovery from the COVID-19 recession coupled with inflation and higher interest rates from the Fed have led to some speculation that these rates have moved, which would indicate the higher interest rates prevailing in the U.S. economy today are likely to persist. The return of these more rigorous methods confirms that the Fed could cut rates significantly and still slow the economy through reduced demand.
This time is different for monetary policy
Unlike in previous Fed rate-hiking cycles, underinvestment on the supply-side presents price pressures today and risks of higher future inflation if tightening policy too aggressively further weakens future supply. This is especially clear in interest-sensitive sectors such as housing and automobiles.
For instance, after a lost decade of housing construction, 15 years of 30-year fixed mortgage rates frequently under 4 percent, and a refinancing boom at the depths of the pandemic mean more than a quarter of mortgage rates are at 3 percent or less, and only a quarter are higher than 4 percent. This suggests that most homeowners with a mortgage would face very high switching costs if they moved today. Usually a typical rate-hike cycle would reduce housing demand more than it would slow residential construction to lower prices, but in this cycle higher rates are also depressing both the supply of new construction and the supply of housing that would substitute for new construction, creating unpredictable dynamics in housing inflation.
Auto sales have a different, albeit similar story, especially as demand rapidly increases for electric vehicles. The Covid-19 pandemic brought new attention to the auto sector, as supply disruptions drove extreme price volatility. While price volatility, especially for new vehicles, is new, the interest rate sensitivity of auto purchases, as well as the outsized effect of auto sales on the U.S. economy, are not. Vehicle sales make up a large share of consumer spending, while the number of parts in each car mean an even larger fraction of jobs are linked to automotive production.
Higher interest rates decrease the affordability of new and used cars, the vast majority of which are financed, yet the average amount financed remains well above pre-pandemic levels today. The pandemic supply disruption, however, came after a decade of austerity in the auto industry, a time when U.S households bought fewer new cars for most of the 2010s, the average age of vehicles increased steadily, and consumers were squeezed by a soft recovery from the Great Recession of 2007–2009. Automakers responded by offering longer and longer loan terms.
In contrast, during the current economic recovery from the short but sharp COVID-19 recession, the pent-up demand in the aftermath of the previous decade made auto sales surprisingly resilient to higher rates so far.
Between the strength of the U.S. labor market—detailed below— and consumer spending, the second quarter of 2023 is already different from this point in recent recoveries. But the long shadow of the Great Recession is both driving the Fed’s choice of macroeconomic policy and changing how interest rate hikes affect the U.S. economy.
Both monetary and fiscal policy have been contractionary in 2023
The main inflation concerns are still centered around how fast inflation needs to come down, but the combined effect of rapid monetary tightening and fiscal policy have U.S. demand set to cool significantly in the second half of 2023. The optimal policy is for the Fed to maximize employment by letting inflation fall as slowly as possible without affecting expectations of future inflation. This is quite hard, and yet it seems to be working quite well—a day before the June FOMC meeting, market forecasts of 5-year-ahead inflation were identical to those forecasts a decade ago.
Fiscal policy was already contractionary as pandemic-related stimulus spending wound down in the first half of 2023. Moreover, further cuts as a result of the recent debt ceiling deal and the resumption of student loan payments provide more domestic contractionary pressure. Recent research highlighting the distributional impacts on macroeconomic variables such as consumption on many middle and higher-income households suggests the resumption of these payments is likely to reduce consumption substantially.
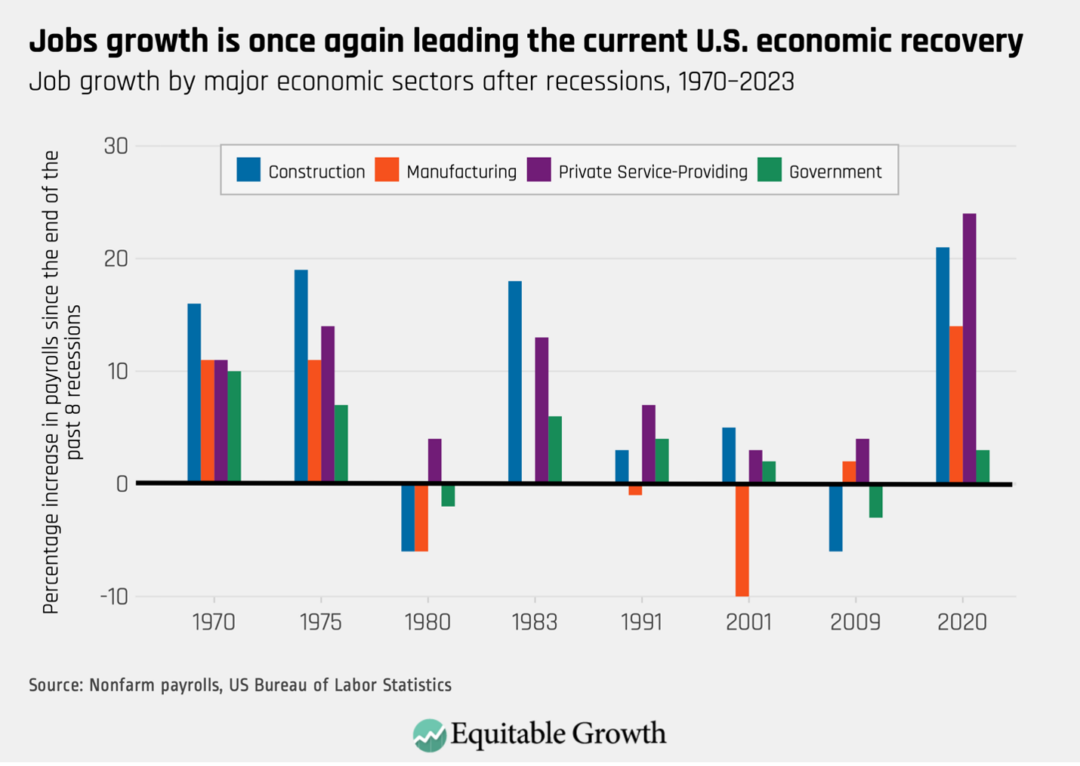
The U.S. labor market is driving the recovery
The shape of the current recovery is very different than the past few economic upturns. The U.S. labor market is leading the recovery. Goods consumption not only led GDP growth out of the recession, but also is having much stronger job recovery than any since the 1990s. (See Figure 1.)
Figure 1
In terms of larger macroeconomic phenomena, the upshot of strong jobs growth with slowing GDP growth is lower measured productivity. It’s still too soon to worry about precisely why productivity would be low right now given the number of disruptions in the economy and the mechanical effects of shocks to employment and output. Even still, declines in productivity in advanced economies are not unusual, underscoring the need for policy to focus on raising productivity.
The United Kingdom, for instance, is experienced a strong jobs recovery with very weak GDP growth following the Great Recession. The lack of productivity growth that resulted from these trends remains difficult to attribute to any specific factor, but after a decade there is little debate that it is a real phenomenon making life materially worse there.
Headwinds abroad
Much as it did immediately after the Covid-19 recession, the U.S. economy experienced many of the price and supply chain disruptions faced by other advanced economies, but grew more strongly, a pattern that appears to be continuing in 2023. The source of strength is the United States reaping the benefits it sowed with unusually strong household support during the depths of the pandemic. U.S. consumers have driven this recovery on the consumption side, and workers have driven the recovery on the production side.
U.S. policymakers must recognize, however, that the United States is not an island. Slowing growth abroad is all the more reason U.S. economic policy must prioritize maximum employment, especially as inflation ebbs.
The Qualified Small Business Stock exclusion, enshrined in Section 1202 of the Internal Revenue Code, permits early-stage venture capital firms and angel investors in high-tech startups, those startups’ founders, and early employees to avoid paying any federal income tax on the capital gains from the eventual sale of early-issued shares in these firms. The QSBS exclusion, which was first enacted into law 30 years ago to promote the creation of these kinds of startups, has undergone major revisions since then. Today, the QSBS exclusion provides tax breaks to those who demonstratively need them the least.
This unnecessary tax break costs the U.S. Treasury an estimated $2 billion to $3 billion a year in lost revenue now and well into the next decade. And those estimates may be seriously understated due to the opaque attributes of the public reporting on the use of the QSBS tax exclusion.
The QSBS exclusion today permits avoiding all taxes on capital gains arising from the sale of early-issued C-corporation stock—a narrow exclusion because more than 90 percent of small businesses in the United States (defined as having less than $10 million of annual revenue) are organized as something other than C-corporations.1 As a result, the QSBS exclusion exacerbates U.S. income and wealth inequality by targeting a tax break toward savvy and already wealthy high-tech investors and (often repeat) entrepreneurs who are perfectly willing to take risks with their money and time without any encouragement from the tax code.
This issue brief details the history of the QSBS exclusion to show how it became a vehicle for perpetuating income and wealth inequality. I then detail the extent to which the revenue losses associated with the QSBS exclusion are understated, perhaps significantly so. I then turn to potential options for reform, among them repealing Section 1202 of the tax code or amending it so that the sweeping 100 percent deduction available today is scaled back for taxpayers with excessively high incomes.
A brief history of the Qualified Small Business Stock exclusion
The U.S. Congress first considered the QSBS exclusion in 1989, when then Sen. John Kerry (D-MA) proposed exempting certain stock from preferential capital gains rates to incentivize “investors to put their money into small and developing businesses.”2 Although his version didn’t gain traction, by 1991 a bipartisan coalition including Kerry and then Sens. Al Gore (D-TN), Trent Lott (R-MS), and Arlen Spector (R-PA) were voicing support for similar legislation.3
The QSBS exclusion finally became law in 1993, which provided reduced capital gains rates on newly issued stock held for more than 5 years, issued by a C-corporation with less than $50 million of gross assets, and involved in an active business. This requirement excludes non-“qualified trades or businesses” such as banking, financing, leasing, and businesses involving the performance of certain skilled services.4
And as previously noted, because the QSBS exclusion limited the tax break to early stage C-Corporations, it in effect also ensured that other kinds of small businesses organized as limited liability companies, sole proprietorships, and S-corporations did not qualify for the tax break. This leaves more than 90 percent of small businesses in the United States (defined as having less than $10 million of annual revenue) ineligible for the tax break.5
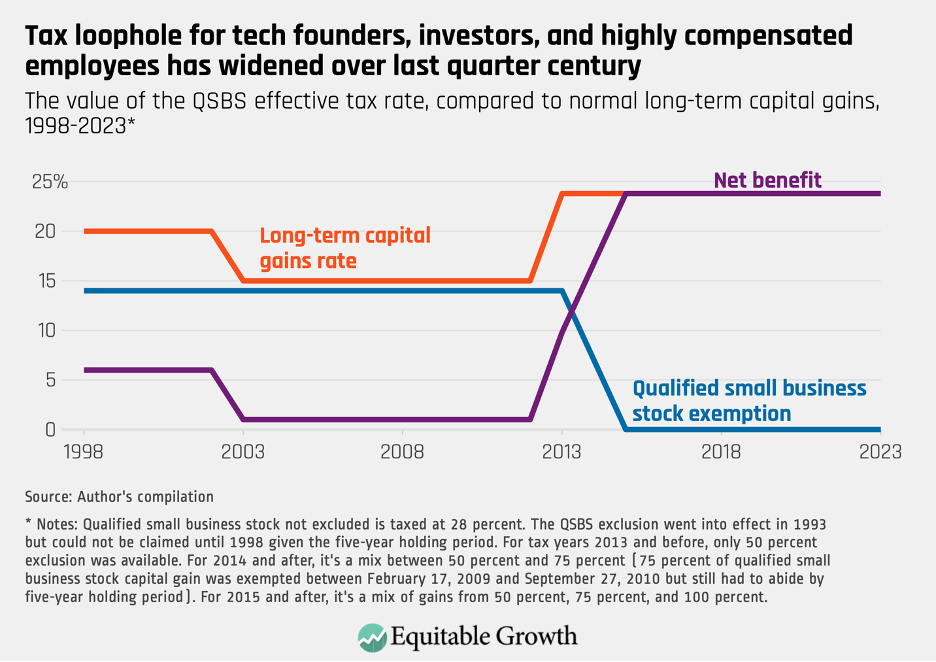
The value of the QSBS exclusion for its intended beneficiaries has waxed and waned since its initial enactment into law. Initially, 50 percent of qualified small business stock was exempted from federal tax, but the tax rate from the sale of qualified small business stock that was not excluded by Section 1202 was pegged at 28 percent, the top capital gains rate in 1993. This resulted in an effective qualified small business stock capital gains rate of 14 percent.
As capital gains rates changed over the years, decreasing to 20 percent in 1998 and to 15 percent in 2003, the tax savings associated with the QSBS exclusion, which still had an effective tax rate of 14 percent, decreased first to 6 percent and then to just 1 percent. With this small differential, the QSBS exclusion provided little by way of tax savings for early investors in young start-up firms, their founders, and early employees.
This changed significantly with the enactment of the Small Business Jobs Act of 2010. The newly updated statute temporarily increased the QSBS exclusion percentage to 100 percent and excluded qualified small business stock from any alternative minimum tax calculations.6 This meant the exclusion could still be used by taxpayers taking many other deductions and who pay very little in taxes overall. Because the top capital gains rate was now 23.8 percent, the benefit of the QSBS exclusion suddenly became very significant in terms of tax savings for its intended beneficiaries.
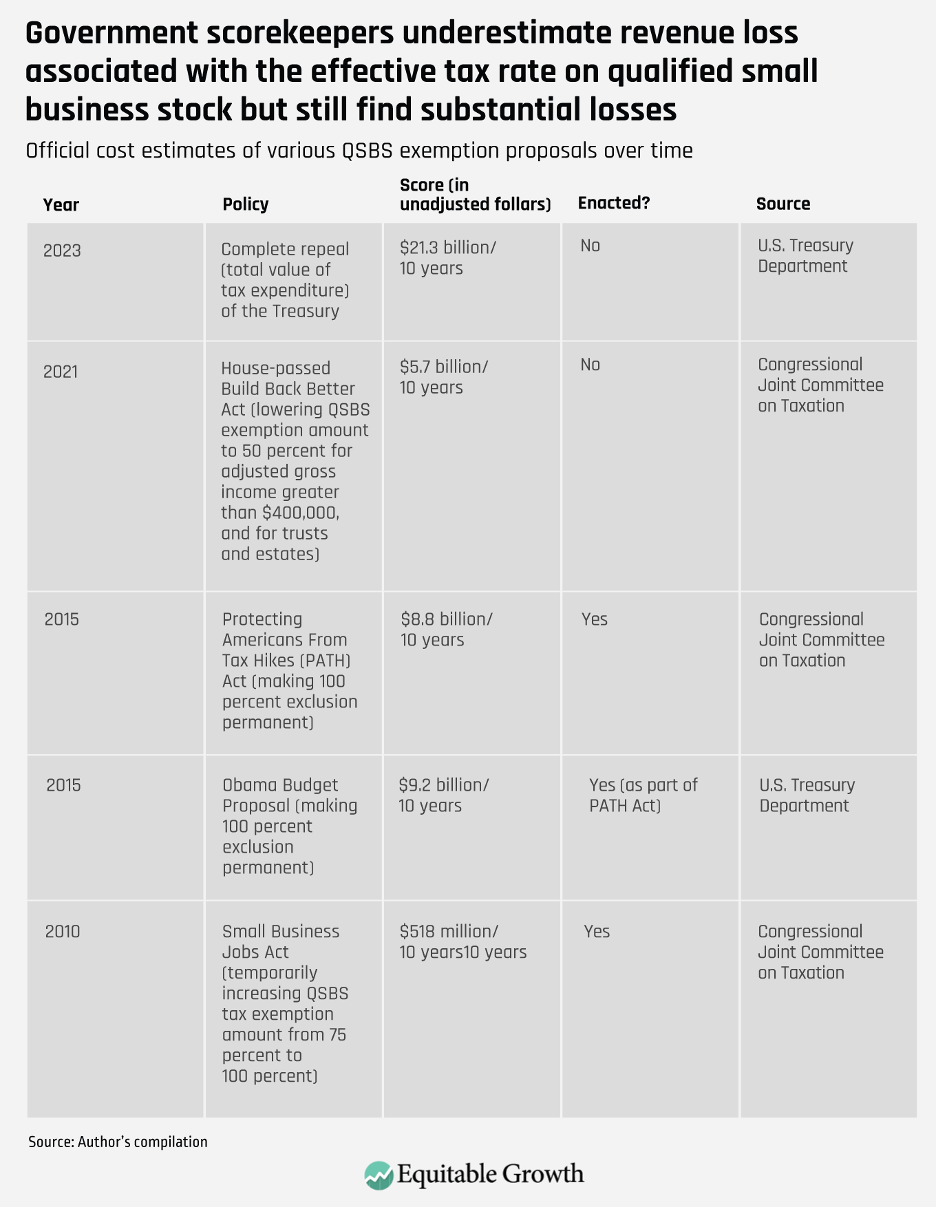
In 2015, these changes were made permanent. Taxpayers acquiring qualified small business stock after September 2010 now had assurance that $10 million (or ten times their initial investment, whichever was greater) of their capital gains, if realized at least 5 years after their investment, would be completely exempt from federal income taxes—and without any income-based restrictions on its use or explicit prohibitions on its use by trusts and estates. (See Figure 1.)
Figure 1
Policymakers considered limiting the QSBS exclusion in 2021, when the U.S. House of Representatives passed the Build Back Better Act. The proposed legislation would have limited the QSBS exclusion to 50 percent (from 100 percent) for taxpayers with adjusted gross incomes of greater than $400,000, and for trusts and estates. The exclusion was never taken up by the U.S. Senate when parts of the Build Back Better Act were folded into the Inflation Reduction Act of 2022, which left the QSBS exclusion untouched.
Who benefits from the Qualified Small Business Stock exclusion?
Qualified small business stock is typically obtained by three groups: the founders of start-up C-Corporations, their early employees, and early-stage venture capital firms and angel investors. Founders receive equity in exchange for their work in launching the company, known colloquially as “sweat” equity. The venture capital firms and angel investors (individuals wealthy enough to invest directly in young startups), and often individual venture capitalists and repeat tech entrepreneurs receive equity in return for providing that early-stage funding. And early employees receive equity in the form of stock options so long as they remain employed by the startup.
Additionally, Section 1202 potentially allows businesses worth billions of dollars to benefit from the exclusion. The reason: “Small” businesses under this law are permitted to have gross assets of up to $50 million and still qualify for the exclusion, but this limit refers to the amount of cash and “aggregate adjusted bases of property” held by the business, not to the actual valuation of the business.7 Thus stock issued by a company valued at, say, $200 million with minimal assets or property that has been completely depreciated (for tax purposes) could still potentially qualify for the QSBS exclusion.
Importantly, once stock is established as qualified small business stock, it retains that classification regardless of how large the business gets. The founders and early investors behind the creation of Uber Technologies Inc., for example, used the QSBS exclusion despite Uber’s valuation at its Initial Public Offering in 2019 of approximately $80 billion.
Achieving the purported benefits of the Qualified Small Business Stock exclusion
There is limited recent work into whether the QSBS exclusion is accomplishing its purported goals of encouraging more high-tech startup formation in the U.S. economy. One study in 2018 found that the exclusion increased funding slightly for qualifying businesses, but those that benefited the most were those which generally had high administrative capacity, meaning they were less likely to be “small.”8 This same study, and one from 2012, found that the early-stage investors—rather than the businesses themselves—captured about a third of the benefit.9
Therefore, the extent to which qualifying businesses truly benefit from the QSBS exclusion is unclear. Most small businesses are precluded from using it while providing a windfall for high-tech startup founders, investors, and employees. These companies are already generally formed as C-corporations due to the administrative complexity of establishing companies as passthrough entities, the greater ease of C-corporations to attract investors, and the prevalence of investors—such as foreign investors and pension funds—who are indifferent to obtaining passthrough losses because they are either not taxed by the United States or are tax-exempt.10
In short, the QSBS exclusion provides a tax break to the founders, investors, and employees in early-stage startups who would have founded, invested, and worked anyway. The provision is giving away tax revenue without providing any meaningful incentive to future innovation and economic growth. Indeed, the QSBS tax exemption provides a massive tax break to taxpayers who arguably need it the least.
Tax data from the IRS show that tax returns using the QSBS exclusion between 2003 and 2020 had, on average, at least $500,000 of reported QSBS capital gains.11 Because neither these taxpayers’ income nor their wealth affect their eligibility to claim the QSBS exclusion, taxpayers with millions of dollars of income and assets pay the same rate — that is, zero—on their post-2010 QSBS capital gains as do taxpayers with minimal income and assets.
The QSBS exclusion also disproportionately benefits White taxpayers compared to Black and Latino taxpayers. As described earlier, the provision benefits startup founders, investors, and early employees—groups in which Black and Latino taxpayers are traditionally underrepresented. As reported by Crunchbase, more than 77 percent of VC-backed startup founders are White, while only 2.8 percent of founders are Black or Latino (the remainder are mostly Asian American founders.)12 Venture capitalist and tech-sector employment by gender and race and ethnicity reveals a similar lack of diversity, with White men managing 93 percent of all VC dollars and the overwhelming majority of tech-sector employees being either White or Asian men. 13
Taxpayers of color also generally obtain their income from working, as opposed to making investments that result in tax-preferred capital gains. This is especially true for investments in companies that are not publicly traded and are therefore inaccessible to lay investors. According to the Federal Reserve Board’s Survey of Consumer Finances, Black and Latino families have, on average, approximately 30 percent of the capital assets of privately held businesses of all kinds that White families own.14 Thus, Black and Latino taxpayers have less access to the investments that can result in qualified small business stock tax benefits.
The cost of the Qualified Small Business Stock exclusion
The U.S. Department of Treasury estimates that repealing the QSBS exclusion would result in $21.3 billion of additional tax revenue between 2023 and 2032, or about $2.1 billion per year.15 The cost of foregone revenue is difficult to measure since qualified small business stock owners might hold their qualified small business stock beyond the 10-year budget window, possibly even until death. This results in complete avoidance of capital gains taxes due to heirs receiving the shares at a stepped up basis, meaning that gain from any future sale is calculated using the value at the time of inheritance rather than the price that was paid by the original owner.
But the lost tax revenue is almost certainly higher than government estimates indicate. Publicly available IRS data only captures QSBS capital gains from stock acquired prior to 2010, which is excluded at a rate of 50 percent or 75 percent. The untaxed capital gains from qualified small business stock obtained after 2010 is fully excluded but is not reported in data provided by the IRS, despite strong evidence that post-2010 QSBS issuance is increasing.16 If post-2010 QSBS capital gains are simply equal to pre-2010 QSBS (still unrealized) gains, then tax revenue lost per year could triple to approximately $3 billion per year.17 (See Table 1.)
Table 1
But it is highly likely that the amount of qualified small business stock held by founders, investors, and early employees increased substantially after 2010. Data from recent Initial Public Offerings indicate that the true cost probably exceeds the estimates issued by government officials, potentially by an order of magnitude.18 Additionally, it has been widely reported that lawyers and accountants have devised sophisticated tax planning techniques to take advantage of the 2010 expansion of the benefit.19
Indeed, although the QSBS exclusion is limited to the greater of $10 million or ten times the basis of the taxpayer’s investment, qualified small business stock can be gifted to other taxpayers who are then able to claim their own $10 million (or greater) exemption.20 An investor anticipating that their stock holdings will someday become valuable can give their stock to friends and family, increasing the exemption many times over.
Holders giving qualified small business stock also are increasingly using alternative structures, such as trusts, to multiply the exemption amount. Because trusts can function as distinct taxable entities even if they have identical beneficiaries, tax advisors have suggested that giving qualified small business stock to qualifying trusts allows for essentially unlimited exclusions.21
This means an investor in a startup with $100 million of capital gains on their qualified small business stock need only create ten trusts all naming the investor’s children as beneficiaries to exclude all this profit from federal taxation. Because the IRS has yet to promulgate regulations clarifying the propriety of these tax planning techniques, savvy taxpayers are able to easily circumvent the stated exemption limits.
These significant costs might still be worth bearing if the QSBS exclusion truly motivated innovation and economic growth. There is no compelling evidence, however, that startup founders, investors, and early employees are engaging in these actions because of the tax savings. For instance, U.S. venture capital financing in 2021 was approximately $330 billion, according to the accounting and business advisory firm KPMG.22
If current government estimates of the cost of the QSBS exclusion are accurate, then it’s unlikely that savings for the exclusion’s beneficiaries of less than 1 percent of total capital allocated will move the needle with regards to early stage investments in startup firms. The QSBS exclusion is likely conferring a windfall on wealthy taxpayers to do what they would have done anyway.
Options for reforming the Qualified Small Business Stock exclusion
The simplest solution is for Congress to repeal the QSBS exclusion in its entirety. In the absence of total repeal, however, imposing additional ability-to-pay restrictions on its eligibility would result in less revenue losses to the U.S. Treasury Department and less inequitable capital gains tax breaks accruing to wealthy investors.
The income limitation and preclusion of eligibility for trusts and estates contained in the Build Back Better Act, for example, was a step in the right direction, but a more nuanced phaseout that increasingly reduced the exclusion as income for investors, founders, and early employees holding qualified small business stock would do more to correct the provision’s distributional inequities. For instance, each dollar of income above $400,000 could reduce the permitted exclusion by an identical amount, thereby precluding the exemption for taxpayers with incomes greater than $800,000.
The Internal Revenue Service should also promulgate regulations that curb abusive qualified small business stock tax and accounting transactions. For instance, current IRS guidance is silent on whether a company’s valuation can be calculated by reference to the adjusted tax basis of the company’s assets. If so, the bonus depreciation that new businesses are permitted to take can artificially decreases a startup company’s “aggregate gross assets” for purposes of the $50 million determination, thereby permitting businesses with valuations much higher than $50 million to still be classified as “small” for QSBS exclusion purposes.
Similarly, the IRS should administratively curtail the ability of savvy taxpayers to gift qualified small business stock to family members and use trusts, especially those with identical beneficiaries, to multiply the QSBS exclusion. Stock should lose its QSBS exclusion status upon its transfer, thereby preventing the original recipients of this now-valuable stock from shifting the tax benefits to other people. The stated purpose of the QSBS exclusion is to promote the development of small high-tech startup businesses, not to provide the friends and family of those investors with tax-free capital gains.
There is limited publicly available data on the QSBS exclusion. Policymakers, economists, and tax specialists alike know neither how much the exclusion really costs, nor the attributes of the taxpayers that qualify for it. Because QSBS exempt capital gains are stated on taxpayer returns, the IRS can and should release precise numbers on how much QSBS exempt capital gains are actually being excluded.
The IRS also should release data on the attributes of the taxpayers availing themselves of the QSBS exclusion. The extent to which the exclusion is used primarily by taxpayers that already have hundreds of thousands of dollars or much more in other income should inform future policy debates about the efficacy of the exemption in promoting small business formation, innovation, and economic growth.
States also have a role in reforming the QSBS exclusion. Of the more than 40 states that tax capital gains, only five include federally excluded QSBS capital gains into their capital gains tax base, and only two of them boast high-tech hotbeds, California and New Jersey.23 The other states unnecessarily piggyback off of federal definitions of capital gains to exclude qualified business stock gains at the state level. States should instead treat capital gains from qualified small business stock identically to other capital gains, and not throw away good state fiscal revenue just because the federal government does so.
Conclusion
The Qualified Small Business Stock exclusion provides an incentive for investment and economic behavior that likely would have happened anyway among the beneficiaries of this capital gains exclusion—early venture capital and angel investors in start-up firms, their founders, and their earlier employees—at a revenue cost that likely exceeds current governmental estimates. By excluding these capital gains, the provision gives an unneeded windfall to the wealthy.
The QSBS exclusion is most prevalent in the tech sector, an industry in which certain racial and ethnic groups have been systematically excluded. This makes its continued prevalence that much more indefensible. The IRS, the U.S. Congress, and state legislatures and state tax authorities should all strive to curtail its significance in the U.S. tax code and state tax codes.
— Manoj Viswanathan is a professor of law and the Harry and Lillian Hastings Research Chair and Co-Director of the Center on Tax law at the University of California College of the Law, San Francisco (formerly UC Hastings)
When most Americans think about how economic well-being transfers from parents to children, they will likely think about income, consumption, and wealth. After all, parents’ ability to provide for and invest in their children’s future is directly related to the parents’ income and wealth.
As it turns out, the well-being of children as they grow up and leave home is much more strongly related to income and to consumption than it is to wealth. Does this mean parents’ wealth is relatively unimportant in determining the well-being of their children when they grow up? No. Even moderately high parental-wealth for lower-income parents improves children’s well-being in adulthood. Their children, on average, have higher well-being when they grow up than children whose parents had higher income but with low wealth. The same holds true for their children’s consumption in adulthood.
These findings in our new working paper, “Intergenerational Mobility using Income, Consumption, and Wealth,” are important for policymakers to understand as they consider ways to encourage greater economic mobility in our society. The high wealth inequality in the United States due to decades of stagnant income growth among those toward the bottom of the income distribution presents a clear challenge to our society and future U.S. economic growth.
Our working paper uses 50 years of data from the Panel Study of Income Dynamics, or PSID, to study the correlation between parental well-being and the well-being of their children when they grow up. Our research builds on the important work of the Opportunity Insights team and former Equitable Growth Steering Committee member Raj Chetty and his co-authors. The Opportunity Insights team uses income across generations to measure intergenerational economic mobility.
One of the value-adds in our paper is that we use not only income, but also consumption and wealth. Consumption may better represent families’ standards of living than income in a year because families may borrow money when income is low, or conversely, may save money for emergencies or retirement. Consumption, in short, can indicate long-term standards of living better than income.
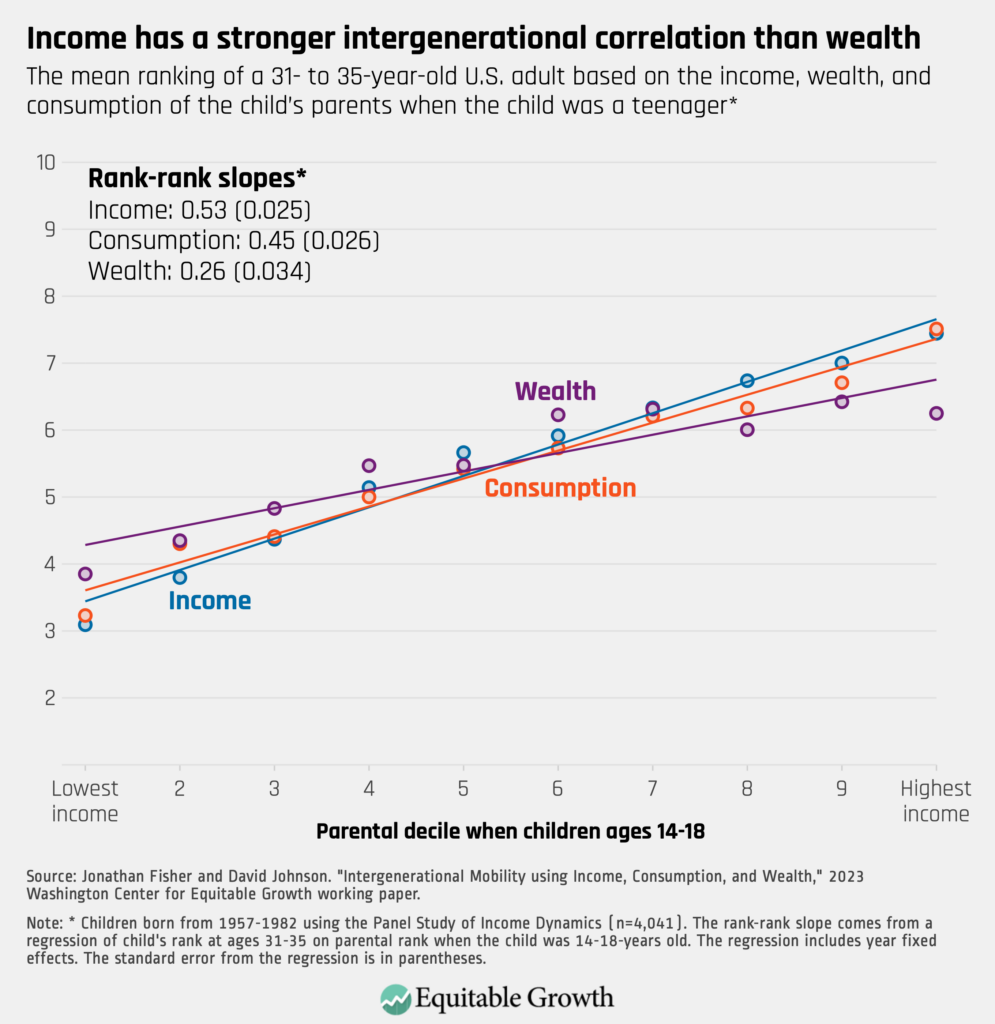
Wealth is the most unequally distributed component of inequality in the United States and may be the easiest to transfer across generations. Yet we find the strongest correlation between parents and children when they grow up is for income. Consumption has a slightly weaker correlation, and wealth has the weakest correlation.
For income, a typical child born into the bottom 10 percent of the income distribution will end up on average around the 30th percentile when they are in their 30s. A typical child born into the top 10 percent of the income distribution will end up on average around the 74th percentile when they are in their 30s. To help get a sense of the difference, the typical 31-to-35-year-old today at the 30th percentile has income around $56,000. The 74th percentile is more than double at $132,000.24
For consumption, a typical child born into the bottom 10 percent of the consumption distribution will end up on average around the 32nd percentile when they are in their 30s. A typical child born into the top 10 percent of the consumption distribution will end up on average around the 75th percentile when they are in their 30s.
For wealth, the percentile gap difference in adult wealth is much smaller. A child born in the bottom 10 percent of the wealth distribution on average ends up around the 40th percentile when reaching the ages of between 31 to 35, and a child born into the top 10 percent of the wealth distribution ends up around the 65th percentile at the same ages. (See Figure 1.)
Figure 1
Does this lower correlation for wealth mean that we should be less concerned about the high levels of wealth inequality in the United States? The answer is no for two reasons.
First, the PSID data misses the very top of the wealth distribution. These families with generational wealth may be able to guarantee that their children and their grandchildren remain wealthy. Ongoing research by Equitable Growth grantee Fabian Pfeffer at the University of Michigan will enable researchers and policymakers alike to look at the intergenerational correlation in wealth among the ultrawealthy.
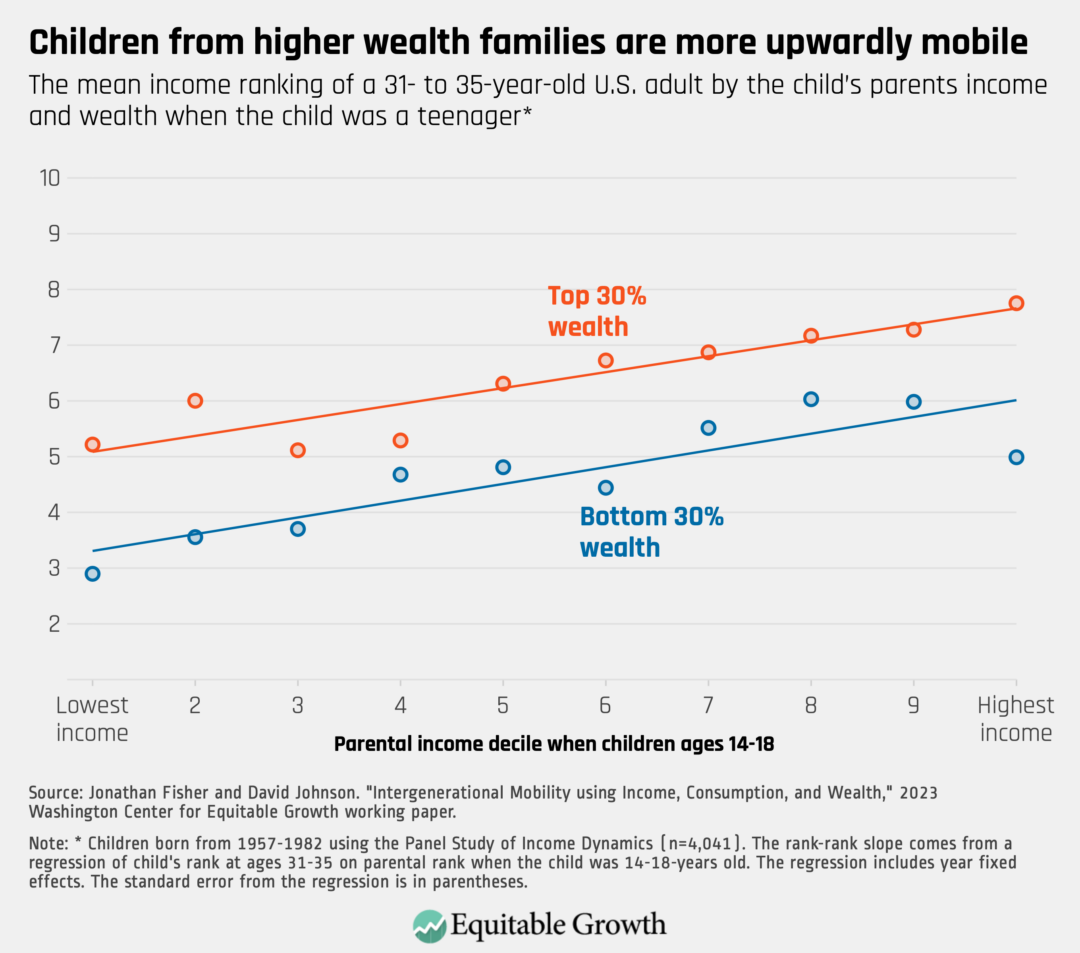
Our working paper addresses a second way that even parents with more moderate amounts of wealth are able pass advantages to their children. How? We look at the correlation in income between parents and the well-being of their children by parental wealth. We take the top 30 percent of wealthy parents and compare the outcomes of their children to parents from the bottom 30 percent of wealth and their children.
A child raised in a family with income in the bottom 10 percent and wealth in the bottom 30 percent ends up around the 29th percentile of the income distribution. In contrast, a child raised in a family with income in the bottom 10 percent and wealth in the top 30 percent ends up about 20 percentiles higher on average, around the 51st percentile of the income distribution. In today’s dollars, this amounts to $28,000 more in income, from $59,000 to $87,000, demonstrating the power of even moderate levels of wealth. (See Figure 2.)
Figure 2
High parental-wealth acts as a buffer for children raised in lower-income families by helping the children attain higher income as an adult. Families with higher wealth, for example, live in neighborhoods with better schools. Alternatively, higher wealth parents send their children to private schools, or the parents pay for college.
For children growing up in higher-income families, high parental-wealth acts as an accelerant to the already high parental-income, creating a double advantage for these children. We find similar results for the correlation between parental consumption and child consumption when they grow up.
The importance of wealth, and lack of wealth, also can be seen by comparing that low-income but high-wealth family to a high-income but low-wealth family. A child born to the top 10 percent of income but the bottom 30 percent of wealth ends up around the same place—around median income—as an adult when compared to a child born to the bottom 10 percent of income but top 30 percent of wealth.
The same basic story holds true for consumption. A child born to the top 10 percent of consumption but the bottom 30 percent of wealth ends up 10 percentiles lower in the consumption distribution as an adult when compared to a child born to the bottom 10 percent of consumption but top 30 percent of wealth.
Thus, this wealth inequality harms economic growth by giving advantage to the children of those with high wealth regardless of the parents’ income or parents’ consumption. These disparities in income, consumption, and wealth lead to the so called “lost Einsteins,” or children unable to meet their potential as adults, which hampers overall U.S. economic growth and further exacerbates economic inequality across income, wealth, and consumption.